. 2024 Jun 8;7(1):708.
doi: 10.1038/s42003-024-06354-8.

Novel FFPE proteomics method suggests prolactin induced protein as hormone induced cytoskeleton remodeling spatial biomarker

Affiliations

Novel FFPE proteomics method suggests prolactin induced protein as hormone induced cytoskeleton remodeling spatial biomarker

Jakub Faktor et al. Commun Biol. .

Abstract

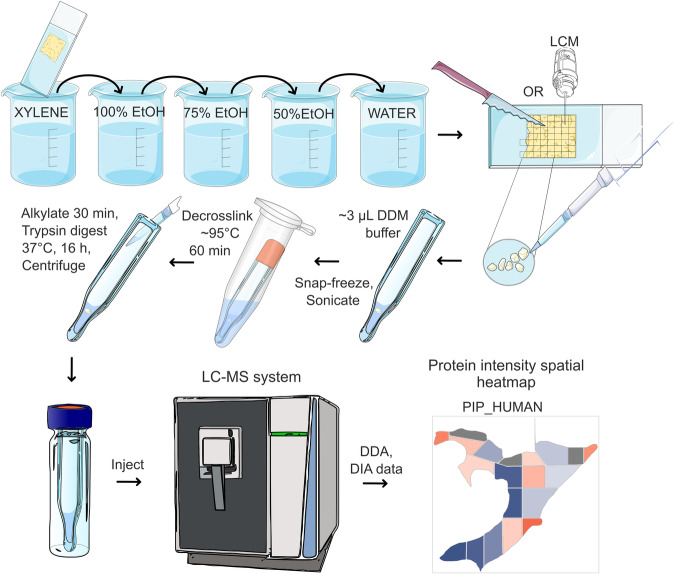
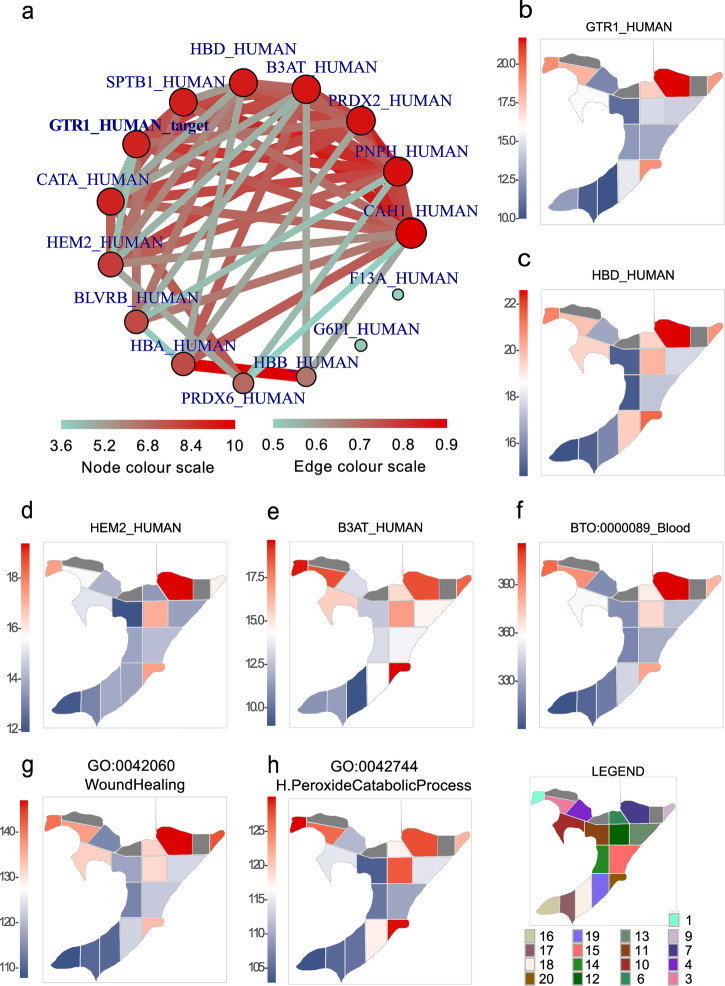
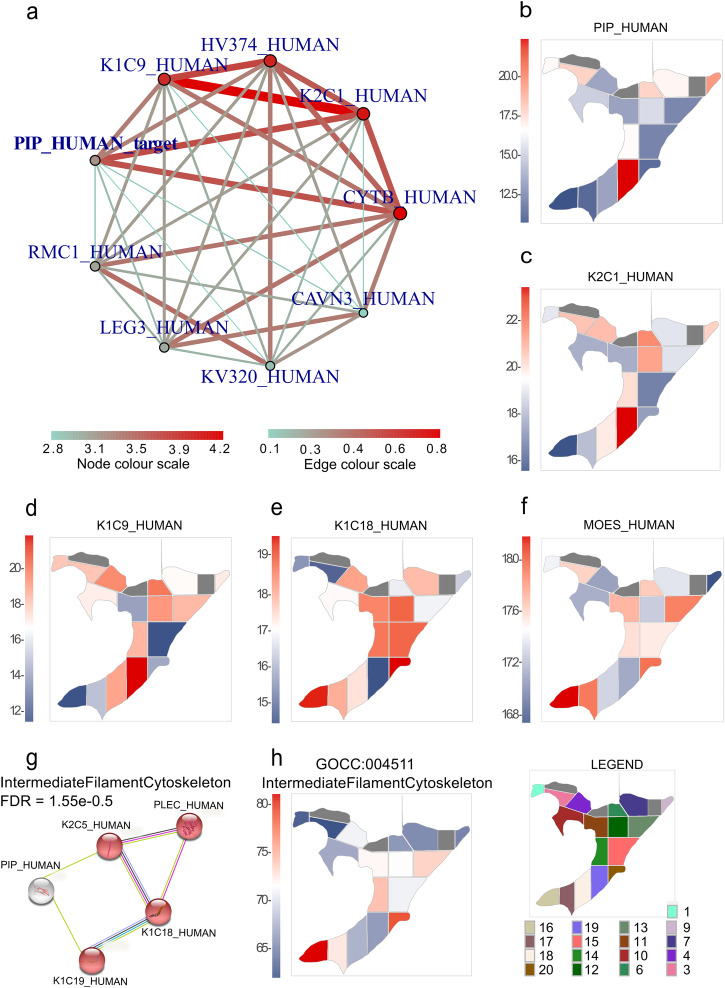
Robotically assisted proteomics provides insights into the regulation of multiple proteins achieving excellent spatial resolution. However, developing an effective method for spatially resolved quantitative proteomics of formalin fixed paraffin embedded tissue (FFPE) in an accessible and economical manner remains challenging. We introduce non-robotic In-insert FFPE proteomics approach, combining glass insert FFPE tissue processing with spatial quantitative data-independent mass spectrometry (DIA). In-insert approach identifies 450 proteins from a 5 µm thick breast FFPE tissue voxel with 50 µm lateral dimensions covering several tens of cells. Furthermore, In-insert approach associated a keratin series and moesin (MOES) with prolactin-induced protein (PIP) indicating their prolactin and/or estrogen regulation. Our data suggest that PIP is a spatial biomarker for hormonally triggered cytoskeletal remodeling, potentially useful for screening hormonally affected hotspots in breast tissue. In-insert proteomics represents an alternative FFPE processing method, requiring minimal laboratory equipment and skills to generate spatial proteotype repositories from FFPE tissue.


Conflict of interest statement

The authors declare no competing interests.

Figures

Fig. 1
Fig. 1. In-insert spatial proteomics workflow.
In-insert proteomics involves processing FFPE sample voxels in a glass insert by transferring the steps of classical protocols to the microliter scale in a wet chamber and omitting mass spectrometry incompatible substances. Low sample loss during In-insert FFPE processing allows spatial proteomic research of biochemical signaling pathways and biomarkers in a glass insert, while keeping low cost of analysis. Implementing DIA/SWATH mass spectrometry enables post-acquisition mining that provides detailed insight into spatial quantitative proteomic signatures within a FFPE slide, relying entirely on publicly available freeware. Freely available Bioicons repository was used to create the modified shapes in this figure (https://bioicons.com/).
Fig. 2
Fig. 2. Qualitative analysis of peptides and proteins identified across FFPE tissue voxels.
a Total number of unique peptides identified using a multi-search engine strategy (MaxQuant – “MQ”, MSFragger – “FRG”, Comet – “CMT”) applied to both DDA and DIA data across 17 BFPT voxels. b Total number of proteins identified using a multisearch engine strategy (MaxQuant, MSFragger, Comet) applied to both DDA and DIA data across 17 BFPT voxels. c Comparison of MaxQuant with matches between runs (DDA_MQ-MBR), MaxQuant (without MBR) (DDA_MQ), MSFragger and Comet search engines applied to both DDA (DDA_FRG and DDA_CMT respectively) and DIA data (DIA_FRG and DIA_CMT respectively) plotted as number of protein groups identified. The data suggest that MaxQuant with MBR function performs better than other search engines. In addition, c shows that DDA data yields more identified protein groups compared to DIA data regardless of the search engine used. d The Venn diagram shows the overlap of peptides identified in MaxQuant with MBR, MaxQuant (without MBR), MSFragger and Comet. The Venn diagram shows that MaxQuant with MBR function identifies the most peptides while most peptides identified in other search engines are included in the MaxQuant MBR search result. e MaxQuant with MBR function identifies most proteins compared to MSFragger and Comet, regardless of the data used. Figure e is consistent with d, which describes the same result at the peptide level.
Fig. 3
Fig. 3. Subcellular protein localization and trypsin digestion miscleavage.
a Protein subcellular localization retrieved from Uniprot Subcellular Localization. The percentage of proteins in a given localization was determined using keyword analysis. The considered subcellular localizations in the analysis were cytoplasm (red), extracellular space (green), nucleus (dark blue), and plasma membrane (brown). b Protein subcellular localization from Gene Ontology (GO). The percentage of proteins in a particular localization was calculated using the same method as in a. c The percentage of total semi-tryptic peptides across 17 voxels. d The percentage of total miscleaved peptides across 17 voxels. e The ratio of trypsin cleavage at lysine and arginine residues. The trypsin preference of lysine over arginine at the C-term of identified tryptic peptides shown in blue or at the nearest upstream tryptic peptide (identified peptide N_term minus one aminoacid) shown in red was determined. The analysis shows an overall preference for tryptic cleavage at arginine in almost all voxels.
Fig. 4
Fig. 4. Analysis of modification landscape in In-insert processed FFPE samples.
a Frequency of the 8 most abundant mass shifts expressed as a percentage of the total peptides identified. b Analysis of distribution of the 8 most abundant mass shifts among amino acids. The size of the letter abbreviation of the amino acid reflects the percentage of the total modified peptides that have the mass shift on the aminoacid. c Comparison of the frequency of the 8 most abundant mass shifts across 17 voxels expressed as a percentage of the total peptides identified. d Analysis of trypsin miscleavage with respect to lysine methylation, expressed as a percentage of total peptides. e Analysis of trypsin miscleavage with respect to lysine methylation, expressed as a percentage of modified and miscleaved peptides.
Fig. 5
Fig. 5. Spatial quantitative proteomic analysis of blood related proteins and signaling pathways.
a A protein regulation adjacency network for solute carrier family 2, facilitated glucose transporter member 1 (GTR1) was determined based on the adjacency of its spatial quantitative values to the spatial quantitative values of other quantitated proteins across 17 BFPT voxels. bh show the spatial heatmaps of the protein intensity or the summed protein intensity of the revealed biochemical pathway. Protein intensity or summed protein intensity is plotted as a blue and red shades. The intensity is directly proportional to color shading, from the lowest intensity represented as dark blue to dark red representing the highest intensity. b A spatial heatmap of GTR1 intensity across BFPT voxels. c A spatial heatmap of hemoglobin subunit delta (HBD) intensity across BFPT voxels. d A spatial heatmap of delta-aminolevulinic acid dehydratase (HEM2) intensity across BFPT voxels. e A spatial heatmap of band 3 anion transport protein (B3AT) intensity across BFPT voxels. f The summed protein intensity of “BTO:0000089_Blood” term members plotted as spatial protein intensity heatmap across 17 BFPT voxels. g The summed protein intensity of “GO:0042060_WoundHealing” term members plotted as a spatial protein intensity heatmap across 17 BFPT voxels. h The summed protein intensity of “GO:0042744_H.PeroxideCatabolicProcess” term members plotted as spatial protein intensity heatmap across BFPT voxels.
Fig. 6
Fig. 6. Spatial quantitative proteomic analysis of prolactin-inducible protein (PIP) adjacency network.
a A protein regulation adjacency network of PIP determined from the adjacency of its quantitative values to quantitative values of other quantitated proteins across 17 BFPT voxels. bf, h show spatial heatmaps of protein intensity or enriched term summed protein intensity. The protein intensity or summed protein intensity is plotted as a blue and red shades. The intensity is directly proportional to color shading, from the lowest intensity represented as dark blue to dark red representing the highest intensity. b A spatial heatmap of PIP intensity across BFPT voxels. c A spatial heatmap of keratin, type II cytoskeletal 1 (K2C1) intensity across BFPT voxels. d A spatial heatmap of keratin, type I cytoskeletal 9 (K1C9) intensity across BFPT voxels. e A spatial heatmap of keratin, type I cytoskeletal 18 (K1C18) intensity across BFPT voxels. f A spatial heatmap of moesin (MOES) intensity across BFPT voxels. g The STRING analysis links proteins from PIP adjacency network into the functional protein network of the intermediate filament. h The summed protein intensity of the term “GOCC:004511_IntermediateFilamentCytoskeleton” plotted as a spatial protein intensity heatmap across 17 BFPT voxels.

Similar articles

Cited by

References

    1. Marchione DM, et al. HYPERsol: High-Quality Data from Archival FFPE Tissue for Clinical Proteomics. J. Proteome Res. 2020;19:973–983. doi: 10.1021/acs.jproteome.9b00686. - DOI - PMC - PubMed
    1. Herrera JA, et al. Laser capture microdissection coupled mass spectrometry (LCM-MS) for spatially resolved analysis of formalin-fixed and stained human lung tissues. Clin. Proteom. 2020;17:24. doi: 10.1186/s12014-020-09287-6. - DOI - PMC - PubMed
    1. Shi S-R, Liu C, Balgley BM, Lee C, Taylor CR. Protein extraction from formalin-fixed, paraffin-embedded tissue sections: quality evaluation by mass spectrometry. J. Histochem. Cytochem. J. Histochem. Soc. 2006;54:739–743. doi: 10.1369/jhc.5B6851.2006. - DOI - PubMed
    1. Jiang X, et al. Development of Efficient Protein Extraction Methods for Shotgun Proteome Analysis of Formalin-Fixed Tissues. J. Proteome Res. 2007;6:1038–1047. doi: 10.1021/pr0605318. - DOI - PubMed
    1. Mantsiou A, et al. Proteomics Analysis of Formalin Fixed Paraffin Embedded Tissues in the Investigation of Prostate Cancer. J. Proteome Res. 2020;19:2631–2642. doi: 10.1021/acs.jproteome.9b00587. - DOI - PubMed

Publication types