. 2024 Jun 8;15(1):4914.
doi: 10.1038/s41467-024-49234-9.

FOXA2 rewires AP-1 for transcriptional reprogramming and lineage plasticity in prostate cancer

Affiliations

FOXA2 rewires AP-1 for transcriptional reprogramming and lineage plasticity in prostate cancer

Zifeng Wang et al. Nat Commun. .

Abstract

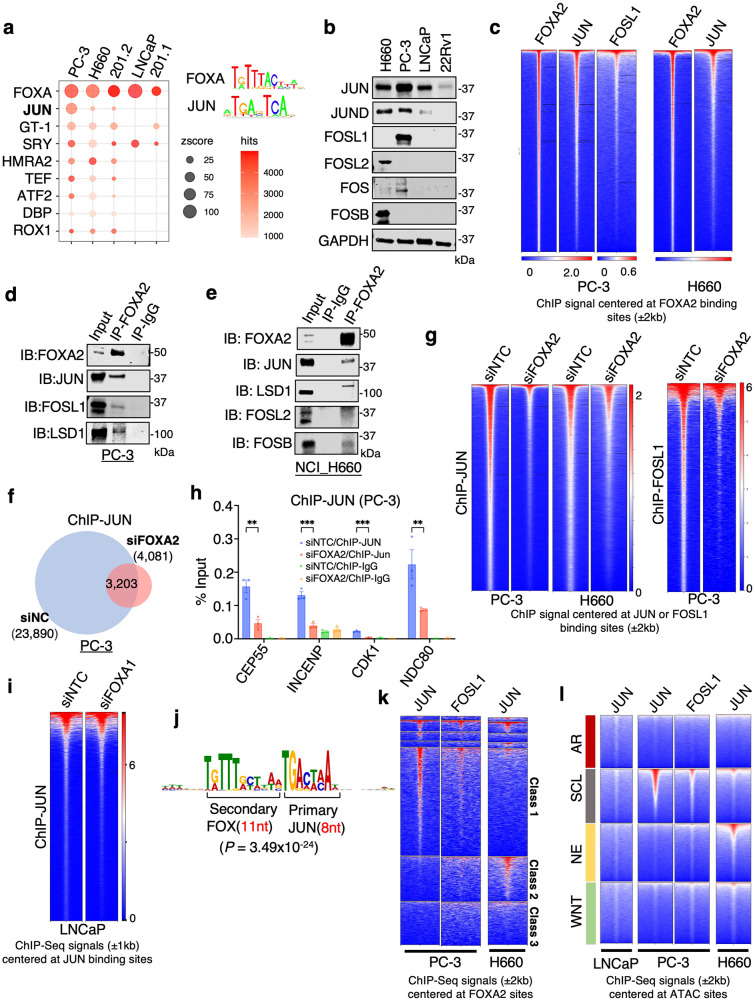
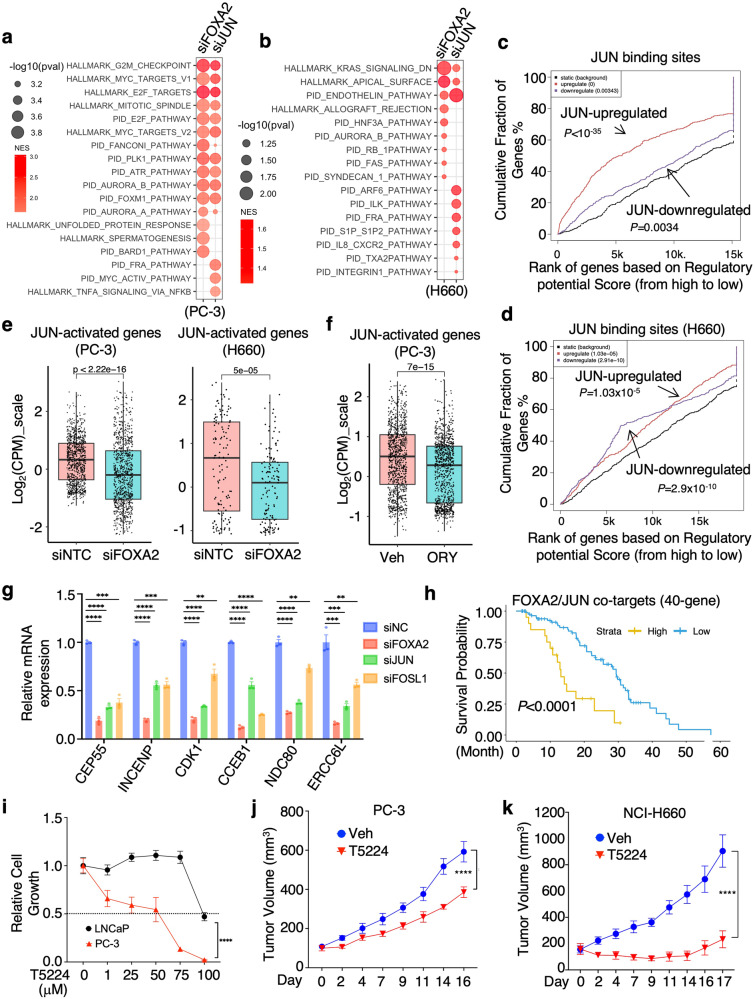
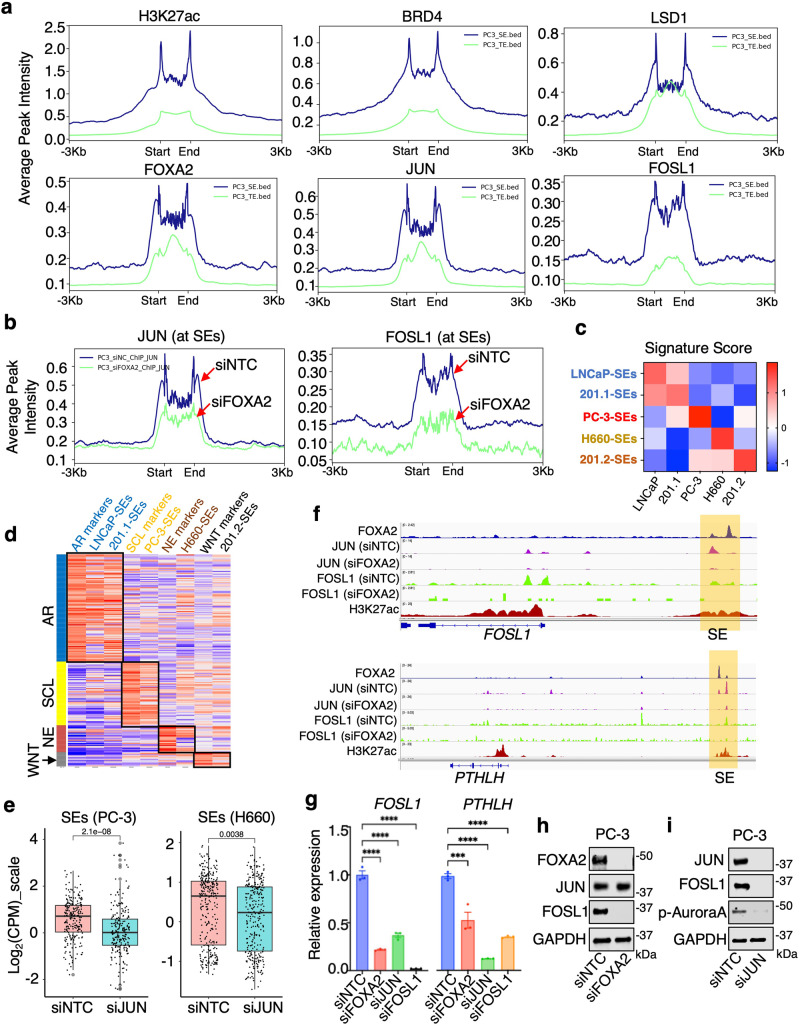
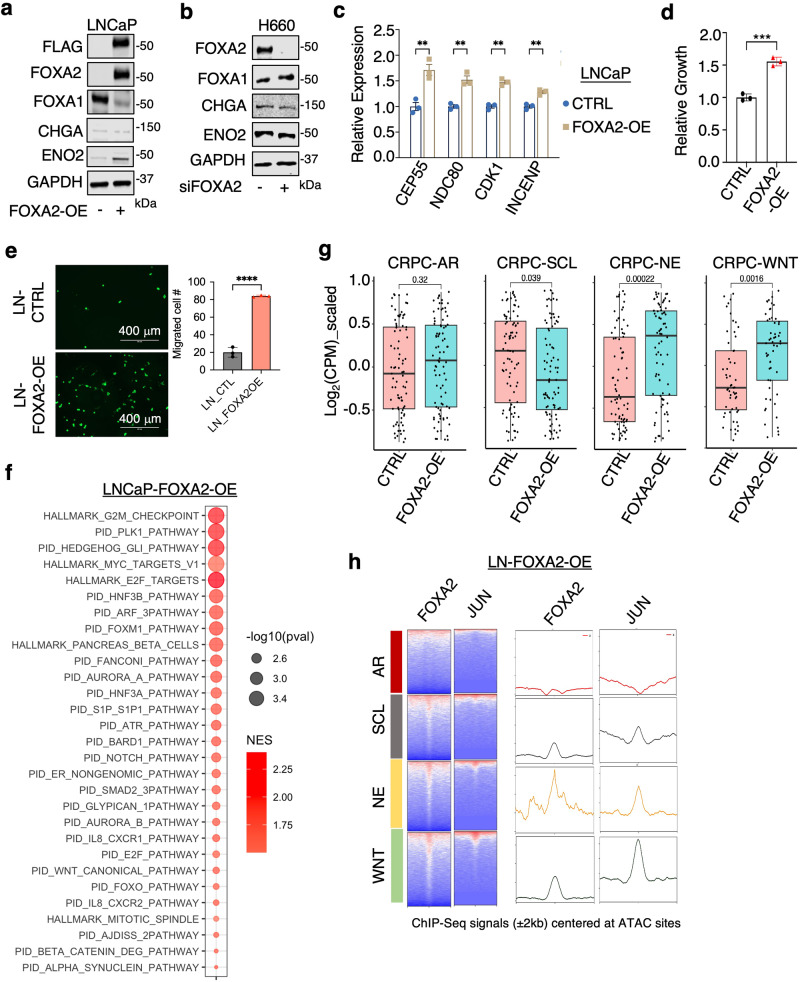
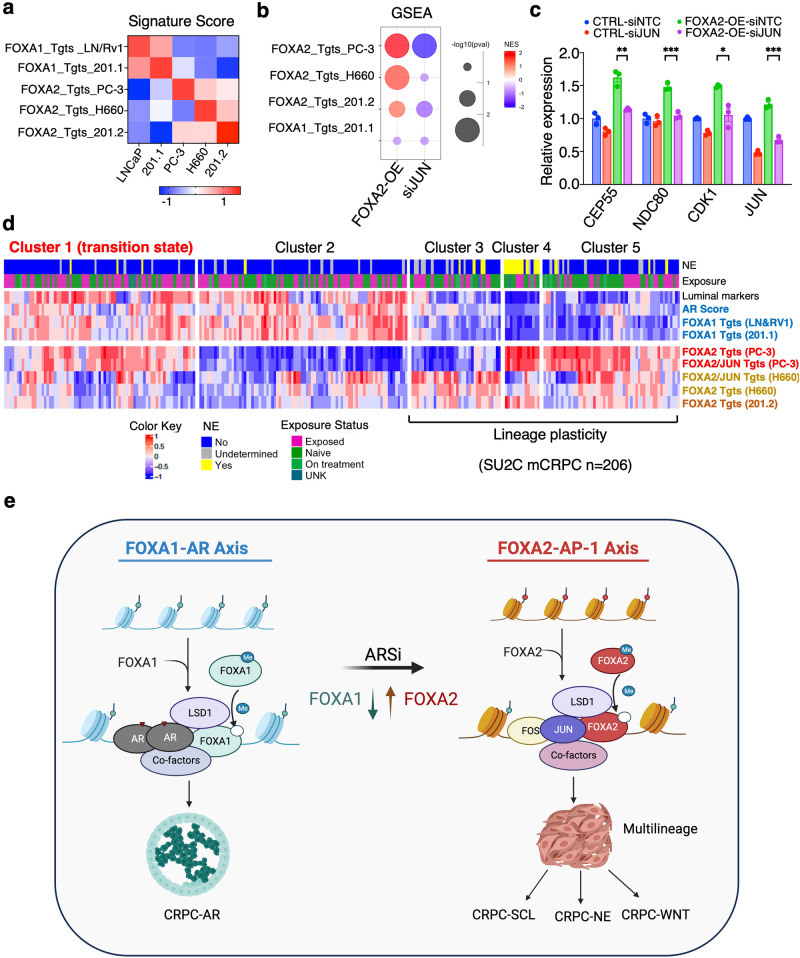
FOXA family proteins act as pioneer factors by remodeling compact chromatin structures. FOXA1 is crucial for the chromatin binding of the androgen receptor (AR) in both normal prostate epithelial cells and the luminal subtype of prostate cancer (PCa). Recent studies have highlighted the emergence of FOXA2 as an adaptive response to AR signaling inhibition treatments. However, the role of the FOXA1 to FOXA2 transition in regulating cancer lineage plasticity remains unclear. Our study demonstrates that FOXA2 binds to distinct classes of developmental enhancers in multiple AR-independent PCa subtypes, with its binding depending on LSD1. Moreover, we reveal that FOXA2 collaborates with JUN at chromatin and promotes transcriptional reprogramming of AP-1 in lineage-plastic cancer cells, thereby facilitating cell state transitions to multiple lineages. Overall, our findings underscore the pivotal role of FOXA2 as a pan-plasticity driver that rewires AP-1 to induce the differential transcriptional reprogramming necessary for cancer cell lineage plasticity.


Conflict of interest statement

G.P.R, R.A.T. and M.G.L. have research collaborations with AstraZeneca, Pfizer. The remaining authors declare no competing interests.

Figures

Fig. 1
Fig. 1. The switch from FOXA1 to FOXA2 promotes lineage reprogramming of CRPC.
a PDX-201.1A-Cx (201.1) and PDX-201.2A-Cx (201.2) were derived from distinct metastases from a single patient (201.1—dura; 201.2—lung). b Relative expression of FOXA1 and FOXA2 in these PDXs and LNCaP cells based on bulk RNA-seq data (201.1 n = 4 independent tumor samples; 201.2 n = 3 independent tumors; data represented as mean ± SEM; statistical significance determined by unpaired two-sided t-test). c GSEA for transcriptomes (RNA-seq) of PDX201.2 versus PDX201.1. d Heatmap view for the ChIP-FOXA1 or FOXA2 centered at the FOXA1 and FOXA2 binding sites in these two PDX models. The intensity of the colors represents the signal strength, with red indicating a higher signal and blue indicating a lower signal. e, f BETA integrating ChIP-FOXA1 peaks in 201.1 (e) or ChIP-FOXA2 peaks in 201.2 (f) with RNA-seq data of PDX201.2 versus PDX201.1. g Gene ontology (GO) annotation for potential direct targets of FOXA1 in PDX201.1 and FOXA2 in PDX201.2 (identified from BETA). ns (P > 0.05), *(0.01 < P < 0.05), **(0.001 < P < 0.01), ***(P < 0.001), and ****(P < 0.0001) were used to indicate the levels of P-value. Source data are provided as a Source Data file. a Created with BioRender.com released under a Creative Commons Attribution-NonCommercial-NoDerivs 4.0 International license https://creativecommons.org/licenses/by-nc-nd/4.0/deed.en.
Fig. 2
Fig. 2. FOXA2 binds to distinct classes of enhancers in three molecular subtypes of AR-independent CRPC.
a Immunoblotting for indicated proteins in PCa cell lines (n = 3 independent experiments). b Heatmap view for the ChIP-FOXA1 or FOXA2 centered at the FOXA1 and FOXA2 sites in LNCaP or PC-3 cells. c Heatmap view for the peaks of FOXA2, ATAC, or H3K27ac in PC-3, NCI-H660, or 201.2 models centered at the FOXA2 sites. d GO annotation was performed on genes associated with FOXA2 peaks that are unique to PC-3 (class 1), NCI-H660 (class 2), and 201.2 (class 3) models. e Boxplot of mRNA expression (z-score) of AR, FOXA1, and FOXA2 in previously defined CRPC subtypes—AR, SCL, NE, and WNT, using SU2C mCRPC cohort (CRPC-AR, n = 104; CRPC-SCL, n = 62; CRPC-NE, n = 26; CRPC-WNT, n = 14; center: median; box: 25th–75th IQR; whiskers: 1.5x IQR; outliers: individual data points; statistical significance determined by unpaired two-sided t-test). f Heatmap view for the ChIP-seq signal of indicated proteins centered at specific chromatin sites exhibiting different ATAC signatures for CRPC subtypes. ns (P > 0.05), *(0.01 < P < 0.05), **(0.001 < P < 0.01), ***(P < 0.001), and ****(P < 0.0001) were used to indicate the levels of P-value.
Fig. 3
Fig. 3. FOXA2 chromatin binding is promoted by LSD1.
a Heatmap view for FOXA2, ATAC (Assay for Transposase-Accessible Chromatin using sequencing), H3K4me2, H3K27ac, and LSD1 ChIP-seq signal intensity at FOXA2 binding sites in PC-3 cells. b Heatmap view for the ChIP-seq signal of LSD1, centered at specific chromatin sites exhibiting different ATAC signatures. c Heatmap view of FOXA2 ChIP-seq signal in PC-3 cells treated with vehicle or LSD1 inhibitors, ORY-1001 (10 μM) or C12 (0.5 μM), for 4 h. d Heatmap view for FOXA2 signal in NCI-H660 cells treated with vehicle or ORY-1001(10 μM for 4 h). e ChIP-qPCR for FOXA2 binding at indicated FOXA2 target sites (n = 3 independent samples; data represented as mean ± SEM; statistical significance determined by unpaired two-sided t-test). f Immunoblotting for LSD1 in PC-3 cells transfected with siRNAs against non-target control (NTC) or LSD1 (n = 3 independent experiments). g, h ChIP-qPCR for FOXA2 binding (g) and H3K4me2 levels (h) at indicated FOXA2 target sites (n = 3 independent samples; data represented as mean ± SEM; statistical significance determined by unpaired two-sided t-test). i, j Immunoblotting for methyl-lysine on immunopurified proteins from FLAG-tagged FOXA2 expressing PC-3 cells treated with vehicle or ORY-1001(10 μM) for 24 h (i) or transfected with siNC or siLSD1 (j) (n = 3 independent experiments). k In vitro demethylation assay using synthetic H3K4me2 peptide (1–21 aa) or K265-methylated FOXA2 peptide (258-276aa) as substrates incubated with recombinant LSD1 proteins. l PC-3 cell lines stably expressing control vector, 3xFLAG-tagged FOXA2-WT, or 3xFLAG-tagged K265R mutant (FOXA2WT or FOXA2K265R cells) were established. Immunoblotting for indicated proteins in these stable lines (n = 3 independent experiments). m, n ChIP-qPCR for FLAG or FOXA2 binding at the target sites was performed in these stable cell lines treated with vehicle or ORY-1001(10 μM) for 4 h (m) or transfected with/out siLSD1 (n), respectively (n = 3 independent samples; data represented as mean ± SEM; statistical significance determined by unpaired two-sided t-test). ns (P > 0.05), *(0.01 < P < 0.05), **(0.001 < P < 0.01), ***(P < 0.001), and ****(P < 0.0001) were used to indicate the levels of P-value. Source data are provided as a Source Data file.
Fig. 4
Fig. 4. FOXA2 transcription activity and tumor-promoting function are regulated by LSD1.
a Gene Set Enrichment Analysis (GSEA) was performed on differential expression results (obtained from RNA-seq) for siNTC versus siFOXA2, vehicle versus ORY-1001 (10 μM, 24 h), vehicle versus C12 (0.5 μM, 24 h), and siNTC versus siLSD1 in PC-3 cells using HALLMARK and PID datasets. Red dots indicate enriched pathways for downregulated genes by FOXA2 silencing or LSD1 inhibition/silencing. b, c Boxplot view for the expression of FOXA2 activated genes (n = 834 genes, log2(fold-change)>1 & P < 0.05, Log2(CPM_zscore)) in PC3 cells treated with/out LSD1 inhibiters (b) or transfected with/out siLSD1 (c) (center: median; box: 25th to 75th IQR; whiskers: 1.5x IQR; outliers: individual data points; statistical significance determined by unpaired two-sided t-test). d, e qRT-PCR analyses for indicated direct FOXA2 targets in PC-3 cells treated with either vehicle or ORY-1001 (10 µM, 24 h) (d) or transfected with/out siLSD1 (e) (n = 3 independent samples; data represented as mean ± SEM; statistical significance determined by unpaired two-sided t-test). f Immunoblotting for indicated proteins in PC-3 cells transfected with siFOXA2 versus siNTC (n = 3 independent experiments). gi Cell cycle analysis (g), transwell migration assay (h), or Boyden chamber invasion assay (i) in PC-3 cells transfected with siFOXA2 versus siNTC (n = 3 independent samples; data represented as mean ± SEM; statistical significance determined by unpaired two-sided t-test). j Immunoblotting for indicated protein expression in PC-3 cells treated with different doses of ORY-1001 for 24 h (n = 3 independent experiments). k, l Colony formation assay (k) and transwell migration assay (l) for FOXA2-overexpressing PC-3 cells treated with either vehicle or ORY-1001 (10 µM, 10 d for colony formation assay, 2d for migration assay). m, n PC-3 stable cells (shNTC versus shFOXA2) (m) or parental cells (n) were subcutaneously injected into male mice. Mice bearing parental tumors were then treated with the LSD1 inhibitor ORY-1001 (0.03 mg/kg, daily intraperitoneal injection) (n). Tumor growth was measured at indicated time points (FOXA2 silencing experiment, n = 8 independent tumors; ORY-1001 treatment experiment, n = 9 independent tumors; data represented as mean ± SEM; statistical significance determined by two-way ANOVA). o, p GFP-labeled PC-3 stable cells (shNTC versus shFOXA2) (o) or parental PC-3 cells treated with ORY-1001 (10 µM, 24 h) (p) were injected into zebrafish embryos. Tumor cell invasion was immediately examined within 1 h and images were taken under 50x magnification. Embryos exhibiting positive circulation signals were classified as “invaded”. The number represents the proportion of “invaded” embryos relative to the total number of injected embryos. ns (P > 0.05), *(0.01 < P < 0.05), **(0.001 < P < 0.01), ***(P < 0.001), and ****(P < 0.0001) were used to indicate the levels of P-value. Source data are provided as a Source Data file.
Fig. 5
Fig. 5. FOXA2 functions as a major pioneer factor of JUN.
a Enriched motifs identified by the SeqPos motif tool for FOXA2 binding sites in PCa models. b Immunoblotting for indicated protein in different PCa cell lines (n = 3 independent experiments). c Heatmap view for FOXA2, JUN, or FOSL1 ChIP-seq signal intensity centered at FOXA2 binding sites in PC3 or NCI-H660 cells. d, e Immunoblotting for indicated proteins that were coimmunoprecipitated with FOXA2 in PC3 (d) or NCI-H660 cells (e) (n = 3 independent experiments). f Venn diagram for ChIP-JUN peaks in PC-3 cells transfected with siFOXA2 versus siNTC. g Heatmap view for JUN or FOSL1 ChIP-seq signal intensity at JUN or FOSL1 binding sites in PC-3 or NCI-H660 cells transfect with siFOXA2 versus siNTC. h ChIP-qPCR for JUN binding at the indicated FOXA2/JUN co-target sites (n = 3 independent samples; data represented as mean ± SEM; statistical significance determined by unpaired two-sided t-test). i heatmap view for JUN ChIP-seq signal intensity at JUN binding sites in LNCaP cells transfected with siFOXA1 versus siNTC. j Spaced motif analysis using SpaMo was conducted to analyze the composition motif enrichment at the overlapping sites of FOXA2 and JUN in PC-3 cells. k, l Heatmap view for JUN or FOSL1 binding peak intensity centered at previously defined subclasses of FOXA2 binding sites (defined in Fig. 2c) (k), or at previously defined chromatin sites with different ATAC signatures (l) in LNCaP, PC3, or NCI-H660 cells. ns (P > 0.05), *(0.01 < P < 0.05), **(0.001 < P < 0.01), ***(P < 0.001), and ****(P < 0.0001) were used to indicate the levels of P-value. Source data are provided as a Source Data file.
Fig. 6
Fig. 6. JUN promotes tumor growth of FOXA2-driven PCa models.
a, b GSEA for differentially regulated genes in PC-3 (a) or NCI-H660 (b) transfected with siNTC versus siFOXA2 or siJUN (RNA-seq data). The red color indicates enriched pathways for downregulated genes by FOXA2 or JUN silencing. c, d BETA for the association of JUN binding sites with JUN-regulated genes in PC-3 (c) or NCI-H660 (d) cells. e, f Boxplot view for the expression (Log2(CPM_zscore)) of JUN-activated genes (n = 1036 genes for PC-3, n = 132 genes for NCI-H660) in PC-3 or NCI-H660 cells transfected with siNTC versus siFOX2 (e), or treated with/out ORY-1001 (10 μM for 24 h) (f) (center: median; box: 25th to 75th IQR; whiskers: 1.5x IQR; outliers: individual data points; statistical significance determined by unpaired two-sided t-test). g qRT-PCR for the expression levels of indicated FOXA2-JUN cotargets in PC-3 cells treated with siFOXA2, siJUN, siFOSL1, or siNTC (n = 3 independent samples; data represented as mean ± SEM, statistical significance determined by unpaired two-sided t-test). h Kaplan–Meier curve for the overall survival from the start of a first-line ARSi in CRPC tumors (SU2C dataset, n = 106) with higher FOXA2-JUN co-target signature (red, the top 25%) versus lower (blue, the bottom 75%). i Cell viability assay for LNCaP and PC-3 cells treated with 0–100 μM T5224, an AP-1 inhibitor, for 3d (LNCaP, n = 5 independent samples; PC-3, n = 4 independent samples; data represented as mean ± SEM; statistical significance determined by two-way ANOVA). j, k PC-3 (j) or NCI-H660 (k) cells were subcutaneously injected into male mice. Mice bearing parental tumors were then treated with T5224 (6 mg/kg, 5 days per week via gavage). Tumor growth was measured at indicated time points (PC-3, n = 12 independent tumors; NCI-H660, n = 8 independent tumors; data represented as mean ± SEM; statistical significance determined by two-way ANOVA). ns (P > 0.05), *(0.01 < P < 0.05), **(0.001 < P < 0.01), ***(P < 0.001), and ****(P < 0.0001) were used to indicate the levels of P-value. Source data are provided as a Source Data file.
Fig. 7
Fig. 7. JUN regulates lineage-specific super-enhancers.
a The average binding intensity of indicated proteins at super-enhancers (SEs) versus typical enhancers (TEs) in PC-3 cells. b JUN and FOSL1 binding intensity at SEs sites in PC-3 cells transfected with siFOXA2 versus siNTC. c, d Heatmap view for GSVA (gene set variation analysis) scores of genes associated with top 50 SEs identified from each model in PCa cells (c) or in SU2C mCRPC cohorts (d). e Boxplot view for the expression (Log2(CPM_zscore)) of model-specific SE-associated genes in PC-3 (n = 305 genes) or NCI-H660 (n = 412 genes) cells transfected with siJUN versus siNTC (center: median; box: 25th to 75th IQR; whiskers: 1.5x IQR; outliers: individual data points; statistical significance determined by unpaired two-sided t-test). f Genome browser view for indicated ChIP-seq peaks (from the PC-3 model) at FOSL1 and PTHLH gene locus. g qRT-PCR for the expression of FOSL1 and PTHLH in PC-3 cells transfected with siFOXA2, siJUN, siFOSL1, or siNTC (n = 3 independent samples; data represented as mean ± SEM; statistical significance determined by unpaired two-sided t-test). h, i Immunoblotting for indicated proteins in PC-3 cells transfected with siNTC versus siFOXA2 (h) or siJUN (i) (n = 3 independent experiments). ns (P > 0.05), *(0.01 < P < 0.05), **(0.001 < P < 0.01), ***(P < 0.001), and ****(P < 0.0001) were used to indicate the levels of P-value. Source data are provided as a Source Data file.
Fig. 8
Fig. 8. FOXA2 expression in AR-dependent PCa cells initiates a multilineage progression.
a, b Immunoblotting for indicated proteins in LNCaP cells stably expressing empty vector or FOXA2 (LN-FOXA2-OE) (a) or in NCI-H660 cells transfected with siFOXA2 versus siNTC (b) (n = 3 independent experiments). c qRT-PCR for indicated FOXA2 targets in the control LNCaP versus LN-FOXA2-OE cells (n = 3 independent samples, data are represented as mean ± SEM, statistical significance determined by unpaired two-sided t-test). d, e Cell proliferation assay (d) or transwell migration assay for the control LNCaP versus LN-FOXA2-OE celIs (e) (n = 3 independent samples, data are represented as mean ± SEM, statistical significance determined by unpaired two-sided t-test). f GSEA for the pathways (HALLMARK and PID datasets) enriched in the upregulated genes by FOXA2 overexpression. g Box plots for subtype-specific transcriptional signatures (n = 93 genes for every subtype) in the control LNCaP versus LN-FOXA2-OE ceIls (center: median; box: 25th–75th IQR; whiskers: 1.5x IQR; outliers: individual data points; statistical significance determined by unpaired two-sided t-test). h Heatmap view (left panel) and reads density plot (right panel) for FOXA2 or JUN binding peak intensity centered at previously defined chromatin sites with different ATAC signatures in LN-FOXA2-OE cells. ns (P > 0.05), *(0.01 < P < 0.05), **(0.001 < P < 0.01), ***(P < 0.001), and ****(P < 0.0001) were used to indicate the levels of P-value. Source data are provided as a Source Data file.
Fig. 9
Fig. 9. FOXA2 transcription programs are activated in a subset of AR-dependent CRPC tumors.
a Heatmap view for GSVA scores of model-specific FOXA2 targets in different PCa cell lines. b GSEA for the enrichment status of indicated FOXA2-target gene sets in LN-FOXA2-OE versus control cells or in LN-FOXA2-OE cells transfected with/out siJUN. Left column: the red color indicates enriched pathways for upregulated genes by FOXA2-OE; Right column: the blue color indicates enriched pathways for genes downregulated by JUN silencing. c qRT-PCR for the mRNA expression of indicated FOXA2 targets in the control LNCaP cells and LN-FOXA2-OE cells transfected with/out siJUN (n = 3 independent samples; data represented as mean ± SEM; statistical significance determined by unpaired two-sided t-test). d Heatmap view for GSVA scores of model-specific FOXA2 targets or FOXA2/JUN co-targets in SU2C mCRPC samples (n = 206 samples). e Graphic model for the functional switch from FOXA1 to FOXA2 in reprogramming JUN and driving lineage plasticity. ns (P > 0.05), *(0.01 < P < 0.05), **(0.001 < P < 0.01), ***(P < 0.001), and ****(P < 0.0001) were used to indicate the levels of P-value. Source data are provided as a Source Data file. e Created with BioRender.com released under a Creative Commons Attribution-NonCommercial-NoDerivs 4.0 International license https://creativecommons.org/licenses/by-nc-nd/4.0/deed.en.

References

    1. Yuan X, et al. Androgen receptor functions in castration-resistant prostate cancer and mechanisms of resistance to new agents targeting the androgen axis. Oncogene. 2014;33:2815–2825. doi: 10.1038/onc.2013.235. - DOI - PMC - PubMed
    1. de Bono JS, et al. Abiraterone and increased survival in metastatic prostate cancer. N. Engl. J. Med. 2011;364:1995–2005. doi: 10.1056/NEJMoa1014618. - DOI - PMC - PubMed
    1. Scher HI, et al. Increased survival with enzalutamide in prostate cancer after chemotherapy. N. Engl. J. Med. 2012;367:1187–1197. doi: 10.1056/NEJMoa1207506. - DOI - PubMed
    1. Chi KN, et al. Apalutamide for metastatic, castration sensitive prostate cancer. N. Engl. J. Med. 2019;381:13–24. doi: 10.1056/NEJMoa1903307. - DOI - PubMed
    1. Smith MR, et al. Darolutamide and survival in metastatic, hormone-sensitive prostate cancer. N. Engl. J. Med. 2022;386:1132–1142. doi: 10.1056/NEJMoa2119115. - DOI - PMC - PubMed

MeSH terms