. 2024 Jun 8;7(1):130.
doi: 10.1038/s42004-024-01214-2.

Ratiometric nonfluorescent CRISPR assay utilizing Cas12a-induced plasmid supercoil relaxation

Affiliations

Ratiometric nonfluorescent CRISPR assay utilizing Cas12a-induced plasmid supercoil relaxation

Noor Mohammad et al. Commun Chem. .

Abstract

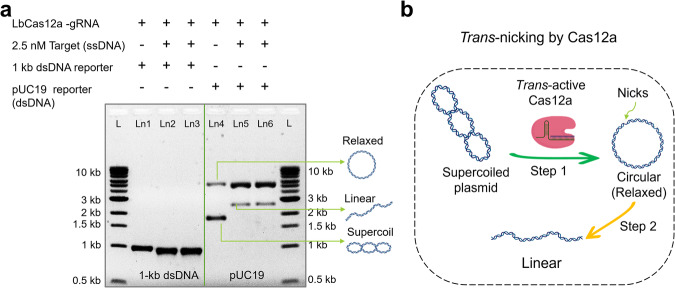
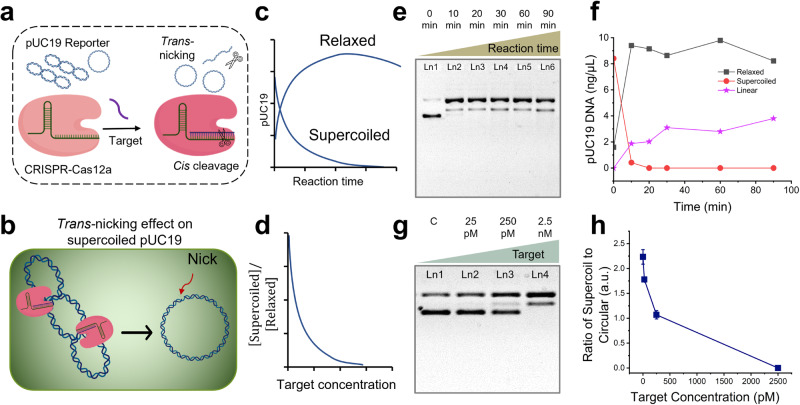
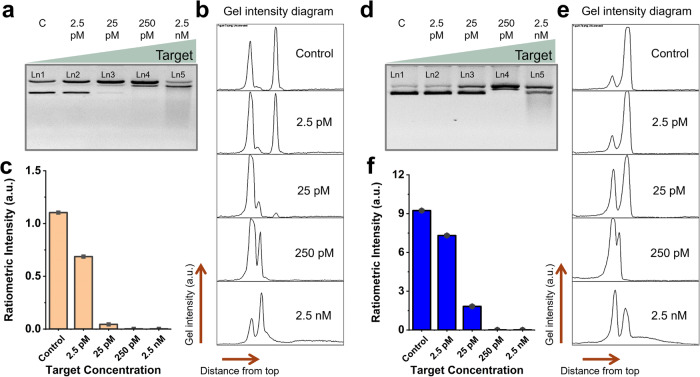
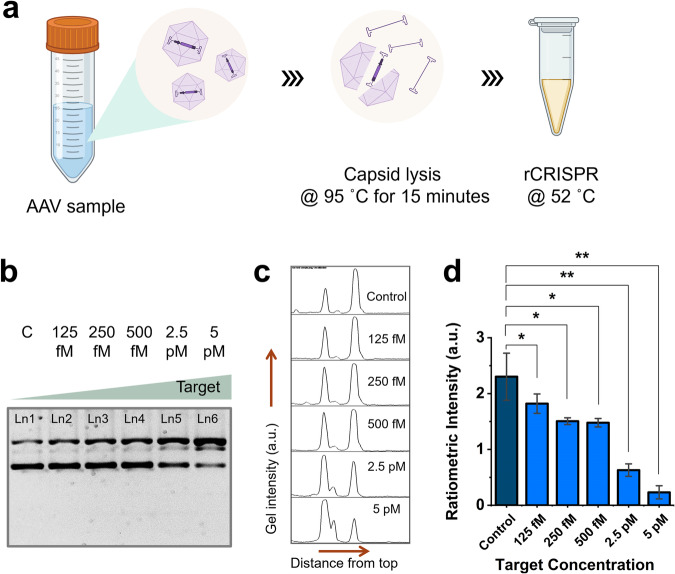
Most CRISPR-based biosensors rely on labeled reporter molecules and expensive equipment for signal readout. A recent approach quantifies analyte concentration by sizing λ DNA reporters via gel electrophoresis, providing a simple solution for label-free detection. Here, we report an alternative strategy for label-free CRISPR-Cas12a, which relies on Cas12a trans-nicking induced supercoil relaxation of dsDNA plasmid reporters to generate a robust and ratiometric readout. The ratiometric CRISPR (rCRISPR) measures the relative percentage of supercoiled plasmid DNA to the relaxed circular DNA by gel electrophoresis for more accurate target concentration quantification. This simple method is two orders of magnitude more sensitive than the typical fluorescent reporter. This self-referenced strategy solves the potential application limitations of previously demonstrated DNA sizing-based CRISPR-Dx without compromising the sensitivity. Finally, we demonstrated the applicability of rCRISPR for detecting various model DNA targets such as HPV 16 and real AAV samples, highlighting its feasibility for point-of-care CRISPR-Dx applications.


Conflict of interest statement

The authors declare no competing interests.

Figures

Fig. 1
Fig. 1. dsDNA plasmid as the CRISPR-Cas12a reporter.
a Gel electrophoresis (1% agarose gel and 1× TBE buffer) results demonstrating the different CRISPR-Cas12a assay results of using 1-kb linear dsDNA and 2.7 kb supercoiled pUC19 dsDNA plasmid as nonspecific substrates. b Cartoon illustration showing the conformation change of pUC19 induced by trans-active Cas12a. The supercoiled-circular transition step is utilized for developing a ratiometric CRISPR (rCRISPR) assay later. Abbreviations: gRNA guide RNA, nM nanomolar, ssDNA single-stranded DNA, kb kilobase pair, L 1-kb ladder, Ln lane, TBE Tris-borate EDTA, dsDNA double-stranded DNA.
Fig. 2
Fig. 2. Ratiometric CRISPR-Cas12a assay using plasmid reporters.
a Schematic of the CRISPR-Cas12a assay using pUC19 as a nonspecific substrate. b Close-up cartoon view showing activated Cas12a nicks the supercoil pUC19 and converts it into relaxed conformation. c Hypothetical graphical illustration showing how the percentage of supercoil and relaxed DNA would change as the CRISPR reaction proceeds. d Hypothetical graphical illustration showing how the ratio of supercoil DNA to relaxed circular DNA could change with the target concentrations. Gel electrophoresis (1% agarose gel and 1× TBE buffer) results (e) and scatter plot (f) demonstrating the nonspecific nicking of pUC19 by Cas12a over the reaction time course in the presence of 2.5 nM ssDNA target. DNA concentration (ng per μL) was estimated by comparing the band intensities and converted from the initial plasmid DNA concentration. Gel electrophoresis (1% agarose gel and 1× TBE buffer) results (g) and scatter plot (h) demonstrating the effect of target concentration on trans-nicking of pUC19 by Cas12a for a 30-min reaction. Abbreviations: c negative control, pM picomolar, nM nanomolar, TBE Tris-borate EDTA, a.u. arbitrary unit.
Fig. 3
Fig. 3. Ratiometric signal from various dsDNA plasmids.
a Gel electrophoresis (1% agarose gel and 1× TBE buffer) results demonstrating CRISPR-Cas12a assay using dsDNA pBR322 and ΦX174 plasmids as nonspecific substrates. Bar charts demonstrating the ratiometric CRISPR signal (ratio of supercoil to circular DNA) for (b) pBR322, and (c) ΦX174 plasmid DNA. Intensity plots of this gel in (a) have been shown in Supplementary Fig. 3. Abbreviations: nM nanomolar, kb kilobase pair, Ln lane, TBE Tris-borate EDTA, dsDNA double-stranded DNA, a.u. arbitrary unit.
Fig. 4
Fig. 4. Effect of reporter pretreatment and reaction temperature.
Gel electrophoresis (1% agarose gel and 1× TBE buffer) results and bar charts demonstrating the effect of no pretreatment (a), acid pretreatment (b), basic pretreatment (c), and snap-cooling (d) on trans-nicking of pUC19. Gel electrophoresis (1% agarose gel and 1× TBE buffer) results (top) and bar charts (bottom) demonstrating the effect of reaction temperature on trans-nicking of pUC19 (eh). Intensity plots of each gel have been shown in Supplementary Fig. 4. Abbreviations: c negative control, pM picomolar, nM nanomolar, R.T. room temperature, TBE Tris-borate EDTA, a.u. arbitrary unit, S/C supercoil/relaxed circular.
Fig. 5
Fig. 5. Effect of Cas12a concentration, buffer type, and salt concentration.
Gel electrophoresis (1% agarose gel and 1× TBE buffer) results and bar charts demonstrating the effect of 20 nM Cas12a (a), 40 nM Cas12a (b), and 60 nM Cas12a (c) concentration; effect of rCutSmart reaction buffer (d), and NEB2.1 reaction buffer (e); effect of 50 mM NaCl (f), 100 mM NaCl (g), and 150 mM NaCl (h) on trans-nicking efficiency of Cas12a towards pUC19. Intensity plots of each gel have been shown in Supplementary Fig. 5. [Cas12a] = 40 nM for dh. rCutSmart buffer recipe: 50 mM Potassium Acetate, 20 mM Tris-acetate, 10 mM Magnesium Acetate, 100 µg per ml Recombinant Albumin, pH 7.9@25 °C. NEBuffer 2.1 buffer recipe: 50 mM NaCl, 10 mM Tris-HCl, 10 mM MgCl2, 1 mM DTT, 100 µg per ml BSA, pH 7.9@25 °C. Abbreviations: c negative control, pM picomolar, nM nanomolar, mM millimolar, TBE Tris-borate EDTA, a.u. arbitrary unit, BSA bovine serum albumin.
Fig. 6
Fig. 6. Limit of detection (LOD) determination.
Gel electrophoresis (1% agarose gel and 1× TBE buffer) demonstrating the CRISPR-Cas12a induced DNA relaxation for various target concentrations using pUC19 (a), pBR322 (d), and ΦX174 (g) reporters, respectively. Gel intensity diagrams of gel lanes for pUC19 (b), pBR322 (e), and ΦX174 (h) reporters. Ratiometric intensity plotted in bar chart against different target concentrations for pUC19 (c), pBR322 (f), and ΦX174 (i) reporters. These assays were performed at 52 °C for 1 h. Error bar represents the standard deviation of n = 3 repeated experiments for each measurement. The graph shows statistical insignificance at p > 0.05 (ns), significance at p < 0.05 (*), p < 0.01 (**), and p < 0.001(***). Abbreviations: c negative control, fM femtomolar, pM picomolar, nM nanomolar, Ln lane, TBE Tris-borate EDTA, a.u. arbitrary unit.
Fig. 7
Fig. 7. Validation of CRISPR-Cas12a based DNA supercoil relaxation using various targets.
Gel electrophoresis (1% agarose gel and 1× TBE buffer) demonstrates the nonspecific supercoil relaxation of ΦX174 DNA; a Marker of AAV genome was used as target. d Marker of HPV 16 was used as target. In each panel in a and d, Ln1: negative control (no target); Ln2, Ln3, Ln4, and Ln5: experimental lanes with target concentrations of 2.5 pM, 25 pM, 250 pM, and 2.5 nM, respectively. These assays were performed at 52 °C for 1 h. Gel intensity diagrams of each lane for AAV (b), and HPV 16 (e) synthetic targets. Ratiometric intensity plotted in bar chart against different concentrations of AAV (c), and HPV16 (f) synthetic targets. Abbreviations: c negative control, pM picomolar, nM nanomolar, Ln lane, TBE Tris-borate EDTA, a.u. arbitrary unit.
Fig. 8
Fig. 8. Performance of rCRISPR for detecting real AAV samples.
a Schematic showing the procedures followed for detecting affinity-purified AAV2 samples. b Gel electrophoresis (1% agarose gel and 1× TBE buffer) results demonstrating the supercoil relaxation of ΦX174 DNA reporter after 1 h of rCRISPR assay using lysed AAV sample. c Gel intensity diagrams of each lane in b. d Quantitative performance of rCRISPR with lysed AAV sample. Error bar represents the standard deviation of n = 3 repeated experiments for each measurement. The graph shows statistical significance at p < 0.05 (*), and p < 0.01 (**). Abbreviations: c negative control, fM femtomolar, pM picomolar, Ln lane, TBE Tris-borate EDTA, a.u. arbitrary unit.

Similar articles

Cited by

References

    1. Smyrlaki I, et al. Massive and rapid COVID-19 testing is feasible by extraction-free SARS-CoV-2 RT-PCR. Nat. commun. 2020;11:4812–4812. doi: 10.1038/s41467-020-18611-5. - DOI - PMC - PubMed
    1. Huang HS, et al. Multiplex PCR system for the rapid diagnosis of respiratory virus infection: systematic review and meta-analysis. Clin. Microbiol. Infect. 2018;24:1055–1063. doi: 10.1016/j.cmi.2017.11.018. - DOI - PMC - PubMed
    1. Wu IC, Liu W-C, Chang T-T. Applications of next-generation sequencing analysis for the detection of hepatocellular carcinoma-associated hepatitis B virus mutations. J. Biomed. Sci. 2018;25:51–51. doi: 10.1186/s12929-018-0442-4. - DOI - PMC - PubMed
    1. Niemz A, Ferguson TM, Boyle DS. Point-of-care nucleic acid testing for infectious diseases. Trends Biotechnol. 2011;29:240–250. doi: 10.1016/j.tibtech.2011.01.007. - DOI - PMC - PubMed
    1. Ouyang T, Liu Z, Han Z, Ge Q. MicroRNA detection specificity: recent advances and future perspective. Anal. Chem. 2019;91:3179–3186. doi: 10.1021/acs.analchem.8b05909. - DOI - PubMed