. 2024 Jun 8;7(1):709.
doi: 10.1038/s42003-024-06390-4.

Immune profiling of age and adjuvant-specific activation of human blood mononuclear cells in vitro

Affiliations

Immune profiling of age and adjuvant-specific activation of human blood mononuclear cells in vitro

Simone S Schüller et al. Commun Biol. .

Abstract

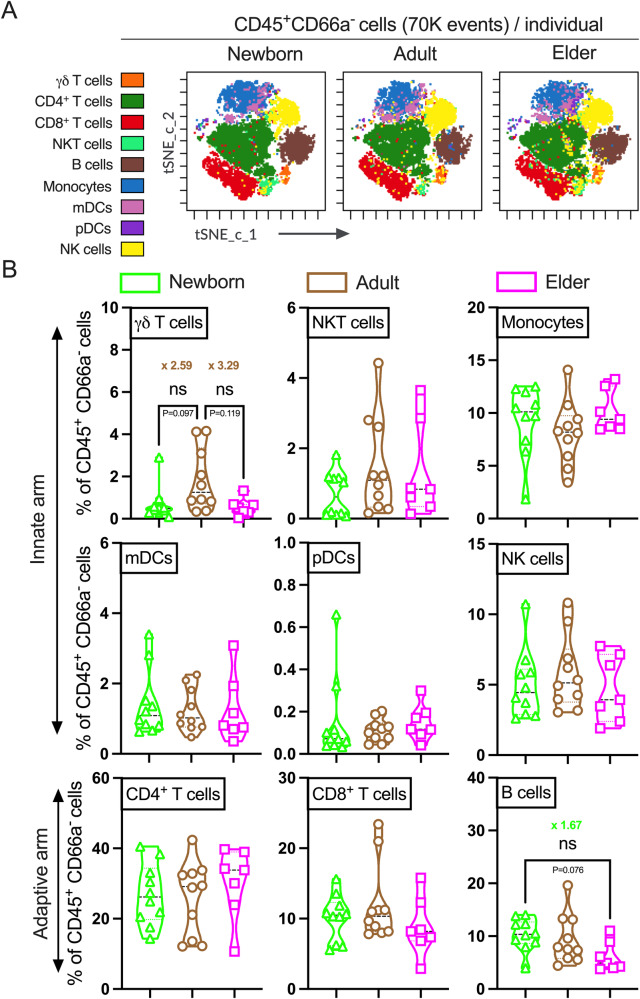
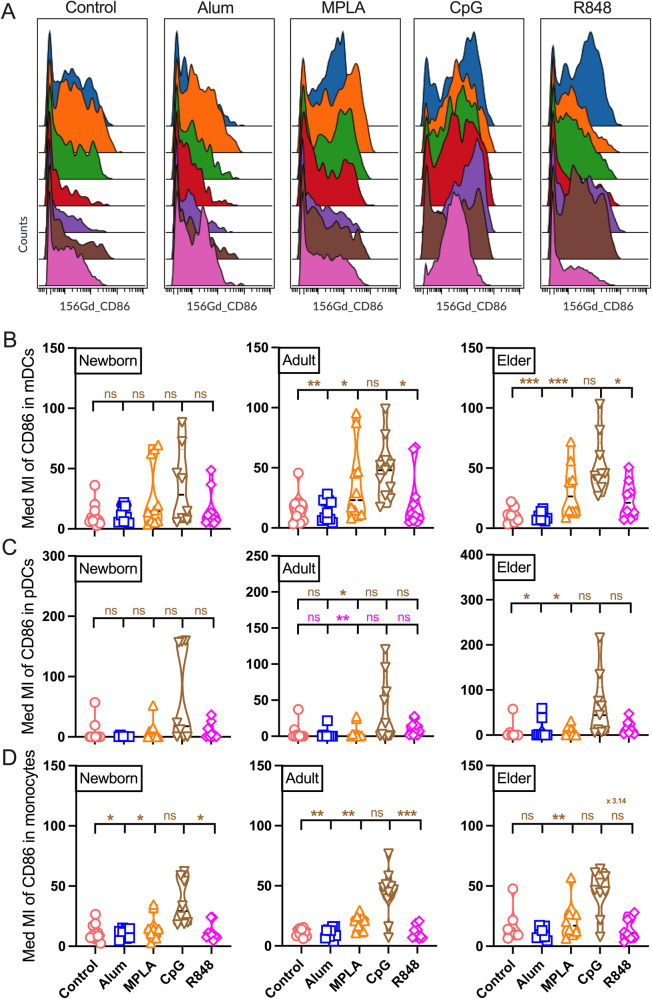
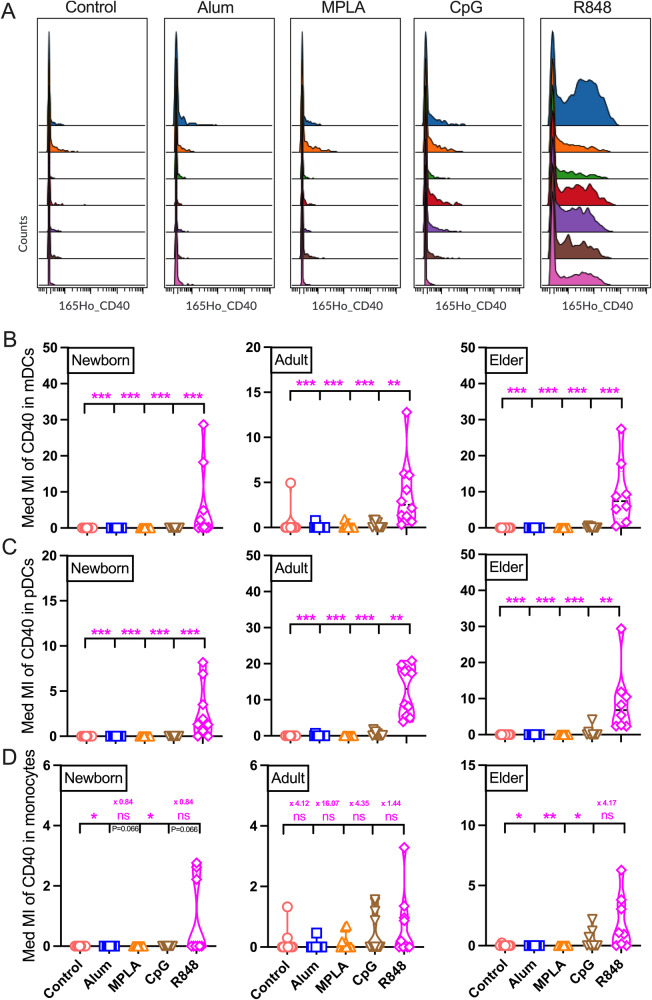
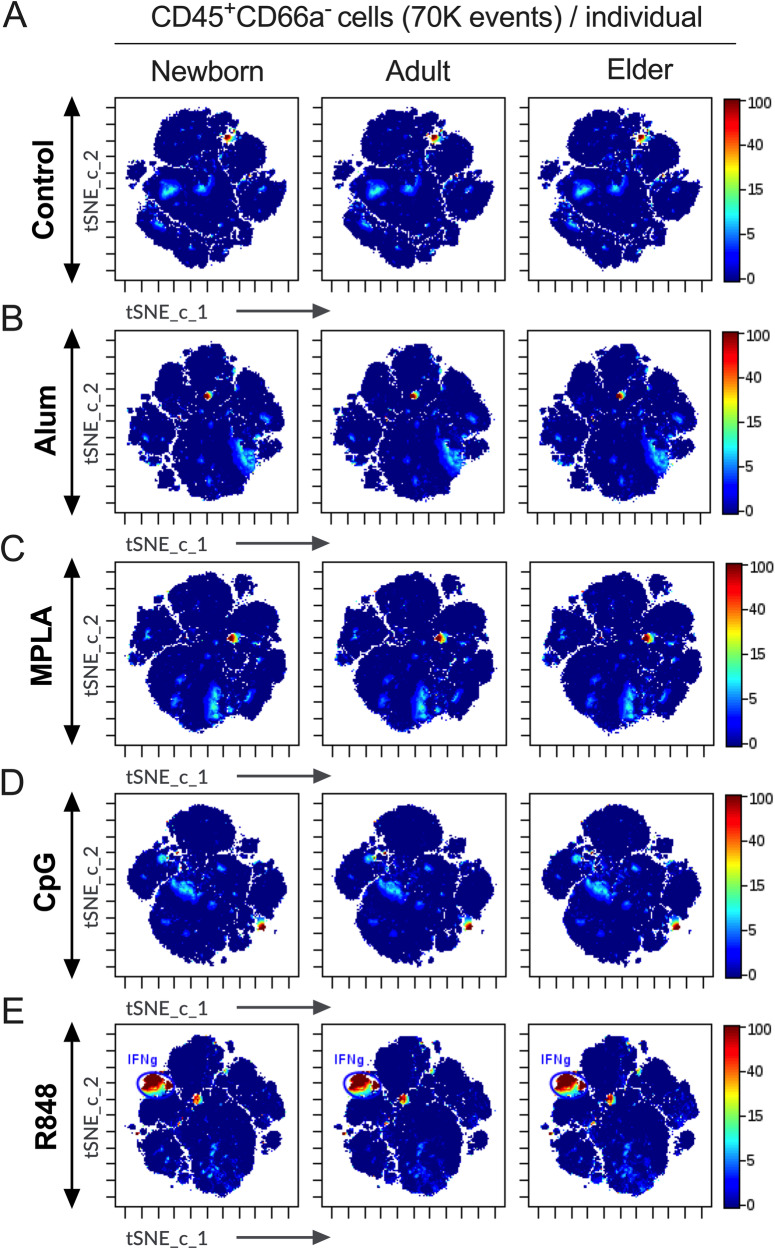
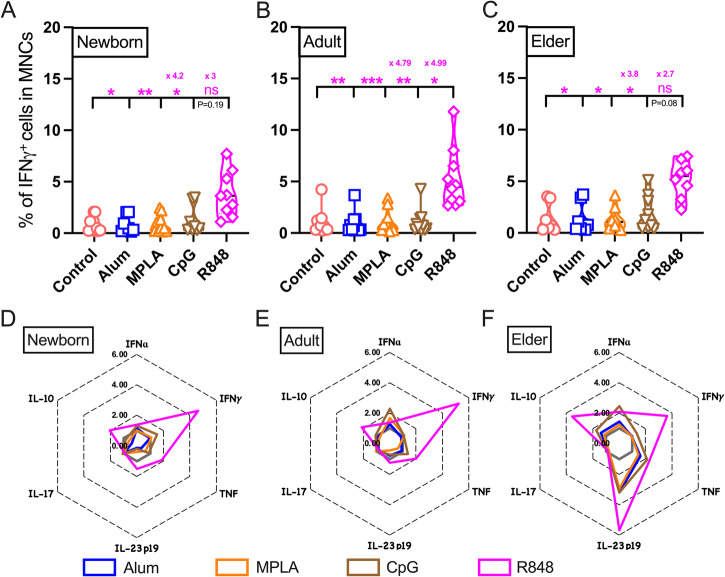
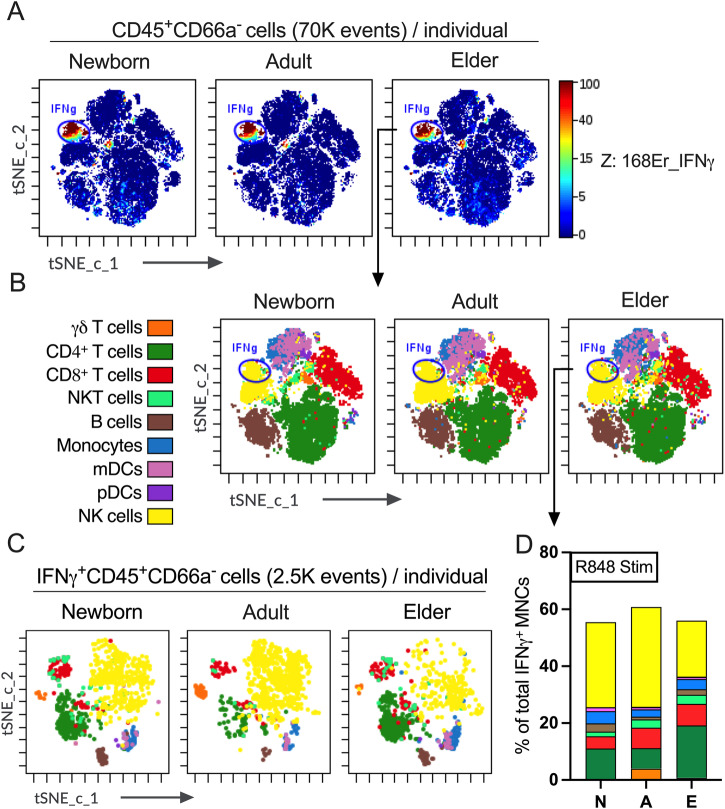
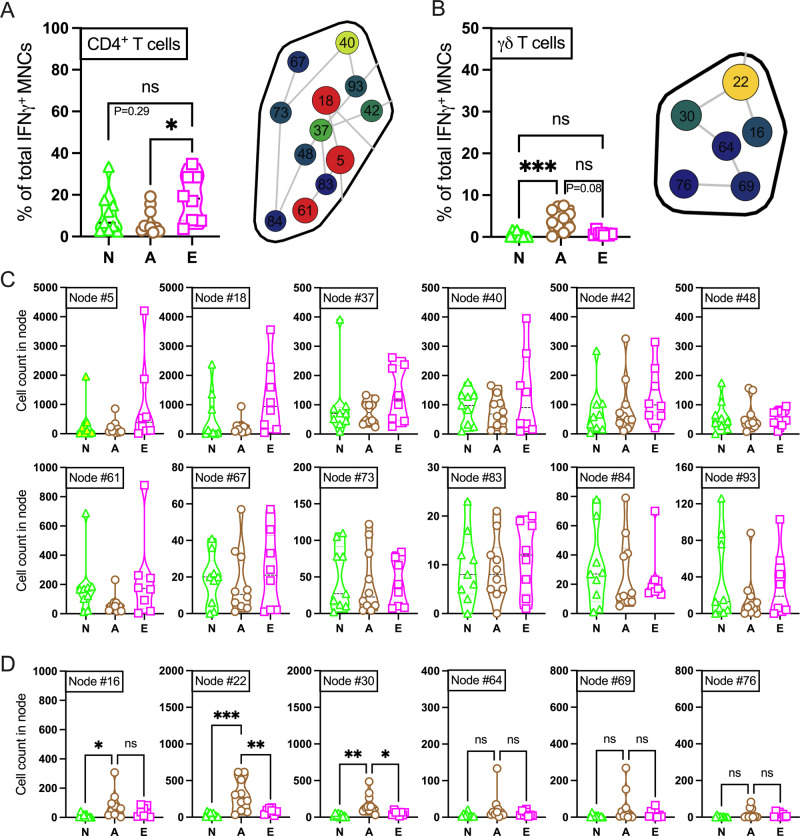
Vaccination reduces morbidity and mortality due to infections, but efficacy may be limited due to distinct immunogenicity at the extremes of age. This raises the possibility of employing adjuvants to enhance immunogenicity and protection. Early IFNγ production is a hallmark of effective vaccine immunogenicity in adults serving as a biomarker that may predict effective adjuvanticity. We utilized mass cytometry (CyTOF) to dissect the source of adjuvant-induced cytokine production in human blood mononuclear cells (BMCs) from newborns (~39-week-gestation), adults (~18-63 years old) and elders (>65 years of age) after stimulation with pattern recognition receptors agonist (PRRa) adjuvants. Dimensionality reduction analysis of CyTOF data mapped the BMC compartment, elucidated age-specific immune responses and profiled PRR-mediated activation of monocytes and DCs upon adjuvant stimulation. Furthermore, we demonstrated PRRa adjuvants mediated innate IFNγ induction and mapped NK cells as the key source of TLR7/8 agonist (TLR7/8a) specific innate IFNγ responses. Hierarchical clustering analysis revealed age and TLR7/8a-specific accumulation of innate IFNγ producing γδ T cells. Our study demonstrates the application of mass cytometry and cutting-edge computational approaches to characterize immune responses across immunologically distinct age groups and may inform identification of the bespoke adjuvantation systems tailored to enhance immunity in distinct vulnerable populations.


Conflict of interest statement

The authors declare the following competing financial interest(s): D.S., O.L. and D.J.D. are named inventors on patents relating to small molecule adjuvants assigned to Boston Children’s Hospital. O.L.’s laboratory has received sponsored research support from GlaxoSmithKline (GSK) and O.L. has served as a consultant to GSK and Hillevax. D.J.D. is on the scientific advisory board of EdJen BioTech and serves as a consultant with Merck Research Laboratories/Merck Sharp & Dohme Corp. (a subsidiary of Merck & Co., Inc.). O.L. and D.J.D. are cofounders of Ovax Inc. These commercial or financial relationships are unrelated to the current study. R.M.G. is an Application Fields Scientist for the Cytobank platform at Beckman Coulter Life Sciences. The rest of the authors declare no competing interests.

Figures

Fig. 1
Fig. 1. Profiling of the MNCs (CD45+ CD66a- cells) from newborns, adults and elders in unstimulated human blood leukocytes shows limited baseline differences.
A The tSNE-CUDA plots of representative newborn, adult and elder individuals showing the phenotypic distribution of indicated cell populations in MNCs. Indicated cell subsets were manually gated based on the phenotypic definition documented in Supplementary Table 2. For DR algorithm run, equal sampling (70K events of MNCs/donor) option was chosen in the Cytobank platform. tSNE-CUDA overlays identified manually gated cellular phenotypes and displayed by the indicated color profiles in the cellular landscape. B Violin plots showing the changes in the proportion of major immune cell subsets among CD45+ CD66a- MNCs (exported 70K events of MNCs/donor) across the three cohorts from tSNE-CUDA overlays. Mean fold differences in γδ T cell and B cell compartments are shown. Each dot represents a single participant. Statistical comparison was performed using either one-way ANOVA or nonparametric Kruskal-Wallis test corrected for multiple comparisons; ns denoted non-significant. (n = 7–10 per group).
Fig. 2
Fig. 2. Activation profile of co-stimulatory molecule CD86 on mDCs, pDCs and monocytes after PRRa stimulation.
A Representative median metal intensity (Med MI) of CD86 expression on mDCs in the elder cohort. Color in histogram indicates each participant’s (n = 7) CD86 activation profile upon PRRa stimulation. Non-stimulated BMCs (control) or stimulated with alum (10 μg/ml), MPLA (100 ng/ml), CpG (5 μM) and R848 (5 μM) for 18 h from newborn, adult and elder cohorts. Med MI of (B) mDCs, (C) pDCs and (D) monocytes are shown for each stimulation. Mean fold difference between CpG and R848 in elder monocyte compartment is also shown. Statistical comparison was performed using either one-way ANOVA or nonparametric Kruskal-Wallis test corrected for multiple comparisons; *p < 0.05, **p < 0.01, ***p < 0.001, ns denoted non-significant. Each dot represents a single participant (n = 7-11 per group).
Fig. 3
Fig. 3. TLR7/8a R848 drives CD40 upregulation on DCs and monocytes.
A Representative median metal intensity (Med MI) of CD40 expression on mDCs in the elder cohort. Color in the histogram indicates each participant’s (n = 7) CD40 activation profile upon PRRa stimulation. Non-stimulated BMCs (control) or stimulated with alum (10 μg/ml), MPLA (100 ng/ml), CpG (5 μM) and R848 (5 μM) for 18 h from newborn, adult and elder cohorts. Med MI of (B) mDCs, (C) pDCs, and (D) monocytes are shown for each stimulation. Mean fold differences between R848 and rest PRRa adjuvants in monocyte compartment are also shown. Statistical comparison was performed using nonparametric Kruskal-Wallis test corrected for multiple comparisons; *p < 0.05, **p < 0.01, ***p < 0.001, ns denoted non-significant. Each dot represents a single participant (n = 7–11 per group).
Fig. 4
Fig. 4. Innate IFNγ response in MNCs is distinct upon TLR7/8a treatment during PRRa adjuvant screening.
IFNγ expression (in Z-axis channel) overlaid on tSNE-CUDA embedding. Color indicates median metal intensity of IFNγ expression ranging from low (blue) to high (red). 70K events of MNCs from each donor used in concatenated visualization with tSNE-CUDA. A Non-stimulated BMCs or stimulated with (B) alum (10 μg/ml), (C) MPLA (100 ng/ml), (D) CpG (5 μM), and (E) R848 (5 μM) for 18 h from the newborn, adult and elder cohorts (n = 7–11 per group). For R848 stimulation, a manual gate in tSNE-CUDA plot indicates (for visualization, not for quantification) the predominant island expressing IFNγ in MNCs.
Fig. 5
Fig. 5. R848 has greater IFNγ inducing efficacy than other PRRa in human MNCs.
Non-stimulated BMCs were treated as control groups. BMCs were stimulated with alum (10 μg/ml), MPLA (100 ng/ml), CpG (5 μM) and R848 (5 μM) for 18 h from (A) newborn, (B) adult and (C) elder cohorts. A–C Proportion (frequencies) of IFNγ+ cells in MNCs are shown for each stimulation. Mean fold differences between R848 and MPLA in addition to CpG are also shown. D–F Radar plot demonstrated mean fold changes of cytokine levels (frequencies of cytokine+ cells in MNCs) relative to vehicle control. Statistical comparison was performed using nonparametric Kruskal-Wallis test corrected for multiple comparisons; *p < 0.05, **p < 0.01, ***p < 0.001, ns denoted non-significant. Each dot represents a single participant (n = 7–11 per group).
Fig. 6
Fig. 6. Mapping the cellular abundance of IFNγ producing MNCs by tSNE-CUDA reveals a unique role of NK cells.
A Representative plot of IFNγ expression (in Z-axis channel) of MNCs after R848 stimulation was overlaid on tSNE-CUDA embedding. Color indicates IFNγ expression ranging from low (blue) to high (red). A manual gate in tSNE-CUDA plot indicates (for visualization, not for quantification) the predominant island expressing IFNγ in MNCs, which fall into (B) tSNE-CUDA island of NK cells. C tSNE-CUDA overlays comparing the topography of tSNE plots from (B) after downsampling of 2500 IFNγ+ MNCs per donor from newborn, adult and elder cohorts. D Comparison between the frequency (as a percentage of the IFNγ+ MNCs) from the tSNE-CUDA overlaid embedding (from B) of the major immune cell lineages after R848 stimulation to find the key source of innate IFNγ production (n = 8–10 per group). N stands for newborn; A, adult and E, elder.
Fig. 7
Fig. 7. SPADE analysis of significantly abundant immune cell lineages in IFNγ producing MNC compartment after TLR7/8a (R848) stimulation highlights a secondary role of T cell subsets.
Proportion (frequencies) of (A) CD4+ T cells and (B) γδ T cells in IFNγ+ MNC compartment after R848 stimulation (N stands for newborn; A, adult and E, elder) from the tSNE-CUDA overlaid embedding (Fig. 6B & D). R848 stimulated IFNγ+ MNCs from all cohorts were used to generate SPADE trees by the Cytobank platform. Representative SPADE bubble of manually annotated CD4+ T cells (A, right panel) and γδ T cells (B, right panel) from elder (Supplementary Fig. 12I) and adult (Supplementary Fig. 12H) participants, respectively, shown here. Cell abundance is represented by size of the nodes. Each node displays a gradient from low (blue) to high (red) depending on the respective number of clustered cells (from Supplementary Fig. 12H & I). Indicated node IDs were generated anonymously by the Cytobank platform. C All the nodes from SPADE bubble of CD4+ T cells and (D) γδ T cells were analyzed to detect dependence of cellular abundance with age. Each dot represents a single participant (n = 8–10 per group). Statistical comparison was performed using either one-way ANOVA or nonparametric Kruskal-Wallis test corrected for multiple comparisons; *p < 0.05, **p < 0.01, ***p < 0.001, ns denoted non-significant.

Similar articles

Cited by

References

    1. Nanishi E, et al. Precision Vaccine Adjuvants for Older Adults: A Scoping Review. Clin. Infect. Dis. 2022;75:S72–S80. doi: 10.1093/cid/ciac302. - DOI - PMC - PubMed
    1. Lee, B., Nanishi, E., Levy, O. & Dowling, D. J. Precision Vaccinology Approaches for the Development of Adjuvanted Vaccines Targeted to Distinct Vulnerable Populations. Pharmaceutics15, 1766 (2023). - PMC - PubMed
    1. Barman S, Soni D, Brook B, Nanishi E, Dowling DJ. Precision Vaccine Development: Cues From Natural Immunity. Front Immunol. 2021;12:662218. doi: 10.3389/fimmu.2021.662218. - DOI - PMC - PubMed
    1. Dowling DJ, Levy O. A Precision Adjuvant Approach to Enhance Severe Acute Respiratory Syndrome Coronavirus 2 (SARS-CoV-2) Vaccines Optimized for Immunologically Distinct Vulnerable Populations. Clin. Infect. Dis. 2022;75:S30–S36. doi: 10.1093/cid/ciac342. - DOI - PMC - PubMed
    1. Donald, K. & Finlay, B. B. Early-life interactions between the microbiota and immune system: impact on immune system development and atopic disease. Nat. Rev. Immunol.23, 735–748 (2023). - PubMed

Publication types