

CarcSeq detection of lorcaserin-induced clonal expansion of Pik3ca H1047R mutants in rat mammary tissue
- PMID: 38851877
- PMCID: PMC11347771
- DOI: 10.1093/toxsci/kfae070
CarcSeq detection of lorcaserin-induced clonal expansion of Pik3ca H1047R mutants in rat mammary tissue
Abstract
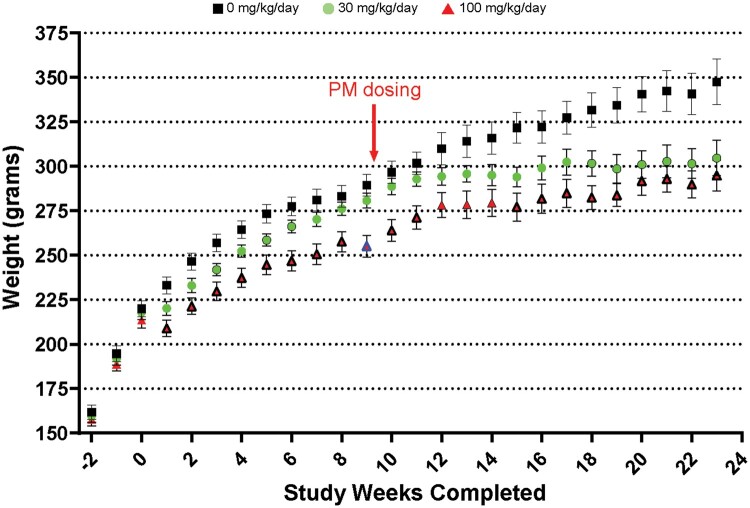
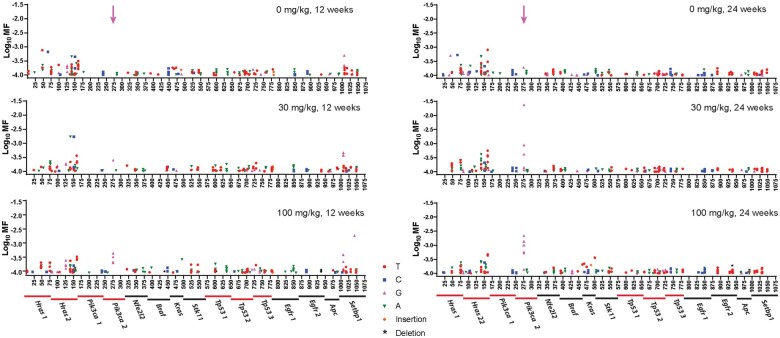
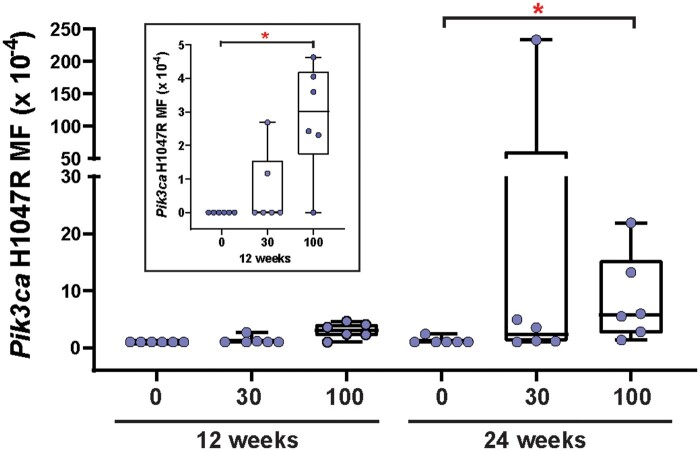
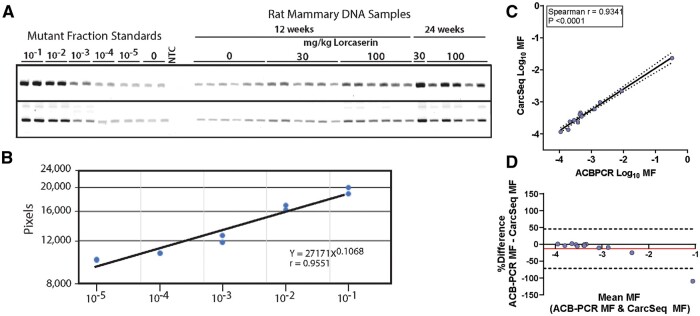
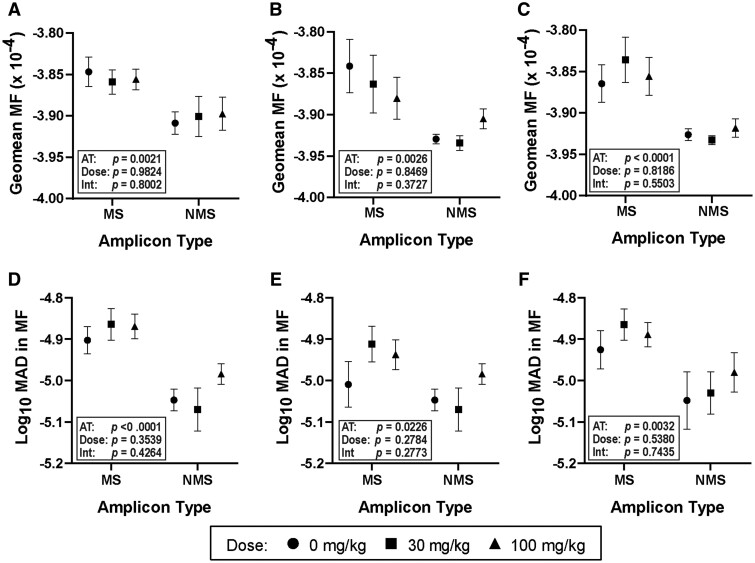
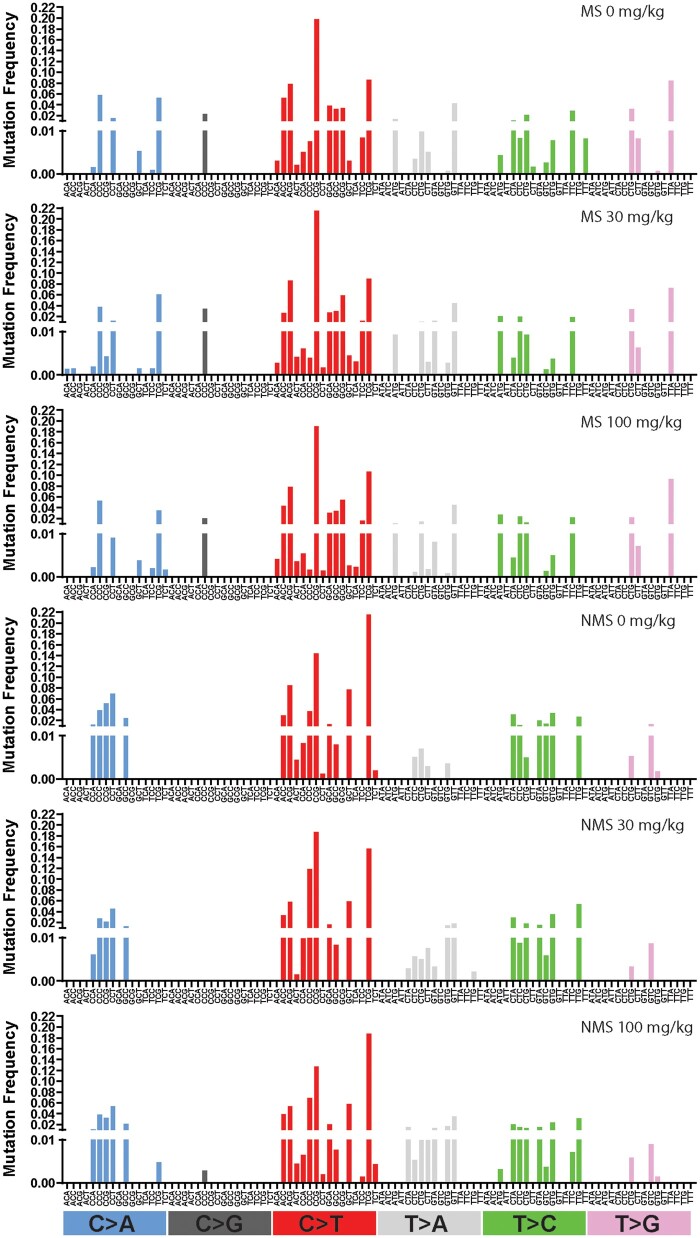
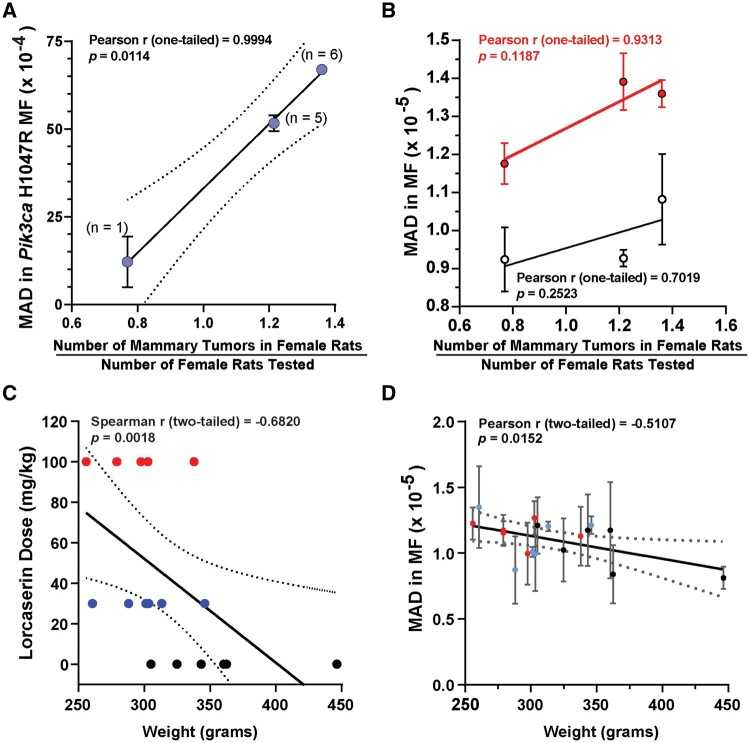
Lorcaserin is a 5-hydroxytryptamine 2C (serotonin) receptor agonist and a nongenotoxic rat carcinogen, which induced mammary tumors in male and female rats in a 2-yr bioassay. Female Sprague Dawley rats were treated by gavage daily with 0, 30, or 100 mg/kg lorcaserin, replicating bioassay dosing but for shorter duration, 12 or 24 wk. To characterize exposure and eliminate possible confounding by a potentially genotoxic degradation product, lorcaserin and N-nitroso-lorcaserin were quantified in dosing solutions, terminal plasma, mammary, and liver samples using ultra-high-performance liquid chromatography-electrospray tandem mass spectrometry. N-nitroso-lorcaserin was not detected, supporting lorcaserin classification as nongenotoxic carcinogen. Mammary DNA samples (n = 6/dose/timepoint) were used to synthesize PCR products from gene segments encompassing hotspot cancer driver mutations, namely regions of Apc, Braf, Egfr, Hras, Kras, Nfe2l2, Pik3ca, Setbp1, Stk11, and Tp53. Mutant fractions (MFs) in the amplicons were quantified by CarcSeq, an error-corrected next-generation sequencing approach. Considering all recovered mutants, no significant differences between lorcaserin dose groups were observed. However, significant dose-responsive increases in Pik3ca H1047R mutation were observed at both timepoints (ANOVA, P < 0.05), with greater numbers of mutants and mutants with greater MFs observed at 24 wk as compared with 12 wk. These observations suggest lorcaserin promotes outgrowth of spontaneously occurring Pik3ca H1047R mutant clones leading to mammary carcinogenesis. Importantly, this work reports approaches to analyze clonal expansion and demonstrates CarcSeq detection of the carcinogenic impact (selective Pik3ca H0147R mutant expansion) of a nongenotoxic carcinogen using a treatment duration as short as 3 months.
Keywords: cancer driver mutation; cancer risk assessment; carcinogenicity testing; mutation; nongenotoxic carcinogen; predictive toxicology.
© The Author(s) 2024. Published by Oxford University Press on behalf of the Society of Toxicology.
Conflict of interest statement
None declared.
Figures
Similar articles
-
CarcSeq Measurement of Rat Mammary Cancer Driver Mutations and Relation to Spontaneous Mammary Neoplasia.Toxicol Sci. 2021 Jul 16;182(1):142-158. doi: 10.1093/toxsci/kfab040. Toxicol Sci. 2021. PMID: 33822199
-
Assessment of Clonal Expansion Using CarcSeq Measurement of Lung Cancer Driver Mutations and Correlation With Mouse Strain- and Sex-Related Incidence of Spontaneous Lung Neoplasia.Toxicol Sci. 2021 Oct 27;184(1):1-14. doi: 10.1093/toxsci/kfab098. Toxicol Sci. 2021. PMID: 34373914
-
Quantification of cancer driver mutations in human breast and lung DNA using targeted, error-corrected CarcSeq.Environ Mol Mutagen. 2020 Nov;61(9):872-889. doi: 10.1002/em.22409. Epub 2020 Sep 28. Environ Mol Mutagen. 2020. PMID: 32940377 Free PMC article.
-
Role of DNA repair in carcinogen-induced ras mutation.Mutat Res. 2000 May 30;450(1-2):139-53. doi: 10.1016/s0027-5107(00)00021-x. Mutat Res. 2000. PMID: 10838139 Review.
-
Mammary gland carcinogenesis by 2-amino-1-methyl-6-phenylimidazo[4,5-b]pyridine in rats: possible mechanisms.Cancer Lett. 1999 Sep 1;143(2):211-5. doi: 10.1016/s0304-3835(99)00127-5. Cancer Lett. 1999. PMID: 10503906 Review.
References
-
- Acha-Sagredo A, Ganguli P, Ciccarelli FD.. 2022. Somatic variation in normal tissues: friend or foe of cancer early detection? Ann Oncol. 33(12):1239–1249. - PubMed
-
- Blanca MJ, Alarcón R, Arnau J, Bono R, Bendayan R.. 2017. Non-normal data: is ANOVA still a valid option? Psicothema. 29(4):552–557. - PubMed
MeSH terms
Substances
Grants and funding
LinkOut - more resources
Full Text Sources
Research Materials
Miscellaneous
