. 2024 Jun;532(6):e25628.
doi: 10.1002/cne.25628.

Cellular-resolution gene expression mapping reveals organization in the head ganglia of the gastropod, Berghia stephanieae

Affiliations

Cellular-resolution gene expression mapping reveals organization in the head ganglia of the gastropod, Berghia stephanieae

M Desmond Ramirez et al. J Comp Neurol. 2024 Jun.

Abstract

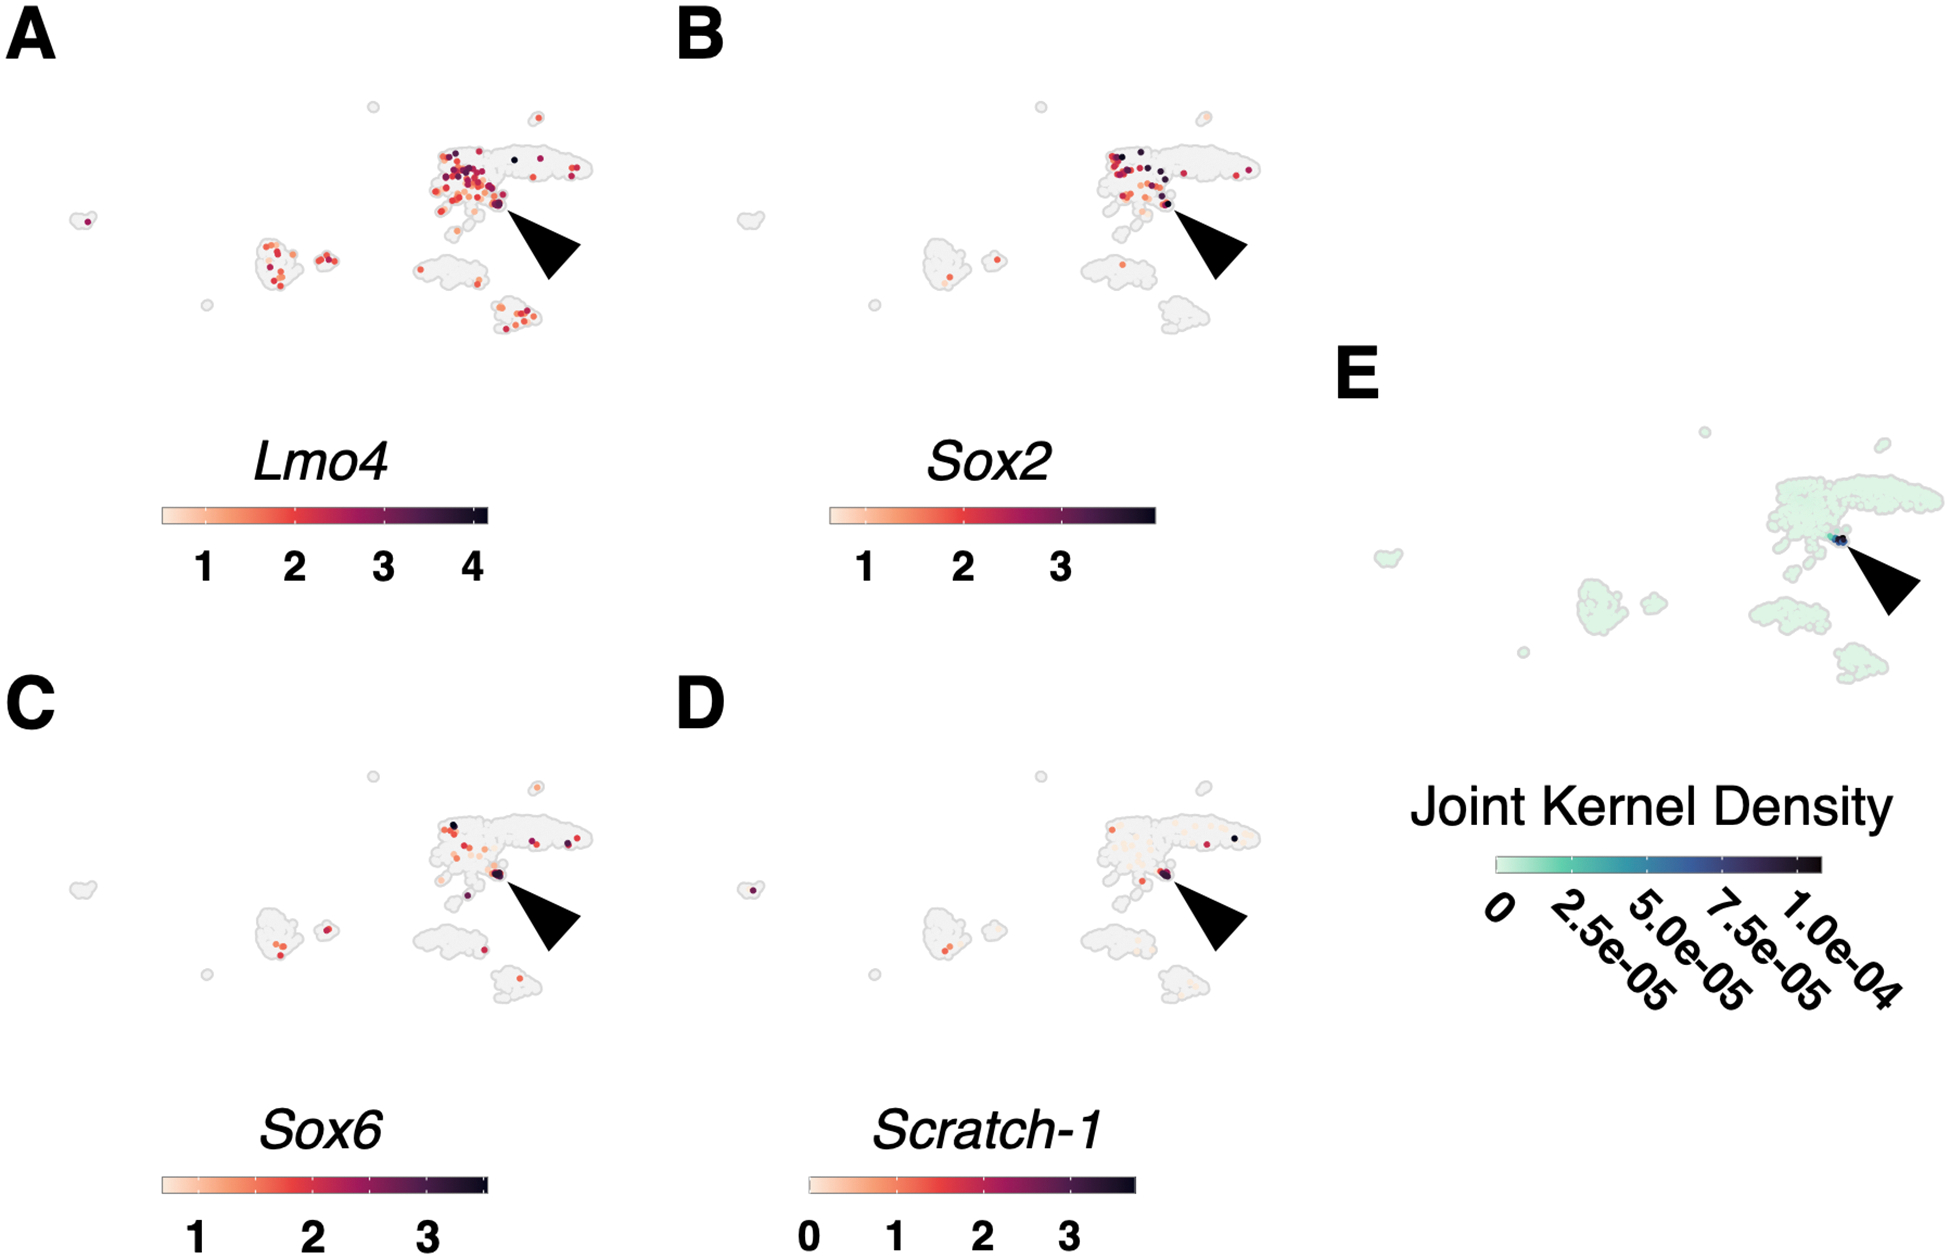
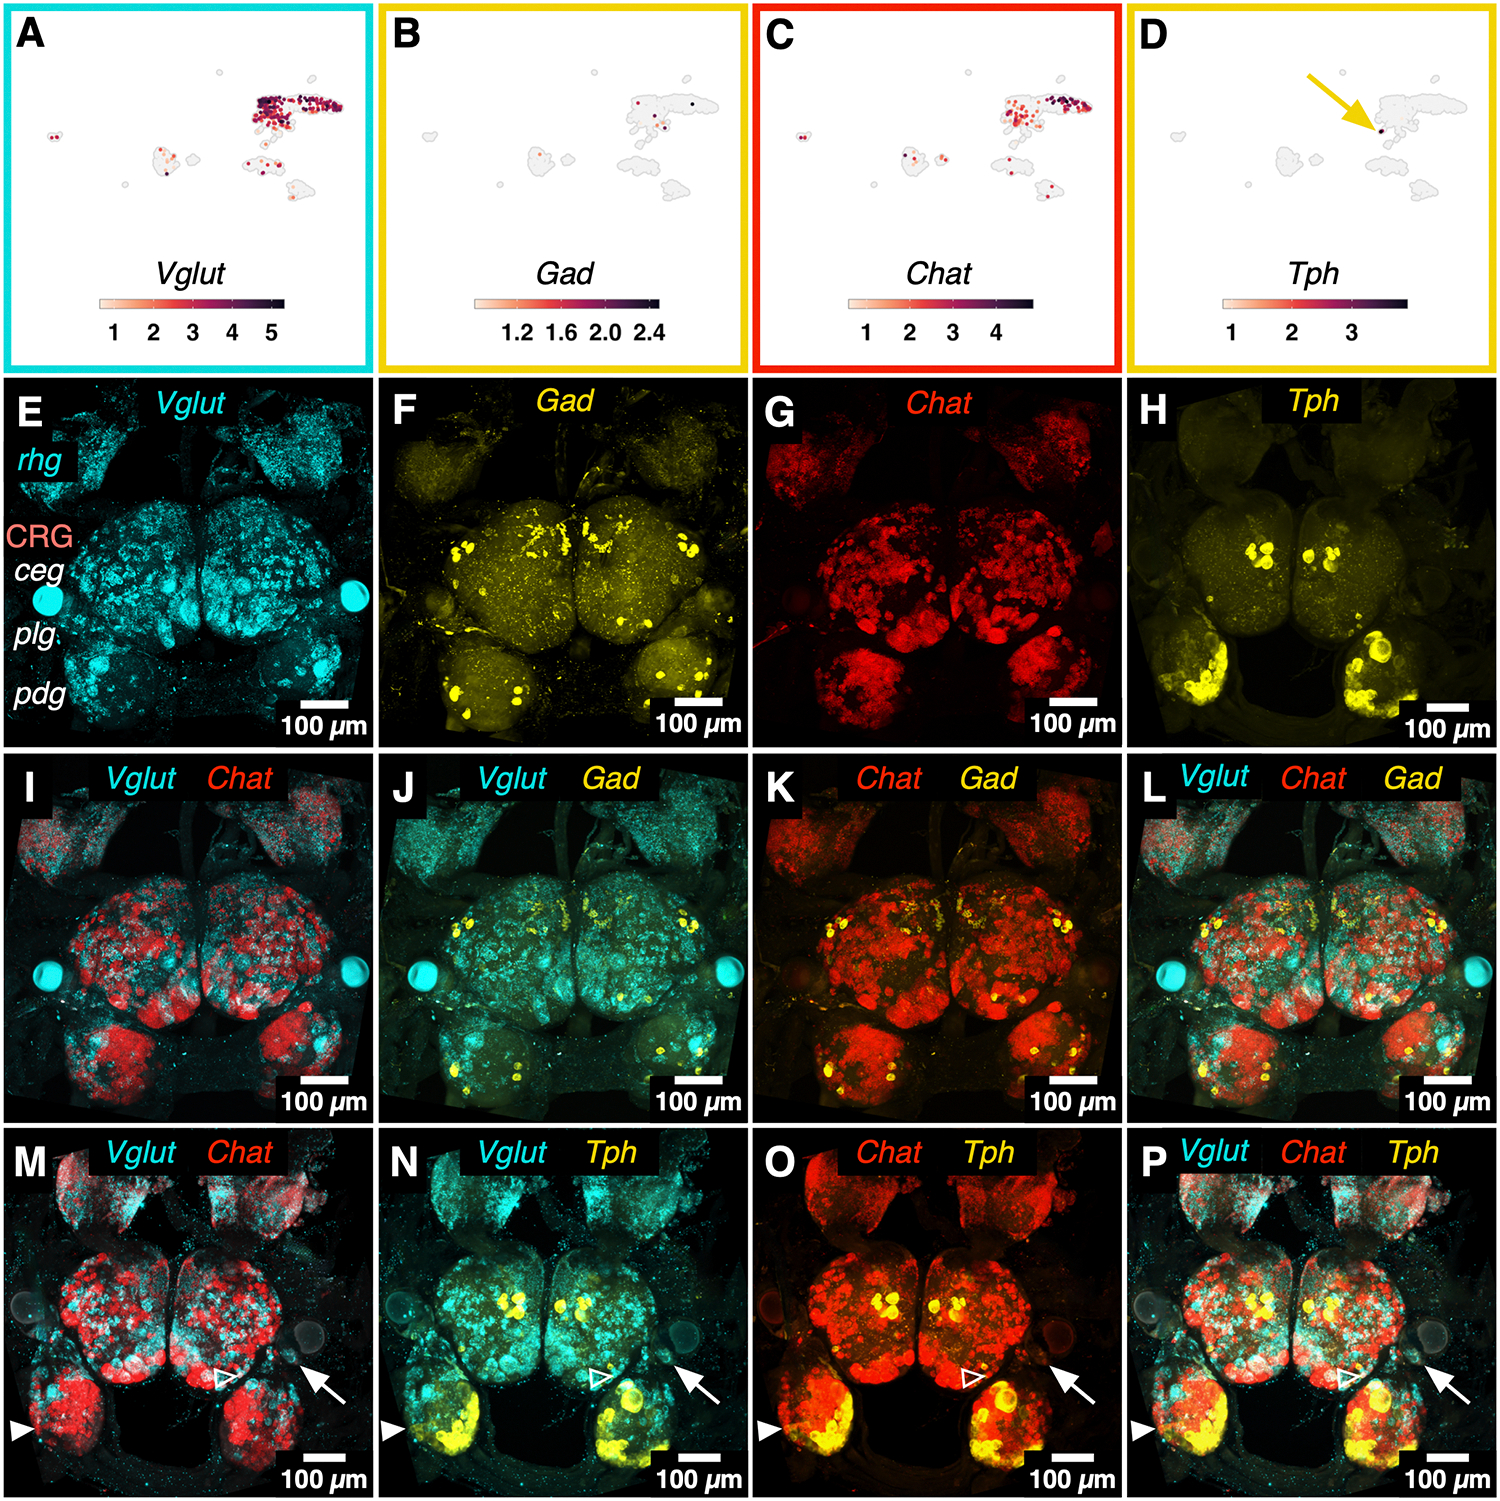
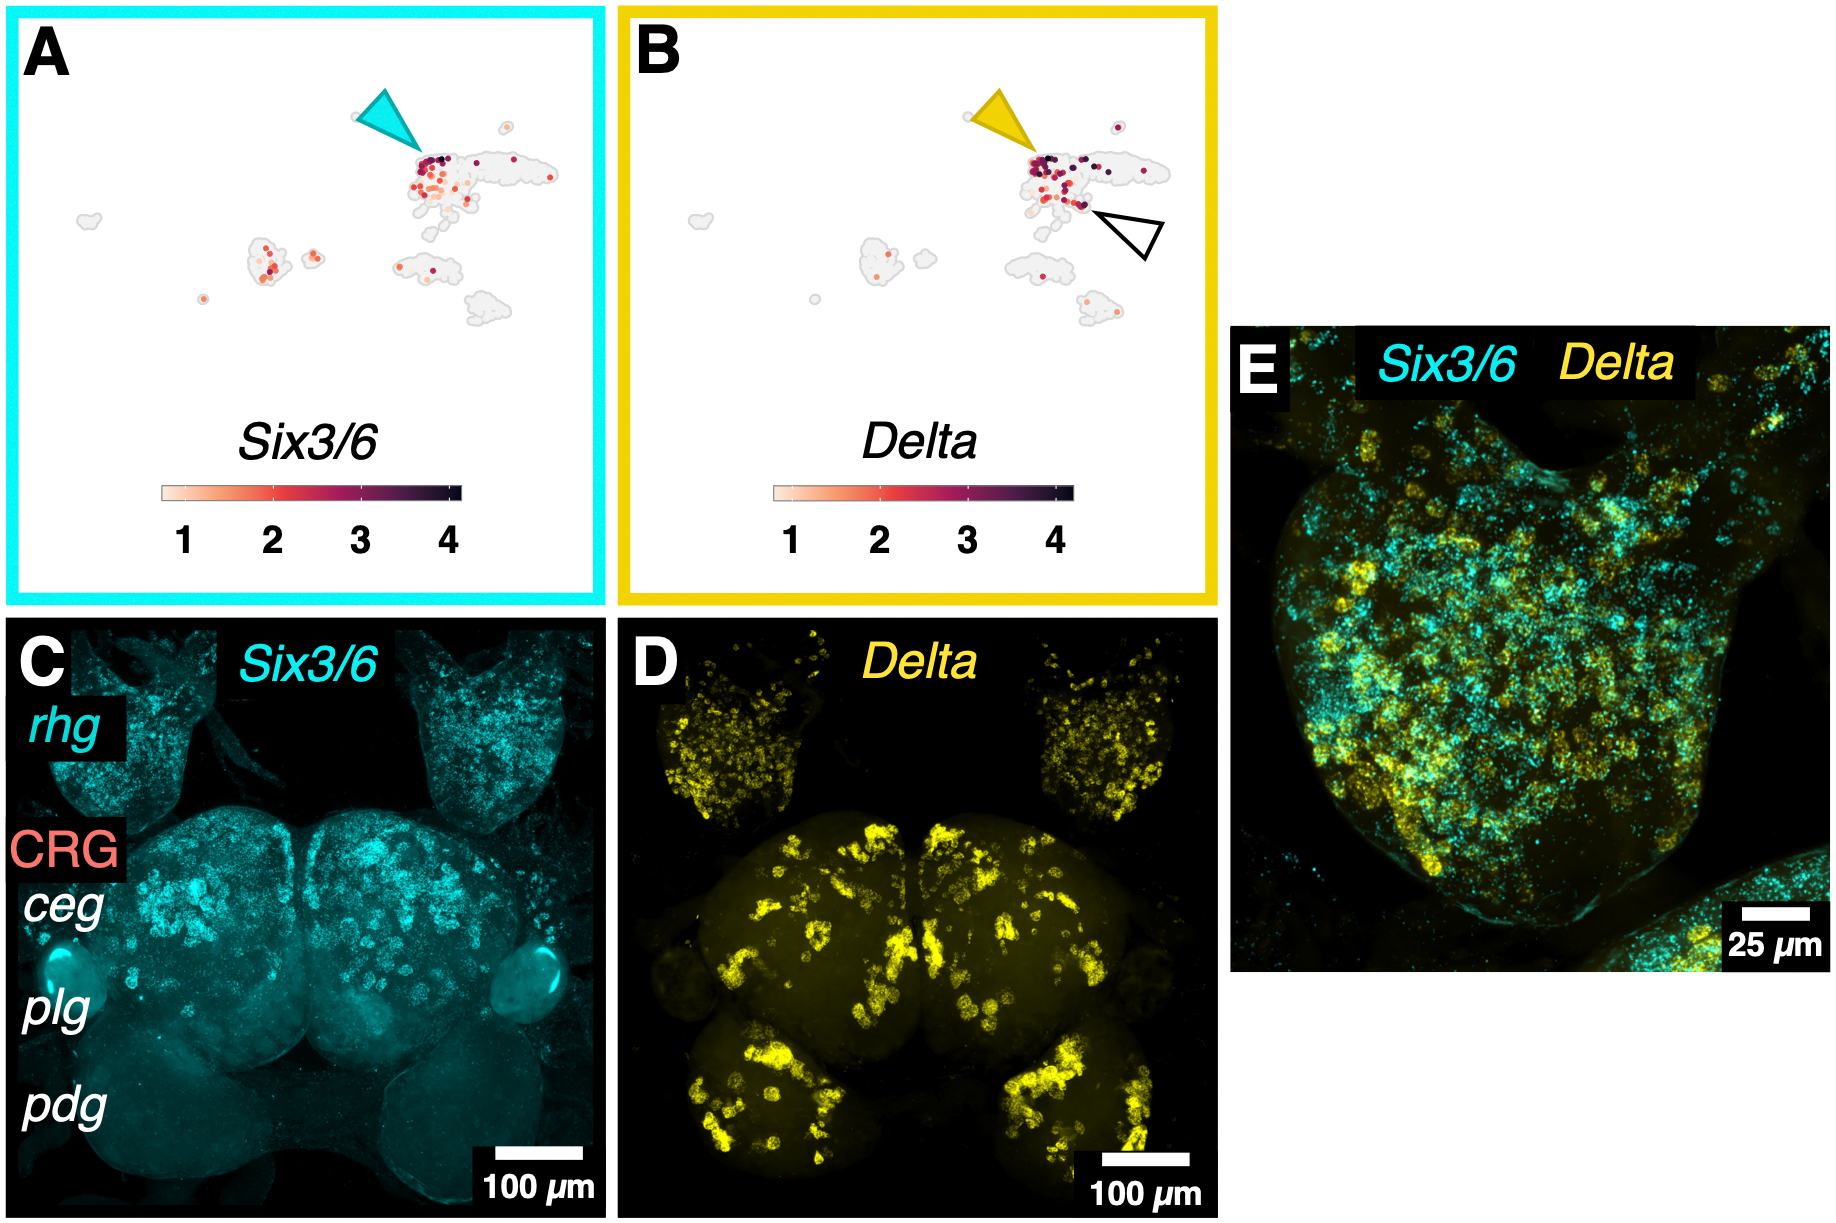
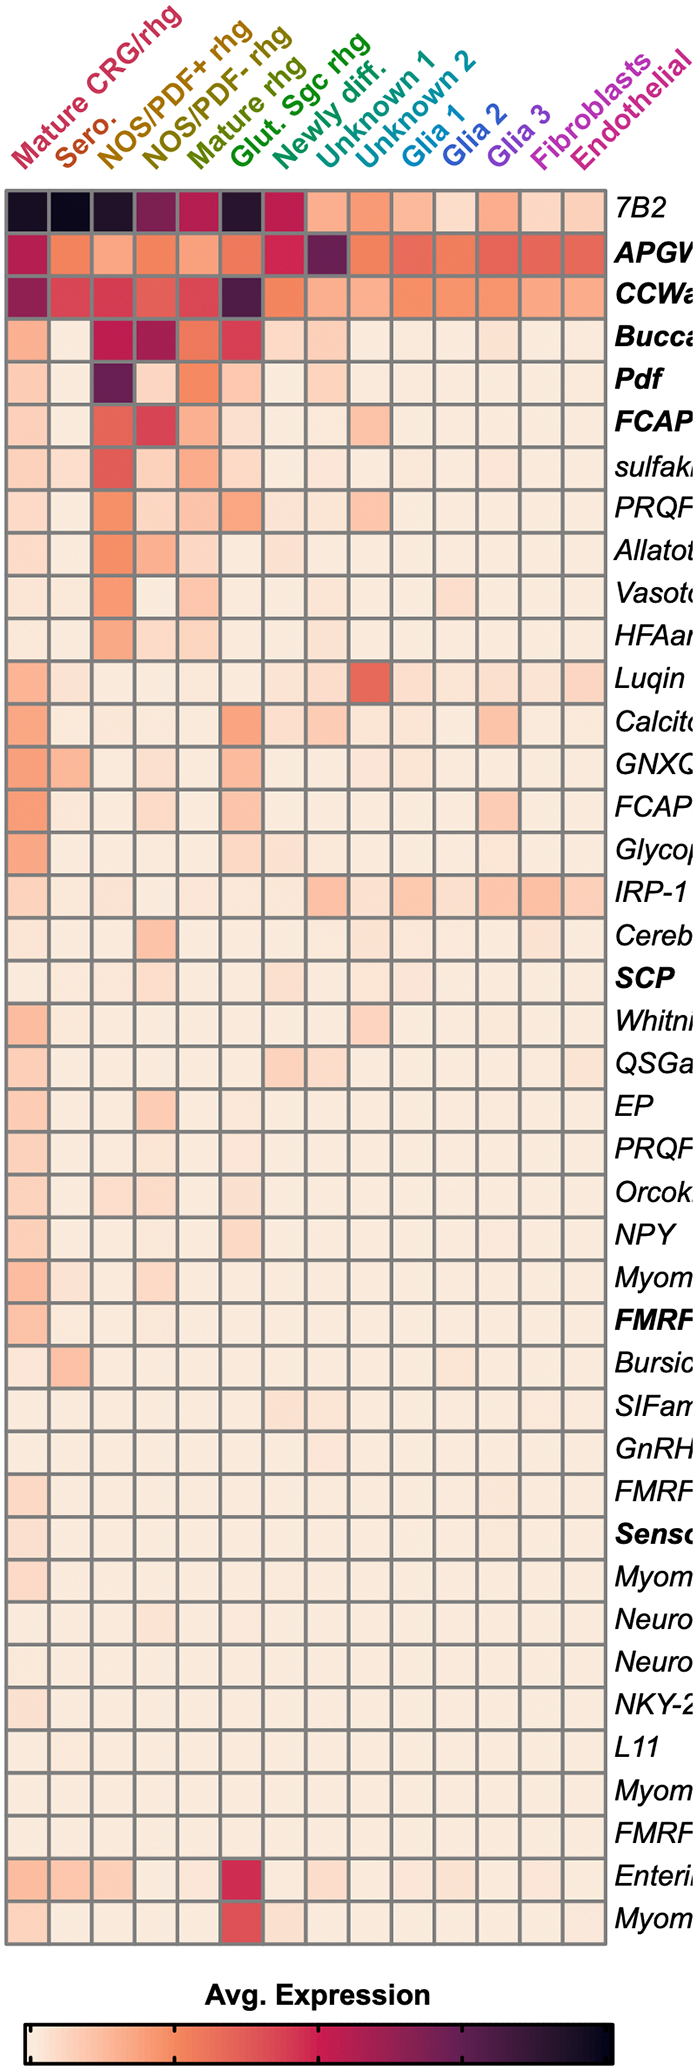
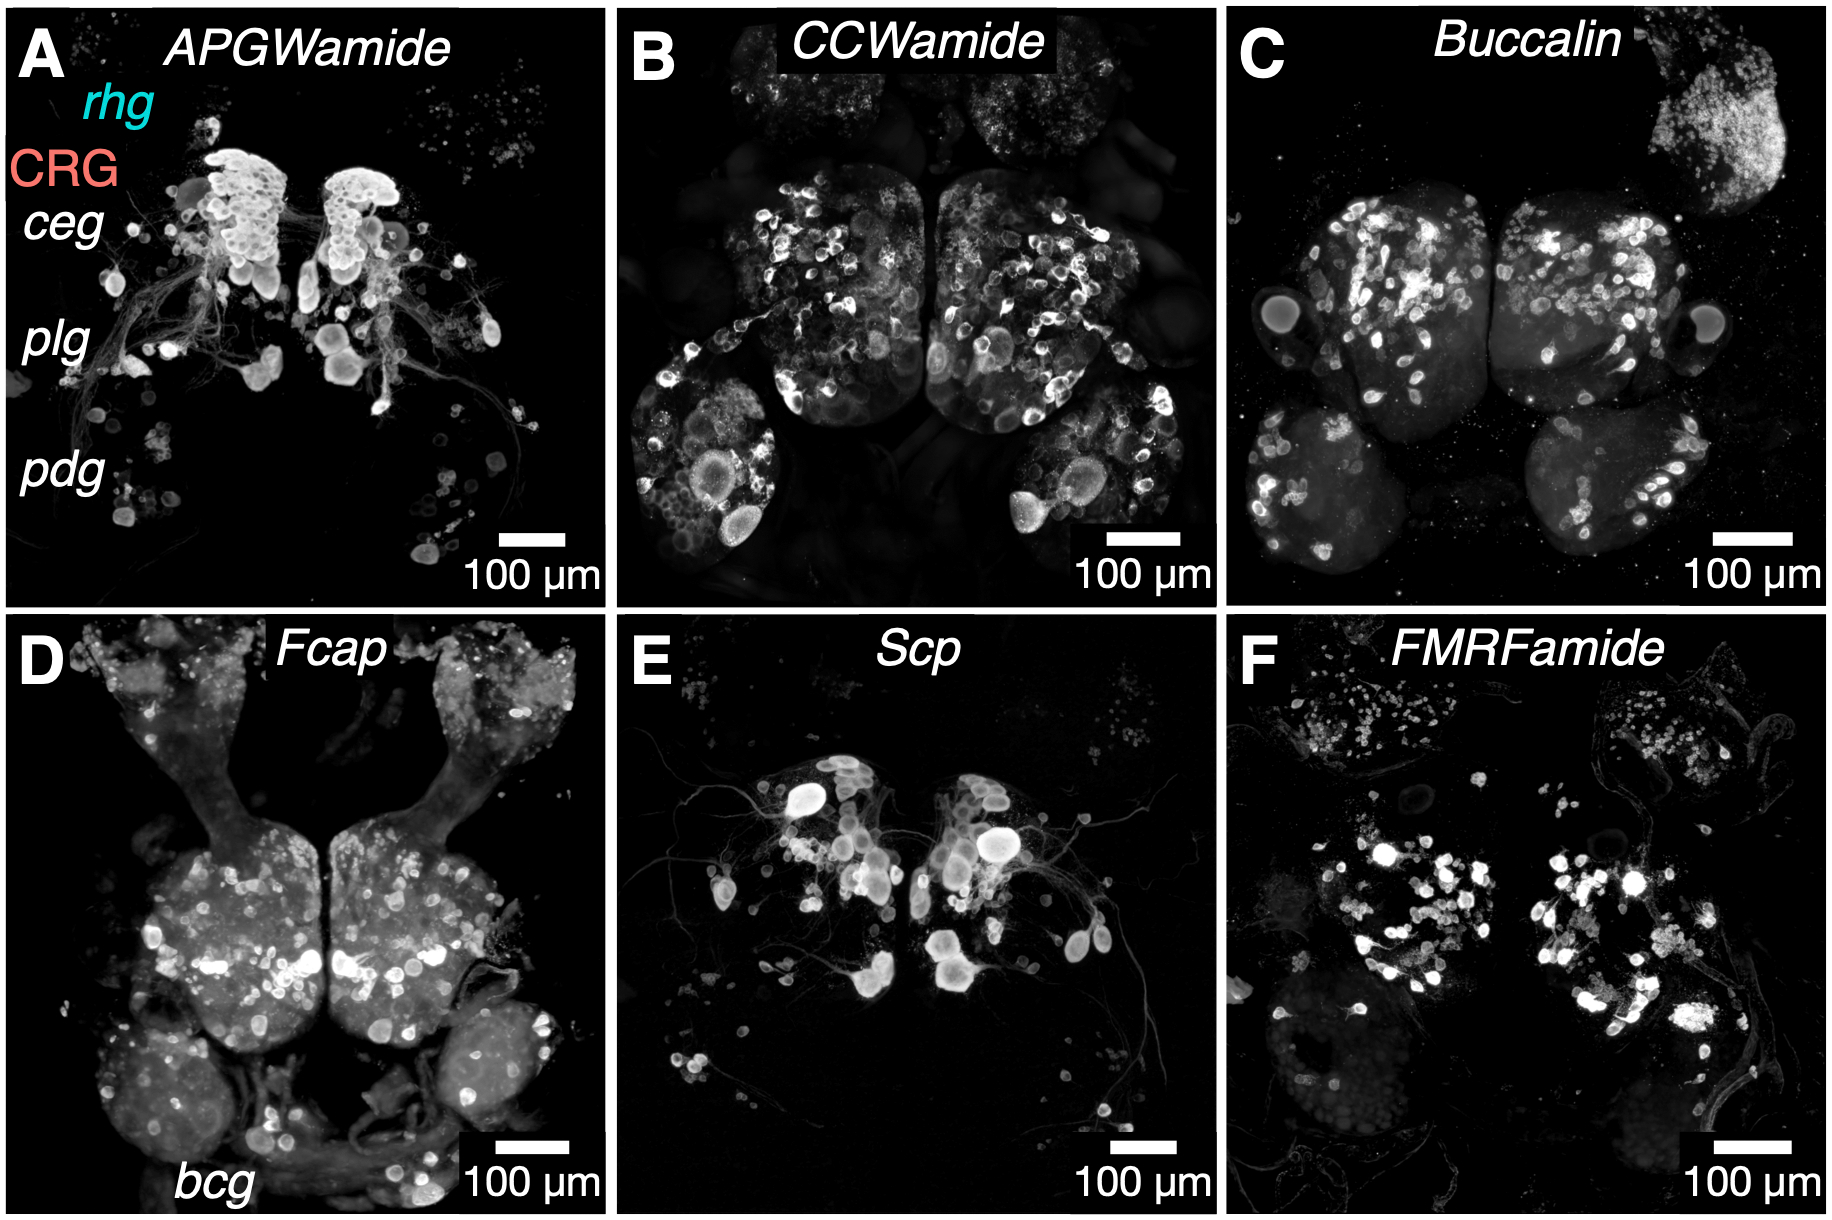
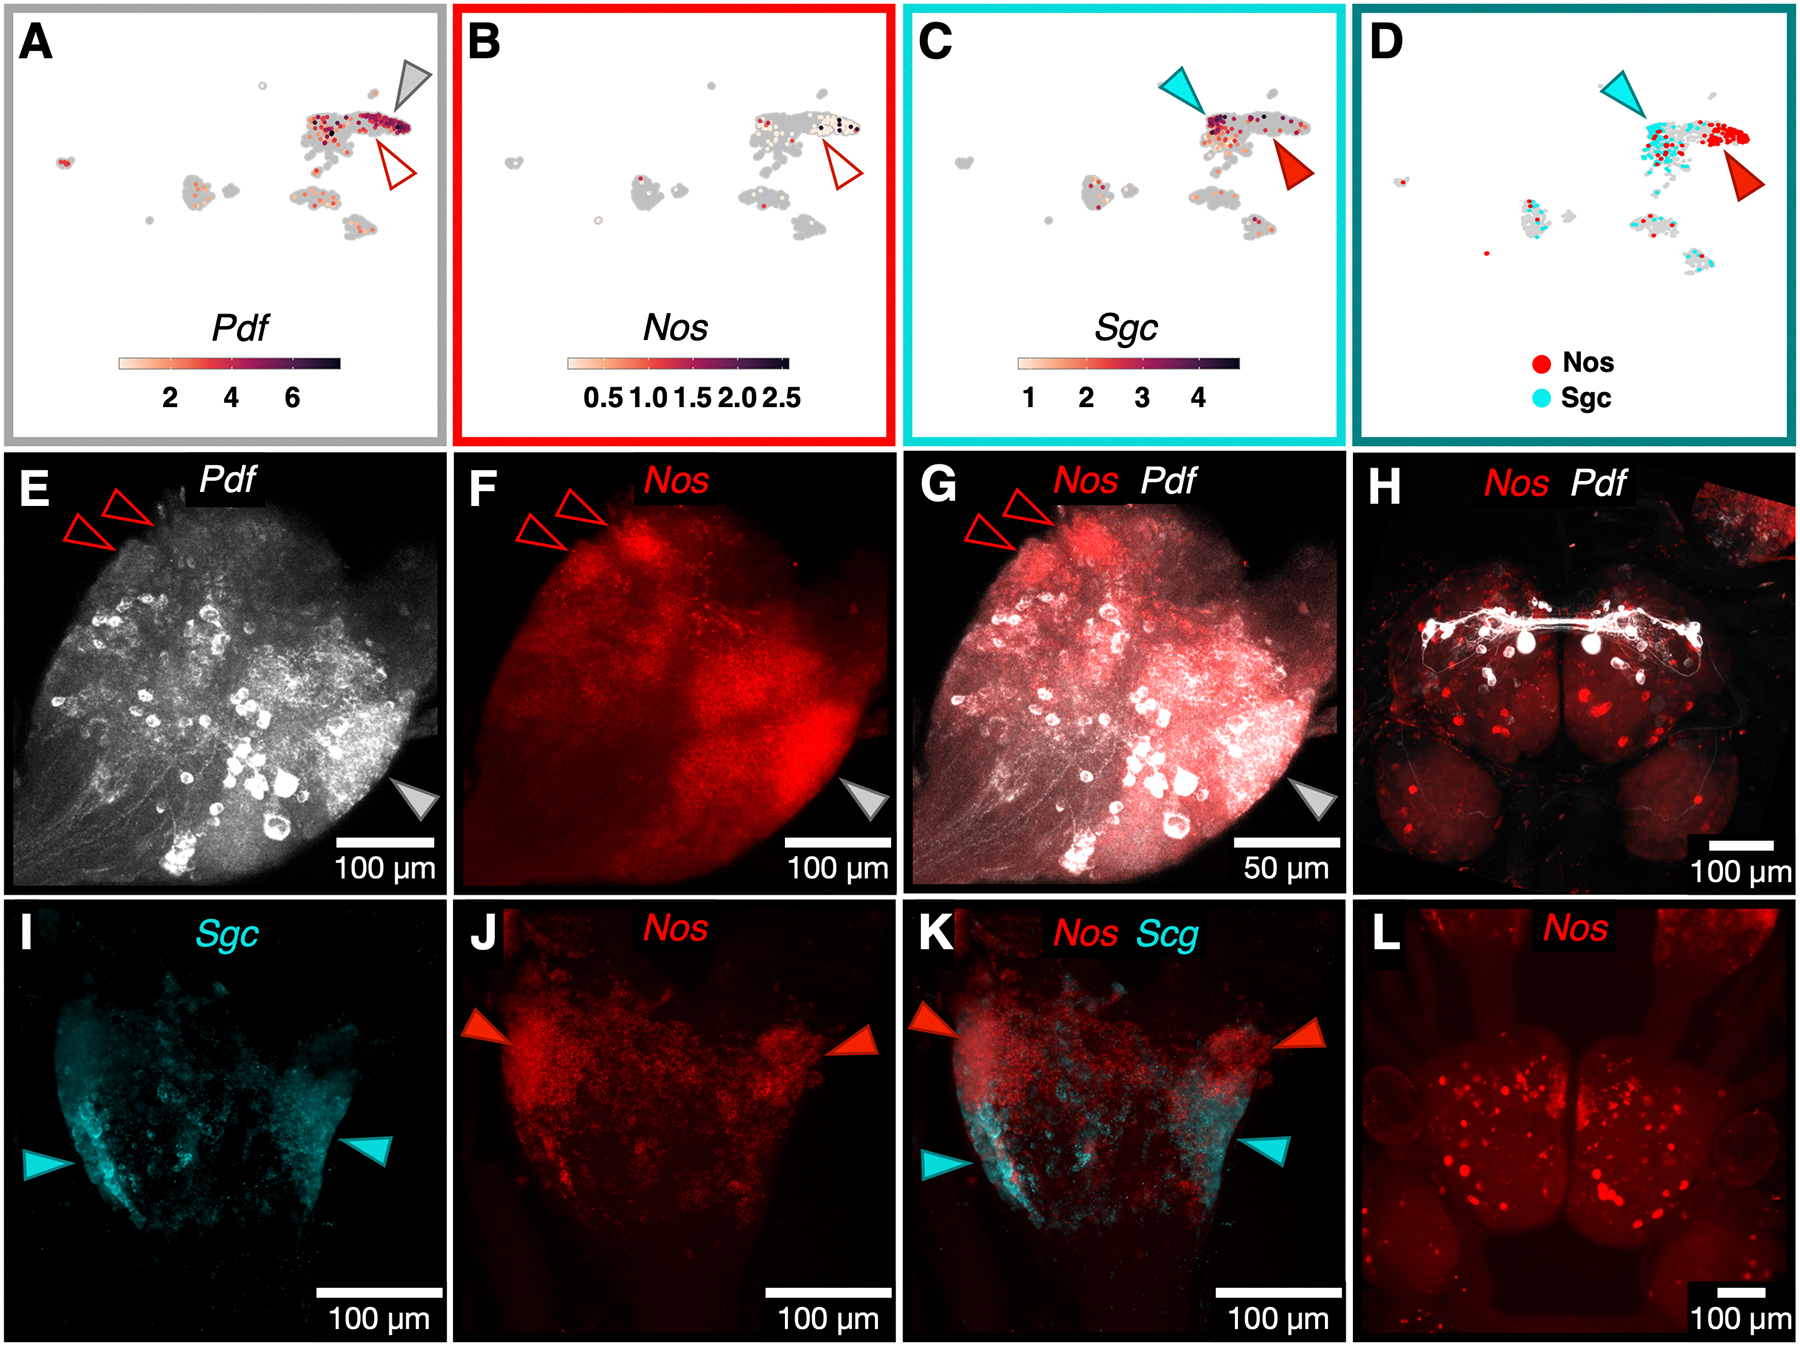
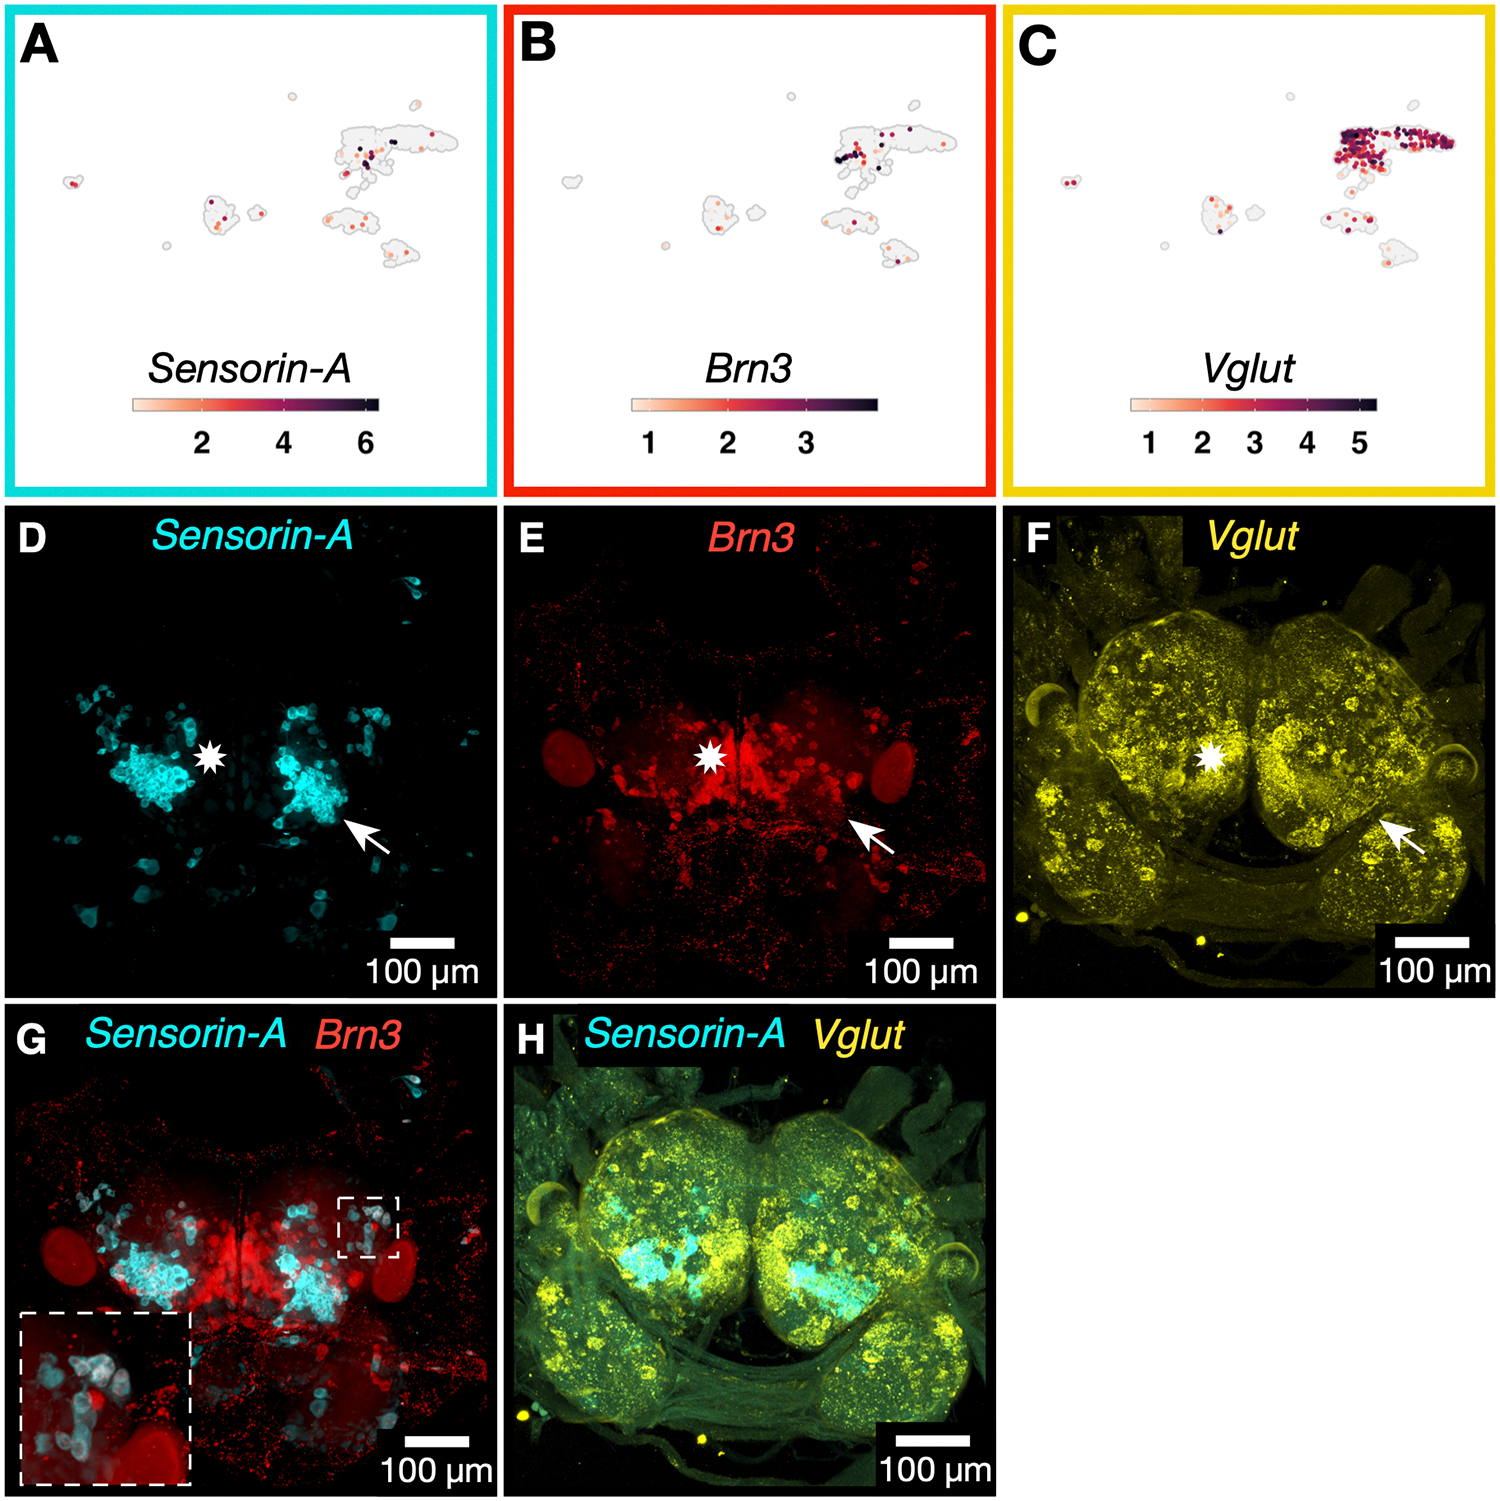
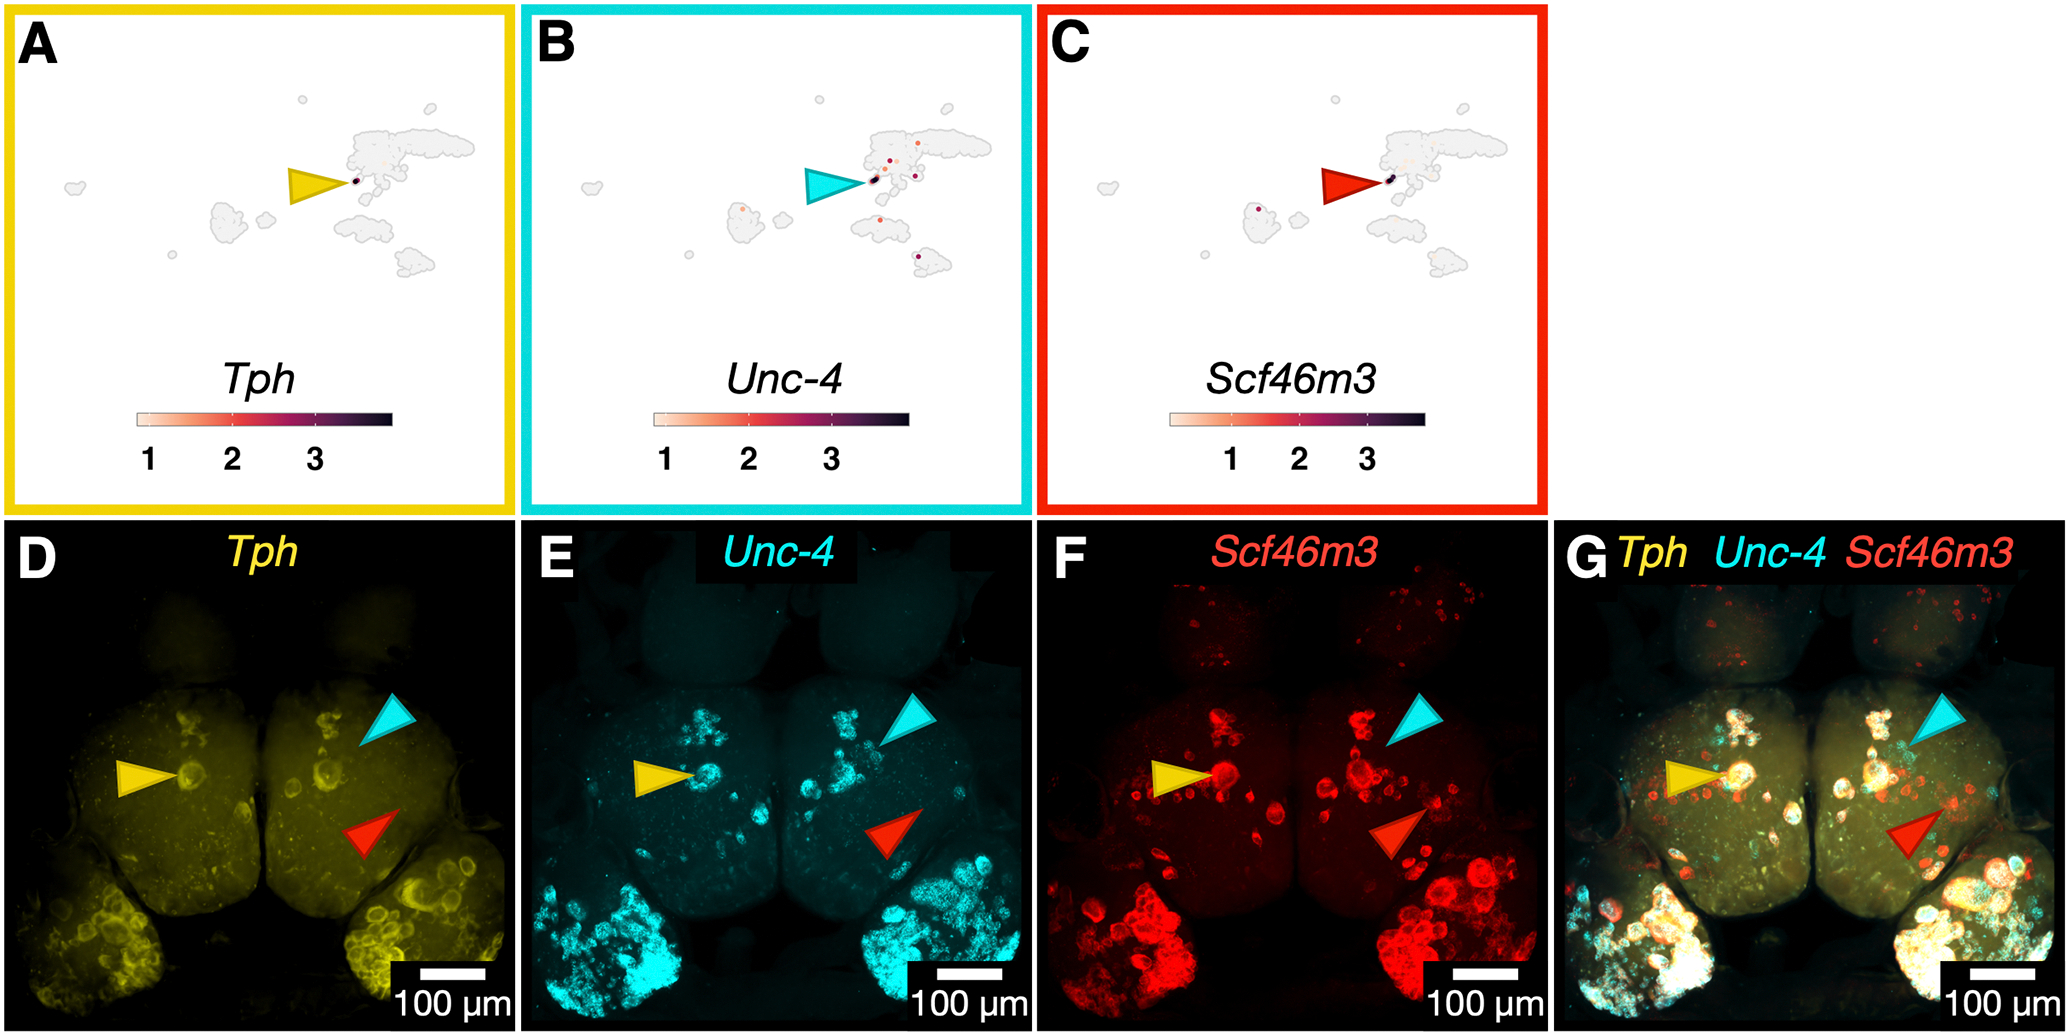
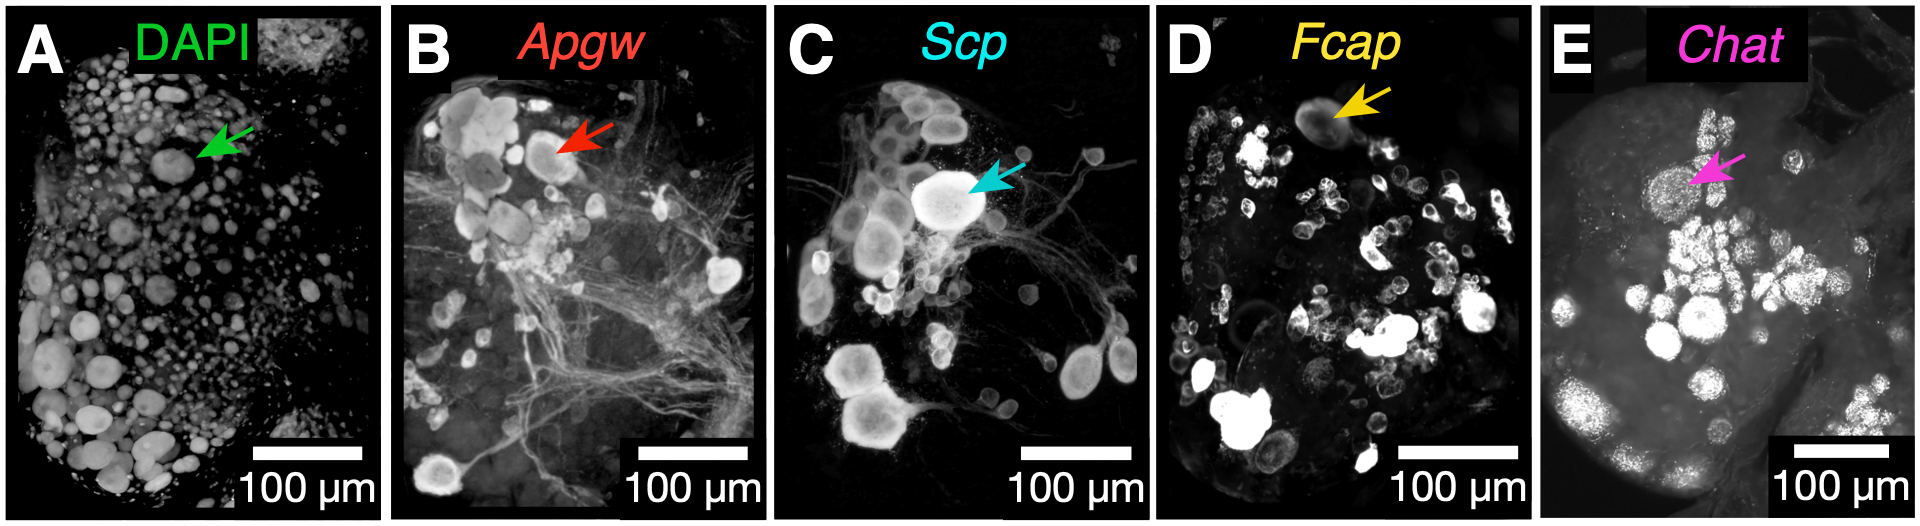
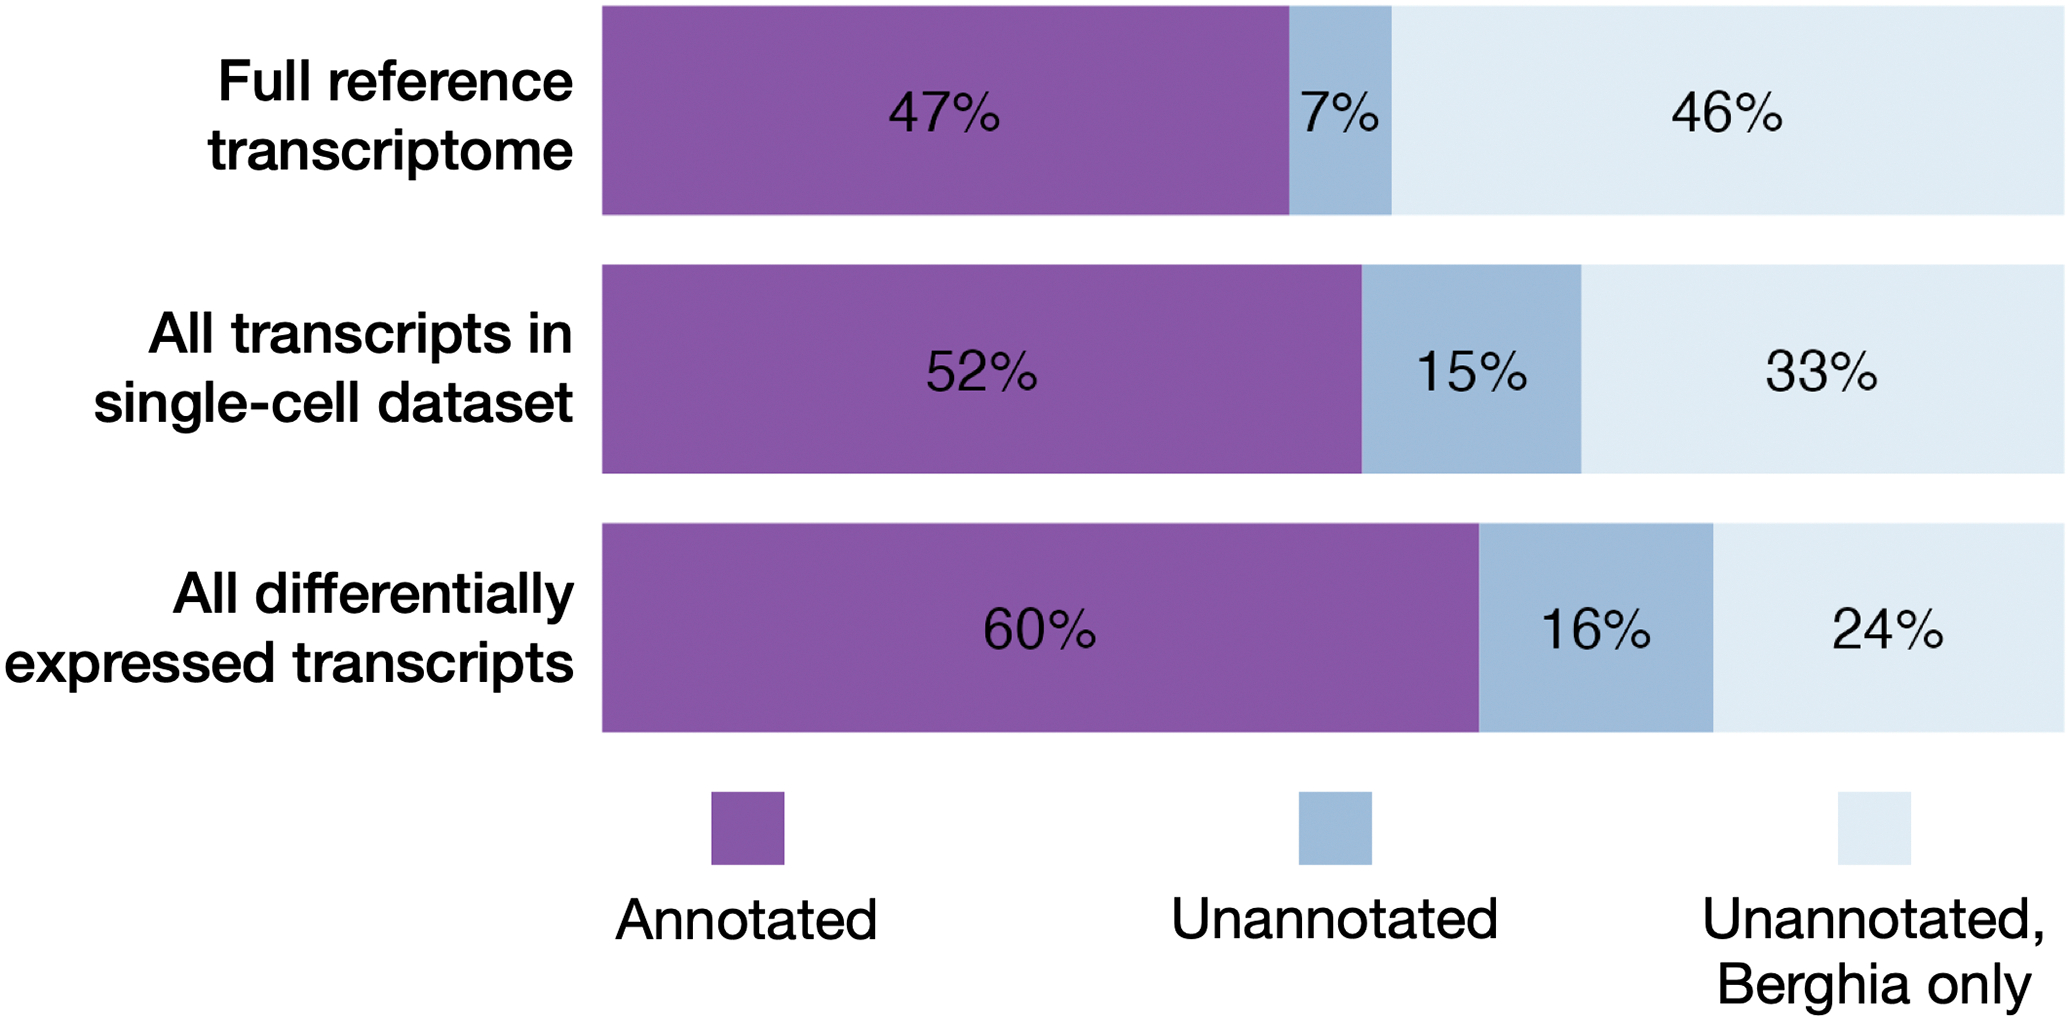
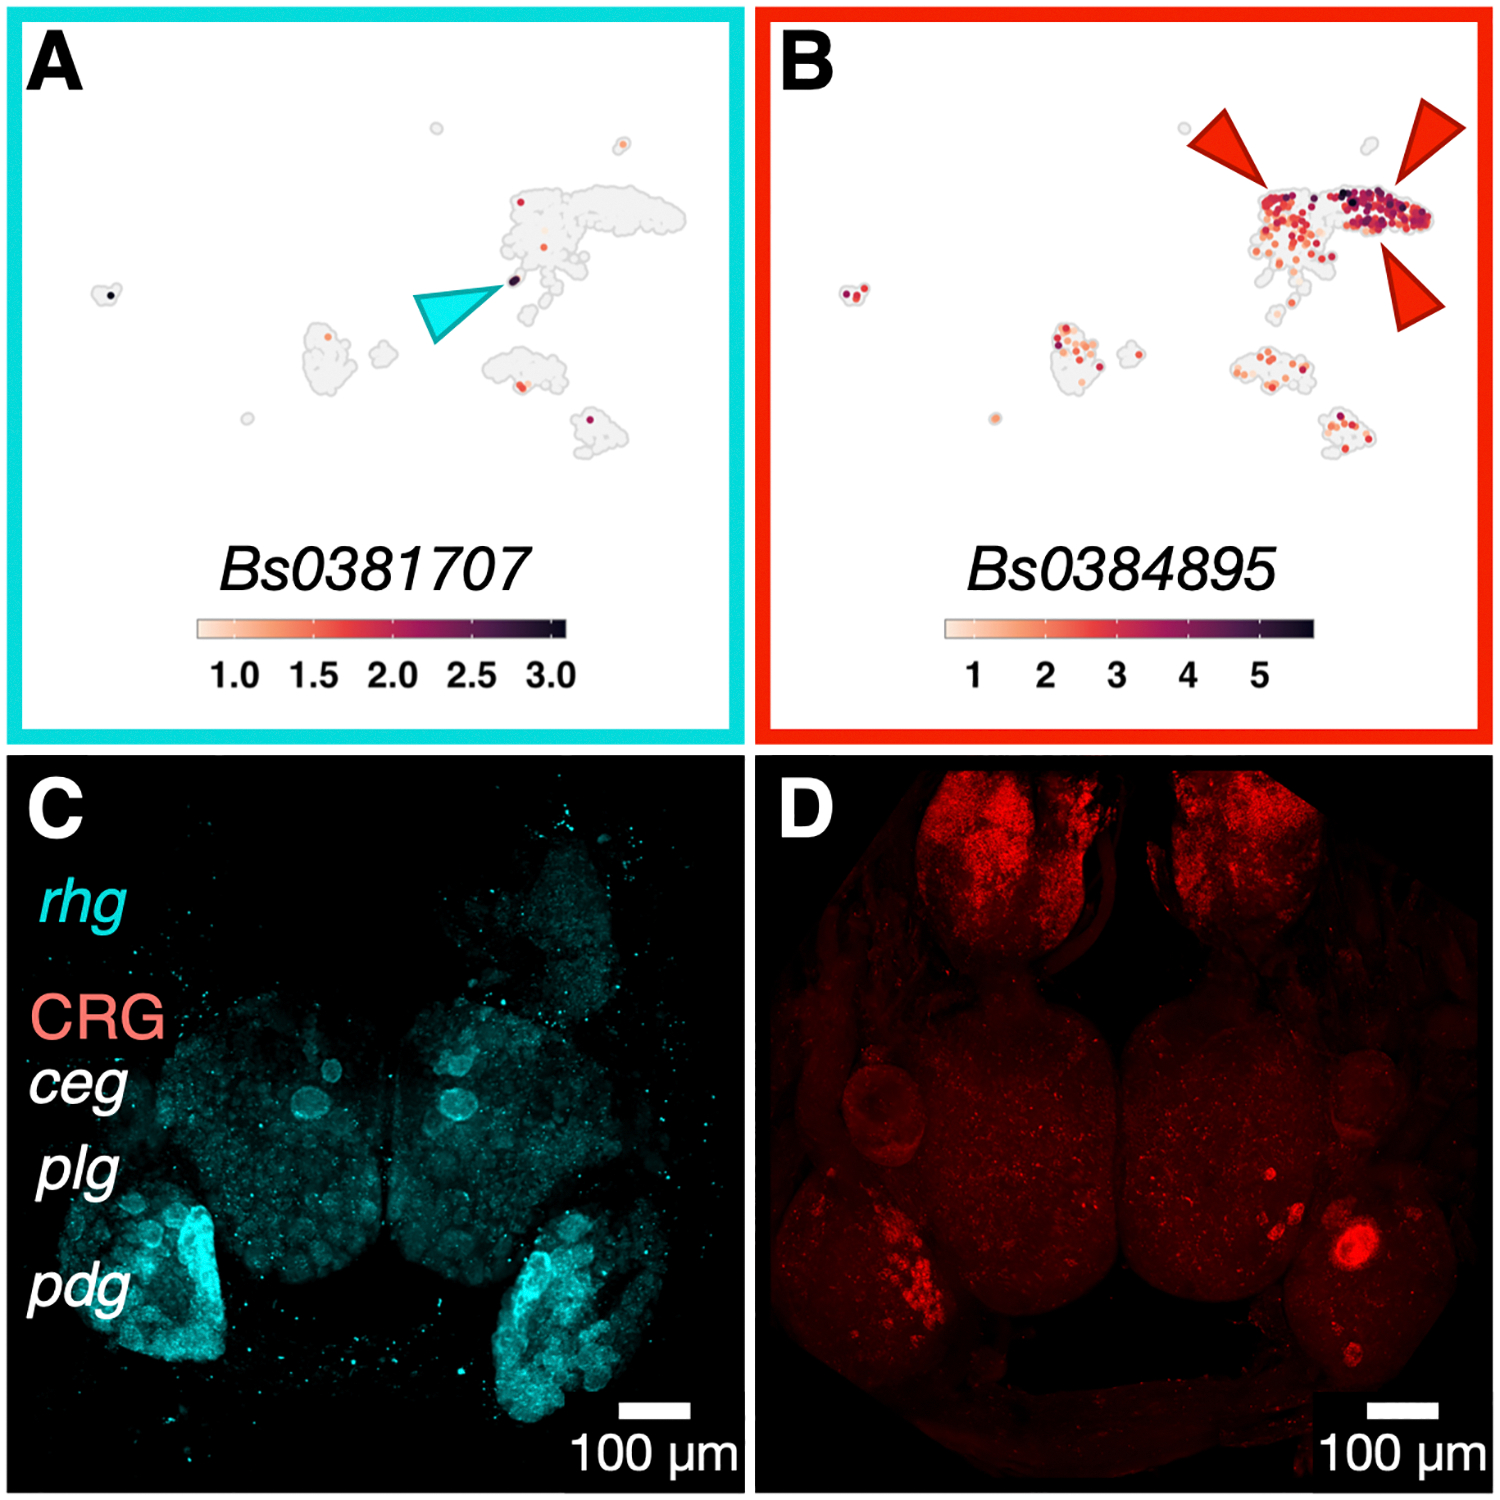
Gastropod molluscs such as Aplysia, Lymnaea, and Tritonia have been important for determining fundamental rules of motor control, learning, and memory because of their large, individually identifiable neurons. Yet only a small number of gastropod neurons have known molecular markers, limiting the ability to establish brain-wide structure-function relations. Here we combine high-throughput, single-cell RNA sequencing with in situ hybridization chain reaction in the nudibranch Berghia stephanieae to identify and visualize the expression of markers for cell types. Broad neuronal classes were characterized by genes associated with neurotransmitters, like acetylcholine, glutamate, serotonin, and GABA, as well as neuropeptides. These classes were subdivided by other genes including transcriptional regulators and unannotated genes. Marker genes expressed by neurons and glia formed discrete, previously unrecognized regions within and between ganglia. This study provides the foundation for understanding the fundamental cellular organization of gastropod nervous systems.

Keywords: Identified neurons; glial cells; neuroanatomy; neurochemistry; transcription factors.


Conflict of interest statement

Conflict of Interest

The authors declare no conflict of interest.

Figures

Fig. 1.
Fig. 1.
The Berghia brain atlas consists of cells taken from the central ring ganglia (CRG) and rhinophore ganglia (rhg). A) An adult Berghia, showing the head and positions of the rhinophores, eyes, and oral tentacles. B) 3D rendered and pseudocolored image of autofluorescence of the brain in an intact animal embedded in hydrogel. MHD-assisted CLARITY (Dwyer et al. 2021) was used to clear the tissue, which was then imaged using lightsheet microscopy. The right rhg (cyan) and CRG (pink) are shown. The dashed line crosses the rhg - ceg connective. C) Z-projection of a fluorescence confocal image of dissected head ganglia with DAPI-labeled nuclei. The CRG and rhg ganglia are labeled and colored corresponding to the 3D rendering in B. The bcg are not shown. Abbreviations: ceg - cerebral ganglion, plg - pleural ganglion, pdg - pedal ganglion, bcg - buccal ganglion.
Fig. 2.
Fig. 2.
The Berghia single cell atlas contains 14 cell clusters, with 9 neuronal clusters and 5 non-neuronal clusters. A) Unifold Manifest Approximation and Projection (UMAP) plot of the Berghia single cell RNA-seq dataset from the two samples, the CRG (pink) and rhg (cyan). Most clusters are a mix from both samples. B) UMAP plot showing 1580 Berghia cells organized into 14 clusters. Non-neuronal clusters are contained within the shaded box.
Fig. 3.
Fig. 3.
Dotplot of selected marker genes for each cluster. Non-neuronal cell types are boxed in gray. Cluster names and colors correspond to those in Fig. 2B.
Fig. 4.
Fig. 4.
Pan-neuronal and pan-glial genes mark their respective cell types. A-D) UMAP plots showing mRNA abundances and distributions for Elav-1 (A), 7B2 (B), Bs19097 (C), and Apolipophorin (D). E-H) Single optical sections of a fluorescence confocal z-stack using HCR to label mRNA for pan-neuronal and pan-glial markers: Elav-1 (E), 7B2 (F), unannotated transcript Bs19097 (G), and the pan-glial marker Apolipophorin (H). The yellow arrow indicates one of the individually identifiable giant glial cells. I) Expression of both Bs19097 (cyan) and Apolipophorin (red) in the same sample. Panels G-I are from the same multiplexed HCR sample.
Fig. 5.
Fig. 5.
Marker genes expressed in a cluster containing newly differentiated neurons. A-D) Lmo4 (A), Sox2 (B), Sox6 (C), and Scratch-1 (D). E) Joint kernel density plot showing the peak of overlapping expression of the four genes specifically in the newly differentiated neuron cluster (arrowheads).
Fig. 6.
Fig. 6.
Abundance and visualization of mRNA for neurotransmitter-associated enzymes and transporters in Berghia. A-D) UMAP plots showing mRNA abundances of Vglut (A), Gad (B), Chat (C), and Tph (D) across neuronal clusters. The yellow arrow in (D) points to the small cluster of Tph+ neurons. E-H) Z-projections of fluorescence confocal images using HCR to label Vglut (E), Gad (F), Chat (G), and Tph (H). E-G are channels from the same multiplexed sample; I-L show Vglut, Gad, and Chat pairwise and triple-labeled from that same sample. M-P show Vglut, Chat and Tph pairwise and triple-labeled in the sample shown in (H). The white arrows point to a Vglut+ photoreceptor in the eye. The open white arrowheads point to a neuron double labeled for Vglut and Chat. The solid white arrowheads point to a neuron double-labeled for Chat and Tph. Most of the neurons are labeled for only one of the genes.
Fig. 7.
Fig. 7.
Expression of transcriptional regulators and signaling pathway genes help define different brain regions. A) Six3/6 mRNA was most abundant in Soluble guanylate cyclase (Sgc) rhg neurons in the single cell atlas and was differentially expressed in this cluster (cyan arrowhead). B) Delta mRNA was concentrated in the Sgc rhg (yellow arrowhead) and differentiating neuron (white arrowhead) clusters in the single cell atlas. Delta was differentially expressed in the Sgc rhg neuron cluster. C) Z-projection of a fluorescence confocal image using HCR to label Six3/6 mRNA. It was almost exclusively present in neurons in the anterior-most ganglia, the rhg and the cerebral ganglion ceg. D) Z-projection of a fluorescence confocal image of the left rhg using HCR to label Delta mRNA showed it was widely distributed across the ganglion. Many neurons in the rhg contained Delta mRNA, some of which likely correspond with the Sgc rhg neurons. E) Higher magnification of the rhg showing co-expression of Six3/6 and Delta in many of the same neurons. C, D, and E are the same sample.
Fig. 8
Fig. 8
Over 40 types of neuropeptides were found within the atlas, and their expression varied by cluster. The mature CRG/rhg neuron cluster contained the largest number of neurons and showed the largest and most varied expression of neuropeptides between the clusters. Only a few neuropeptides were restricted to specific clusters. Luqin was primarily expressed in the Unknown 1 cluster of neurons. Enterin and Myomodulin-like-neuropeptide-3 expression marked neurons in the glutamatergic, Sgc+ rhg cluster. Asterisks indicate neuropeptides that were selected for visualization using HCR in Figs 9 & 10.
Fig 9.
Fig 9.
Neuropeptide expression was distinct for each gene and varied greatly in the number of neurons and their distributions across the ganglia. Z-projections of a fluorescence confocal image using HCR to label mRNA for eight neuropeptides: APGWamide (A), CCWamide (B), Buccalin (C), Fcap (D), Scp (E), and FMRFamide (F).
Fig. 10.
Fig. 10.
Differences in location and co-expression within Nos-expressing neuronal populations are matched by spatial segregation. A-D) UMAP plots of mRNA abundances of the neuropeptide Pdf (A), Nos (B), and Sgc (C) in the single cell atlas. D) UMAP plots showing mutually exclusive expression of either Nos (red), or Sgc (cyan) in some rhg neuron populations. E-G) Z-projections of a fluorescence confocal image using HCR to label mRNA for Pdf (E), Nos (F), and the two channels merged (G) in the rhg. Open red arrowheads show Nos-expressing cells, and the closed arrowhead shows Pdf-expressing cells. H) Z-projection of a fluorescence confocal image using HCR to label mRNA for Pdf (white), Nos (red) in the CRG. A pair of medium sized Pdf+ neurons sit near the midline in the ceg and send projections contralaterally. The projections appear to meet other Pdf+ neurons in the ceg, which together form a distinct loop throughout the ganglia. I-K) Z-projections of a fluorescence confocal image using HCR to label mRNA in the rhinophore ganglia for Sgc (I), Nos (J) and the merged image (K). There were distinct populations of cells expressing each gene in the rhg. Closed red arrowheads indicate Nos+ neuron populations, and closed cyan arrowheads indicate Sgc+ neuron populations. L) Z-projection of fluorescence confocal stack using HCR to label mRNA for Nos (red) in the CRG.
Fig. 11.
Fig. 11.
Co-expression of Vglut in Brn3+ cells indicates mechanosensory neuronal identity. A-C) UMAP plots showing expression of Sensorin-A (A), Brn3 (B) and Vglut (C) in the single cell dataset. Z-projection of a fluorescence confocal image using multiplexed HCR to label mRNA for D) Sensorin-A, and E) Brn3 in the same sample. F) Z-projection of a fluorescence confocal image HCR to label mRNA for Vglut. White arrow indicates the likely homologs of the S-cells (Getting 1976) known from other nudibranchs, expressing both SenA and Vglut, but not Brn3. White star indicates cell populations that express Brn3 and Vglut, but not SenA. G) A merged z-projection of fluorescence confocal images of multiplexed HCR for SenA and Brn3 in the same sample as (D, E). Dotted box indicates closeup of SenA+/Brn3+ neurons in the ceg. H) A merged z-projection of fluorescence confocal images of multiplexed HCR for SenA and Vglut in the same sample as (F).
Fig. 12.
Fig. 12.
HCR labeling shows mRNA for Tryptophan hydroxylase (Tph), Unc-4 and Solute carrier family 46 member 3 (Scf46m3) were co-expressed in serotonergic neurons. A-C) UMAP plots showing mRNA abundances for Tph (A), Unc-4 (B), and Scf46m3 (C). Arrowheads point to the cluster where all three genes are found. D-G) Z-projection of a fluorescence confocal image using HCR to label Tph (D), Unc-4 (E), and Scf46m3 (F). G) The merged image showing the overlap of these 3 genes. The yellow arrowheads point to the likely homolog of the Aplysia metacerebral cell, seen in all three channels. The cyan arrowhead points to an example of neurons expressing only Unc-4. The red arrowhead points to an example of neurons expressing only Scf46m3.
Fig. 13.
Fig. 13.
Molecular fingerprint for the giant ventral peptidergic neuron was assembled by analyzing different images of gene expression patterns with Z-projection of a fluorescence confocal image using HCR. Each image shows the right ceg and plg. Arrows indicate the large identifiable neuron in each. A) Nuclei labeled with DAPI. (B-E) HCR labeling for: APGWamide (B), Scp (C), Fcap (D) and Chat (E). All panels are from different samples.
Fig. 14.
Fig. 14.
Stacked bar plots of the proportions of Hierarchical Orthogroups (HOGs) for different subsets of the transcriptome that were annotated, unannotated and shared between Berghia and at least one other species, or unannotated and Berghia-specific. The threshold for differentially expressed genes was an FDR adjusted p-value of less than 0.05.
Fig. 15.
Fig. 15.
Differentially expressed, unannotated genes are expressed in a cluster-specific manner. A) UMAP plot for unannotated gene Bs0381707 shows highest expression in the small cluster of Tph+ neurons in the single cell dataset. B) UMAP plot for unannotated gene Bs0384895 shows highest expression in rhg clusters in the single cell dataset. C) Z-projection of a fluorescence confocal image using HCR to label mRNA for Bs0381707 shows its expression was exclusive to the serotonergic, Tph+ neurons in the brain. D) Z-projection of a fluorescence confocal image using HCR to label for Bs0384895 shows widespread, high expression in the rhg. However, there were also multiple, small, discrete groupings of Bs0384895+ neurons in the plg and pdg, including one giant neuron in the pdg.

Similar articles

Cited by

References

    1. Albertin CB, Simakov O, Mitros T, Wang ZY, Pungor JR, Edsinger-Gonzales E, Brenner S, Ragsdale CW, & Rokhsar DS (2015). The octopus genome and the evolution of cephalopod neural and morphological novelties. Nature, 524(7564), 220–224. 10.1038/nature14668 - DOI - PMC - PubMed
    1. Alquicira-Hernandez J, & Powell JE (2021). Nebulosa recovers single-cell gene expression signals by kernel density estimation. Bioinformatics, 37(16), 2485–2487. 10.1093/bioinformatics/btab003 - DOI - PubMed
    1. Altschul SF, Gish W, Miller W, Myers EW, and Lipman DJ. 1990. “Basic Local Alignment Search Tool.” J. Mol. Biol 215 (3): 403–10. - PubMed
    1. Arey LB (1918). THE MULTIPLE SENSORY ACTIVITIES OF THE SO-CALLED RHINOPHORE OF NUDIBRANCHS. American Journal of Physiology-Legacy Content, 46(5), 526–532. 10.1152/ajplegacy.1918.46.5.526 - DOI
    1. Asprer JST, Lee B, Wu C-S, Vadakkan T, Dickinson ME, Lu H-C, & Lee S-K (2011). LMO4 functions as a co-activator of neurogenin 2 in the developing cortex. Development, 138(13), 2823–2832. 10.1242/dev.061879 - DOI - PMC - PubMed

Publication types

LinkOut - more resources