

Enhancing Chicago Classification diagnoses with functional lumen imaging probe-mechanics (FLIP-MECH)
- PMID: 38852150
- PMCID: PMC11246220
- DOI: 10.1111/nmo.14841
Enhancing Chicago Classification diagnoses with functional lumen imaging probe-mechanics (FLIP-MECH)
Abstract
Background: Esophageal motility disorders can be diagnosed by either high-resolution manometry (HRM) or the functional lumen imaging probe (FLIP) but there is no systematic approach to synergize the measurements of these modalities or to improve the diagnostic metrics that have been developed to analyze them. This work aimed to devise a formal approach to bridge the gap between diagnoses inferred from HRM and FLIP measurements using deep learning and mechanics.
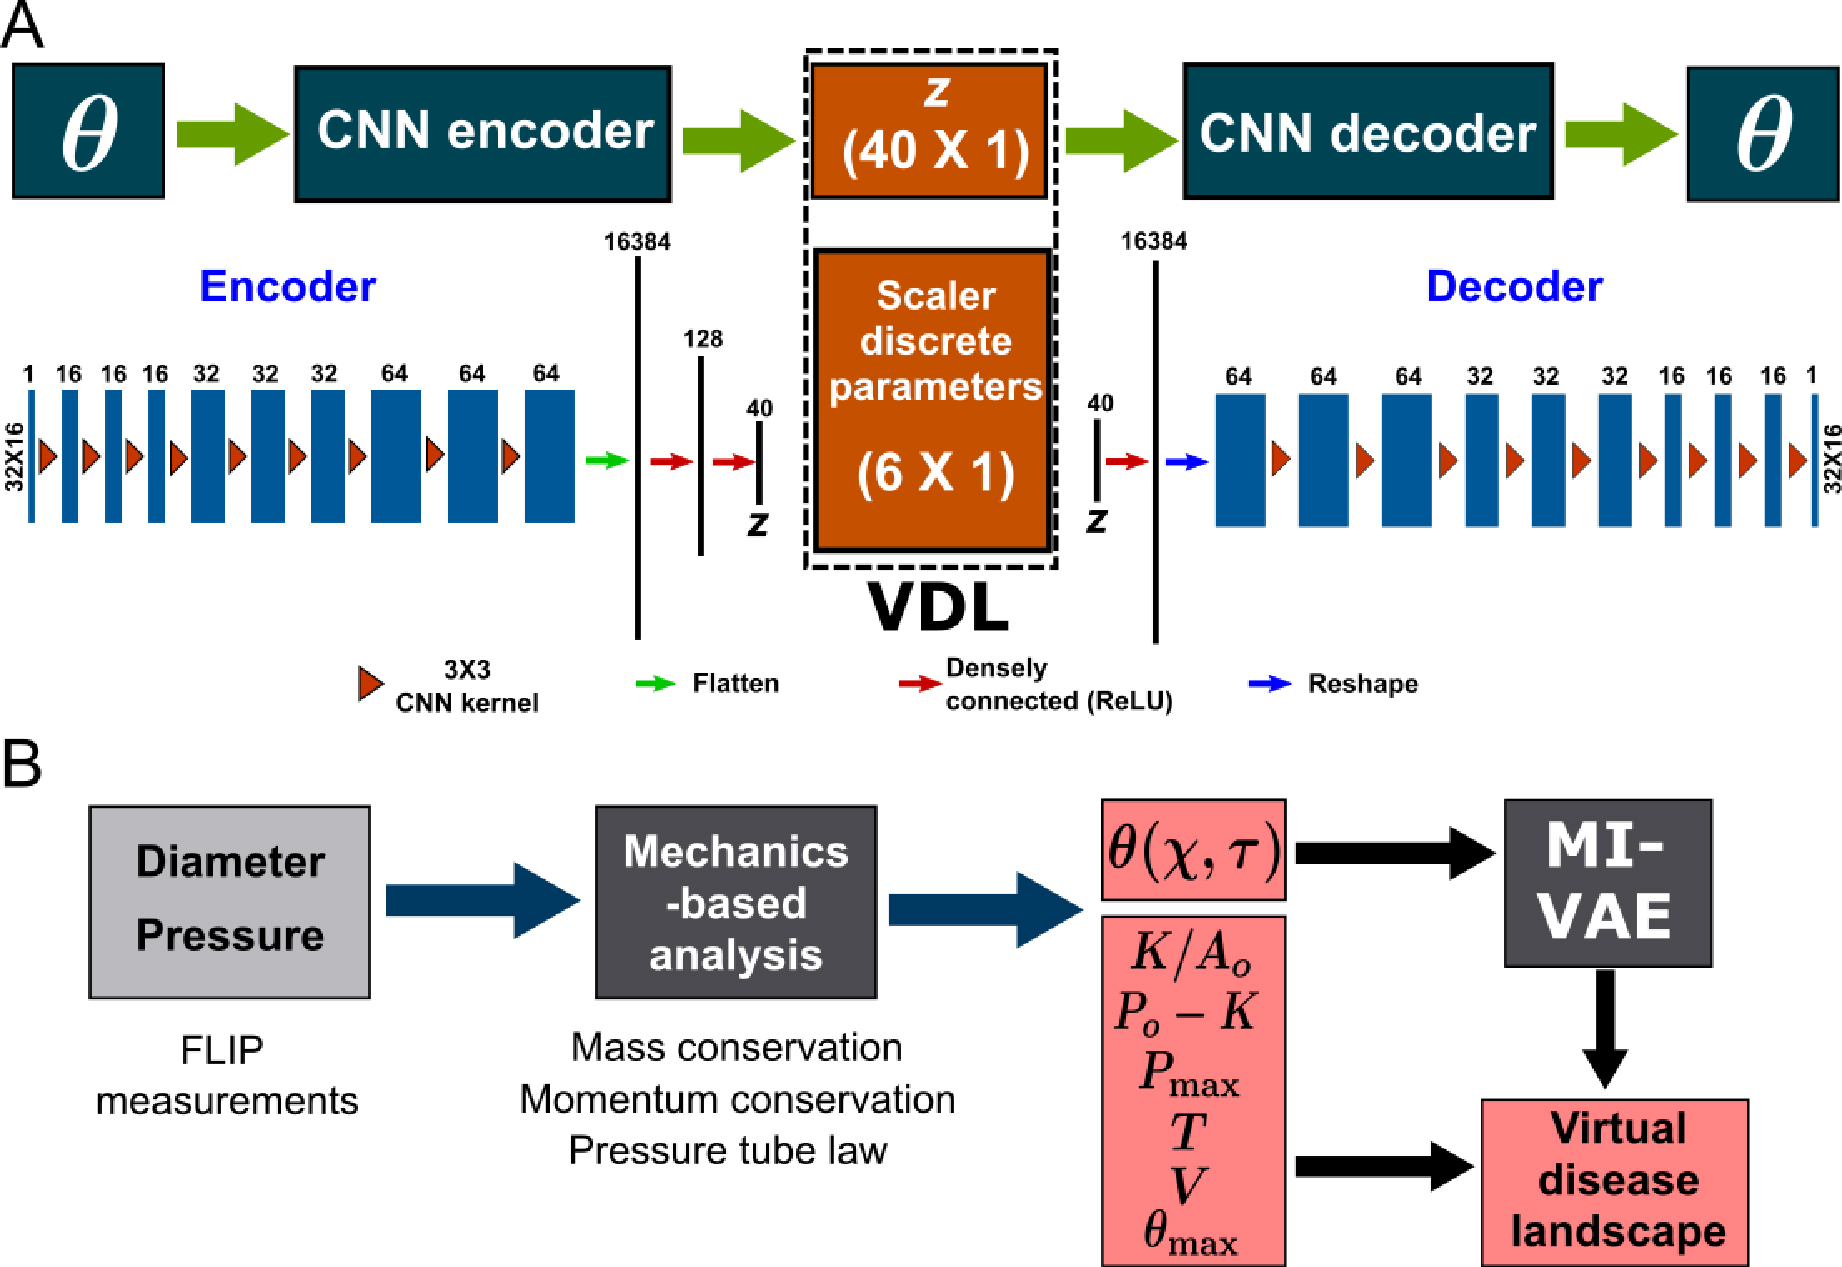
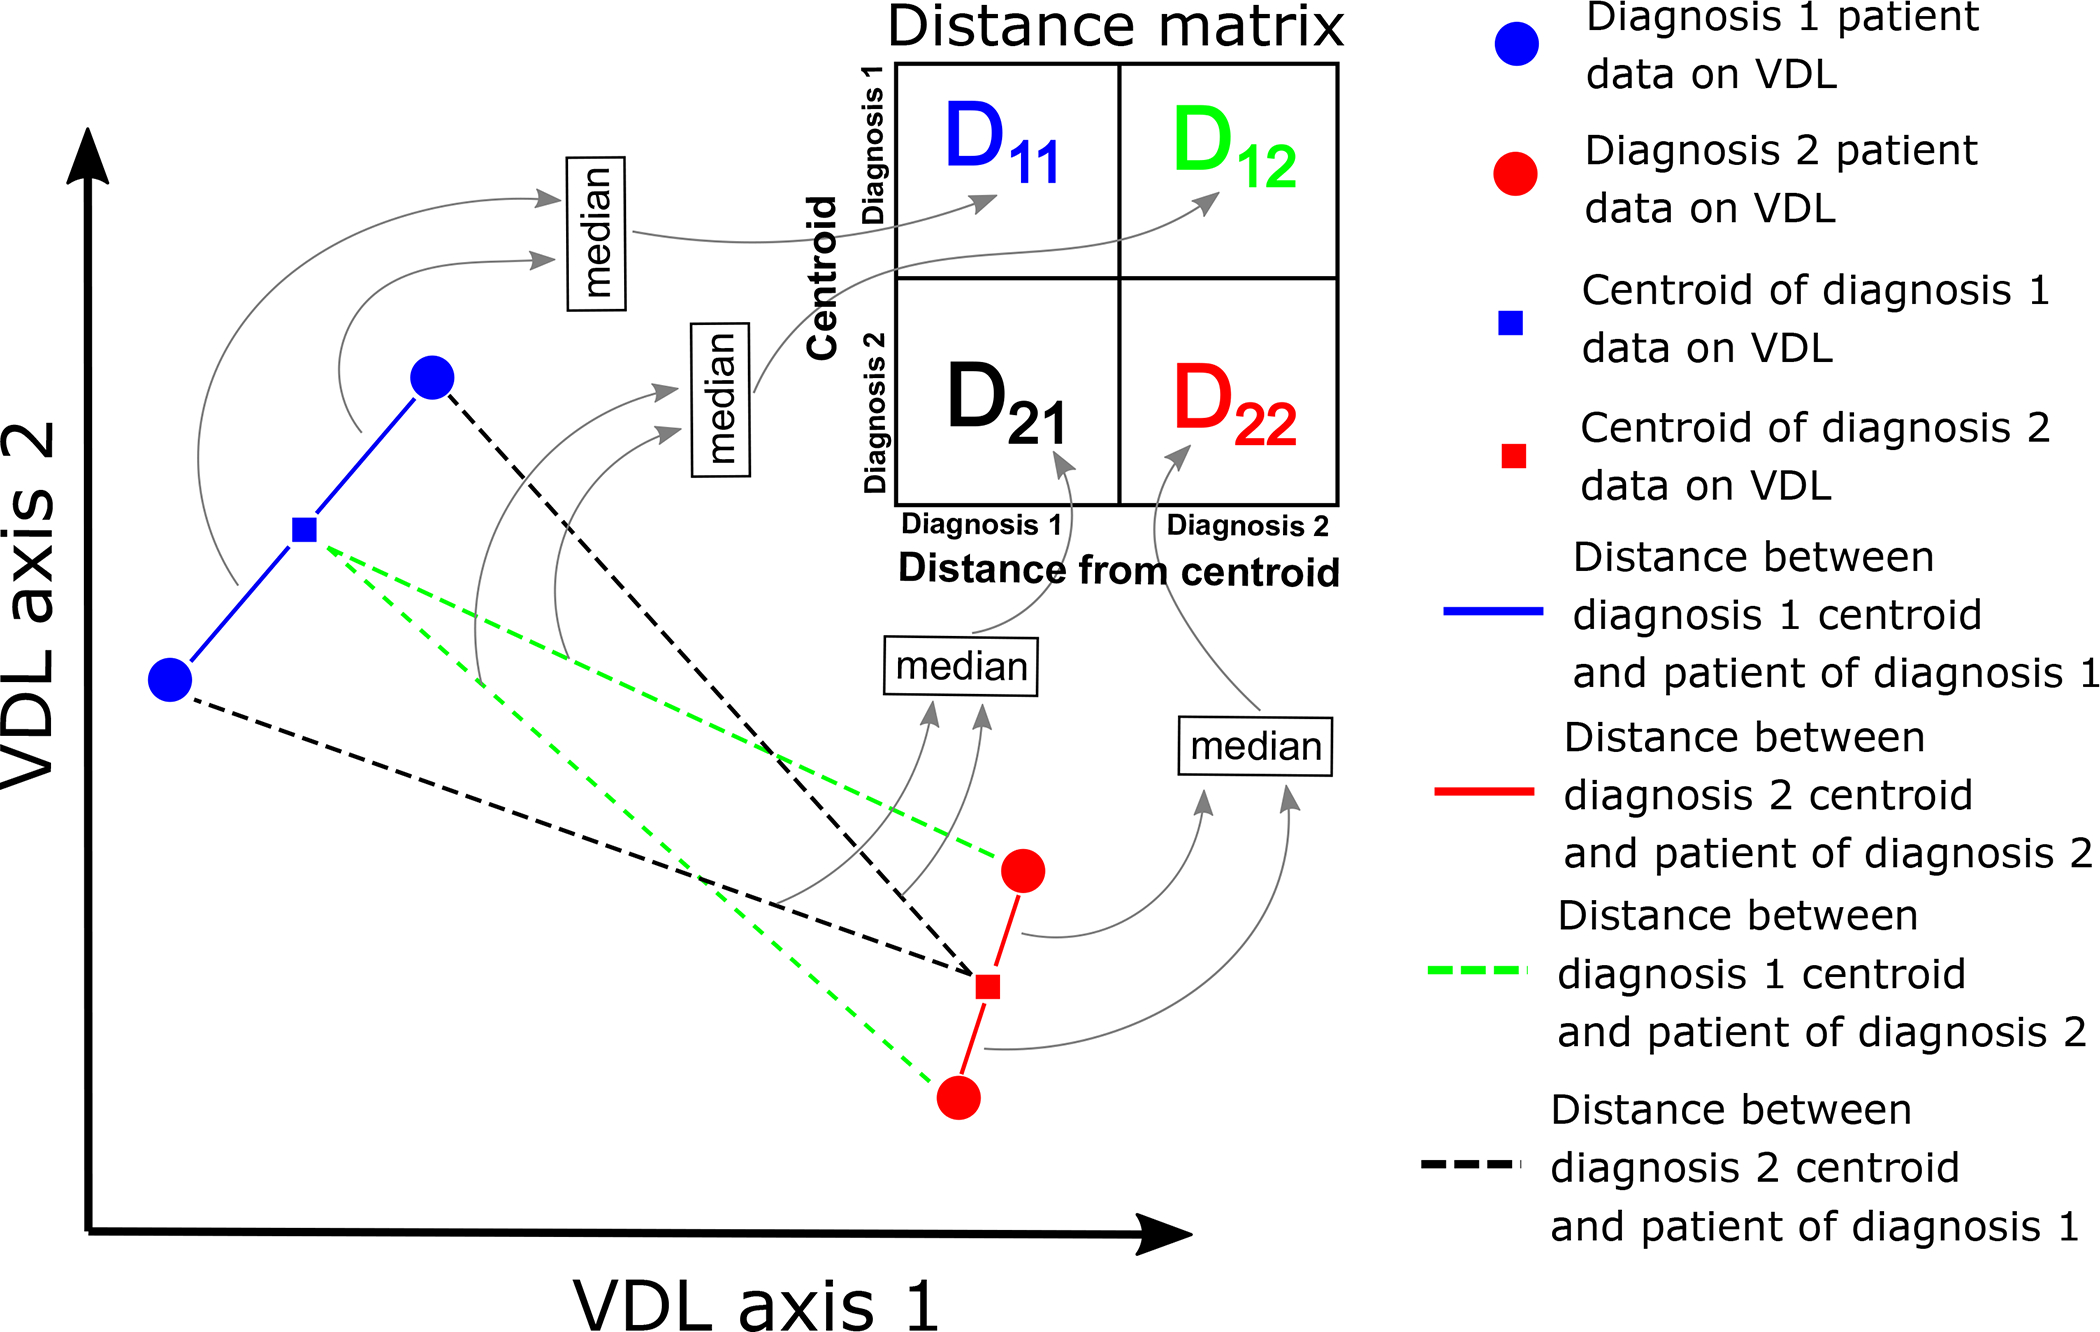
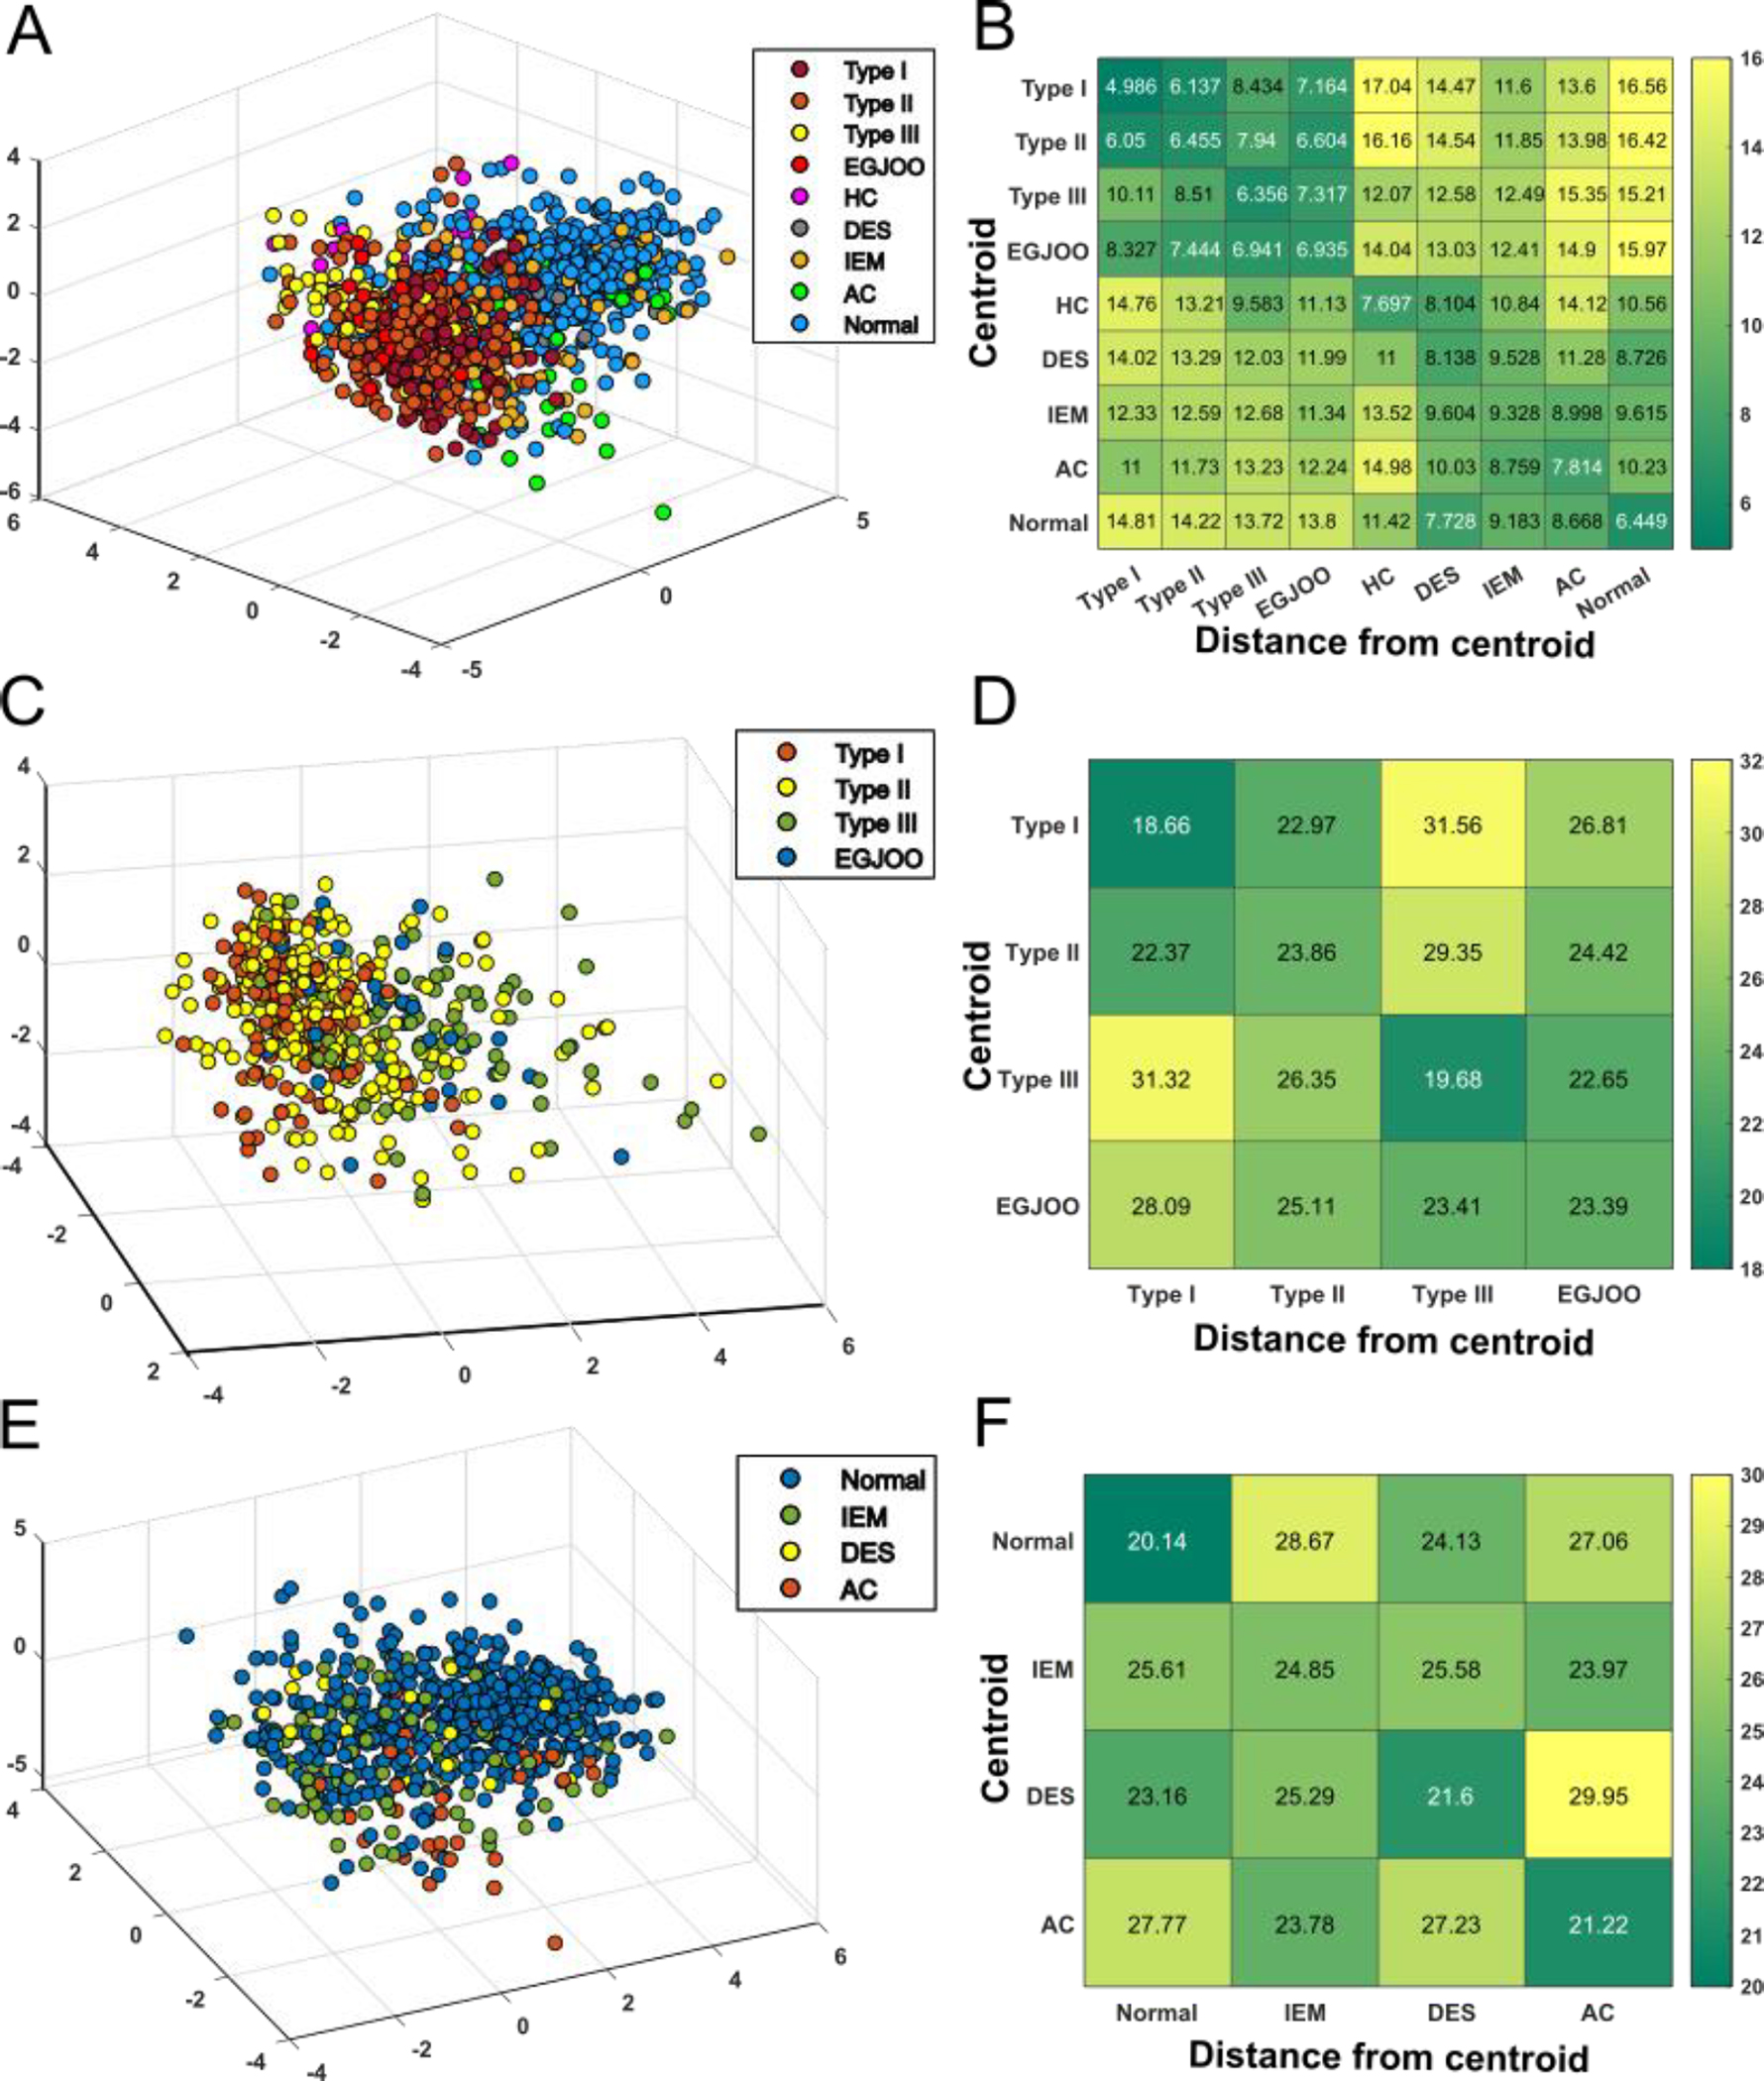
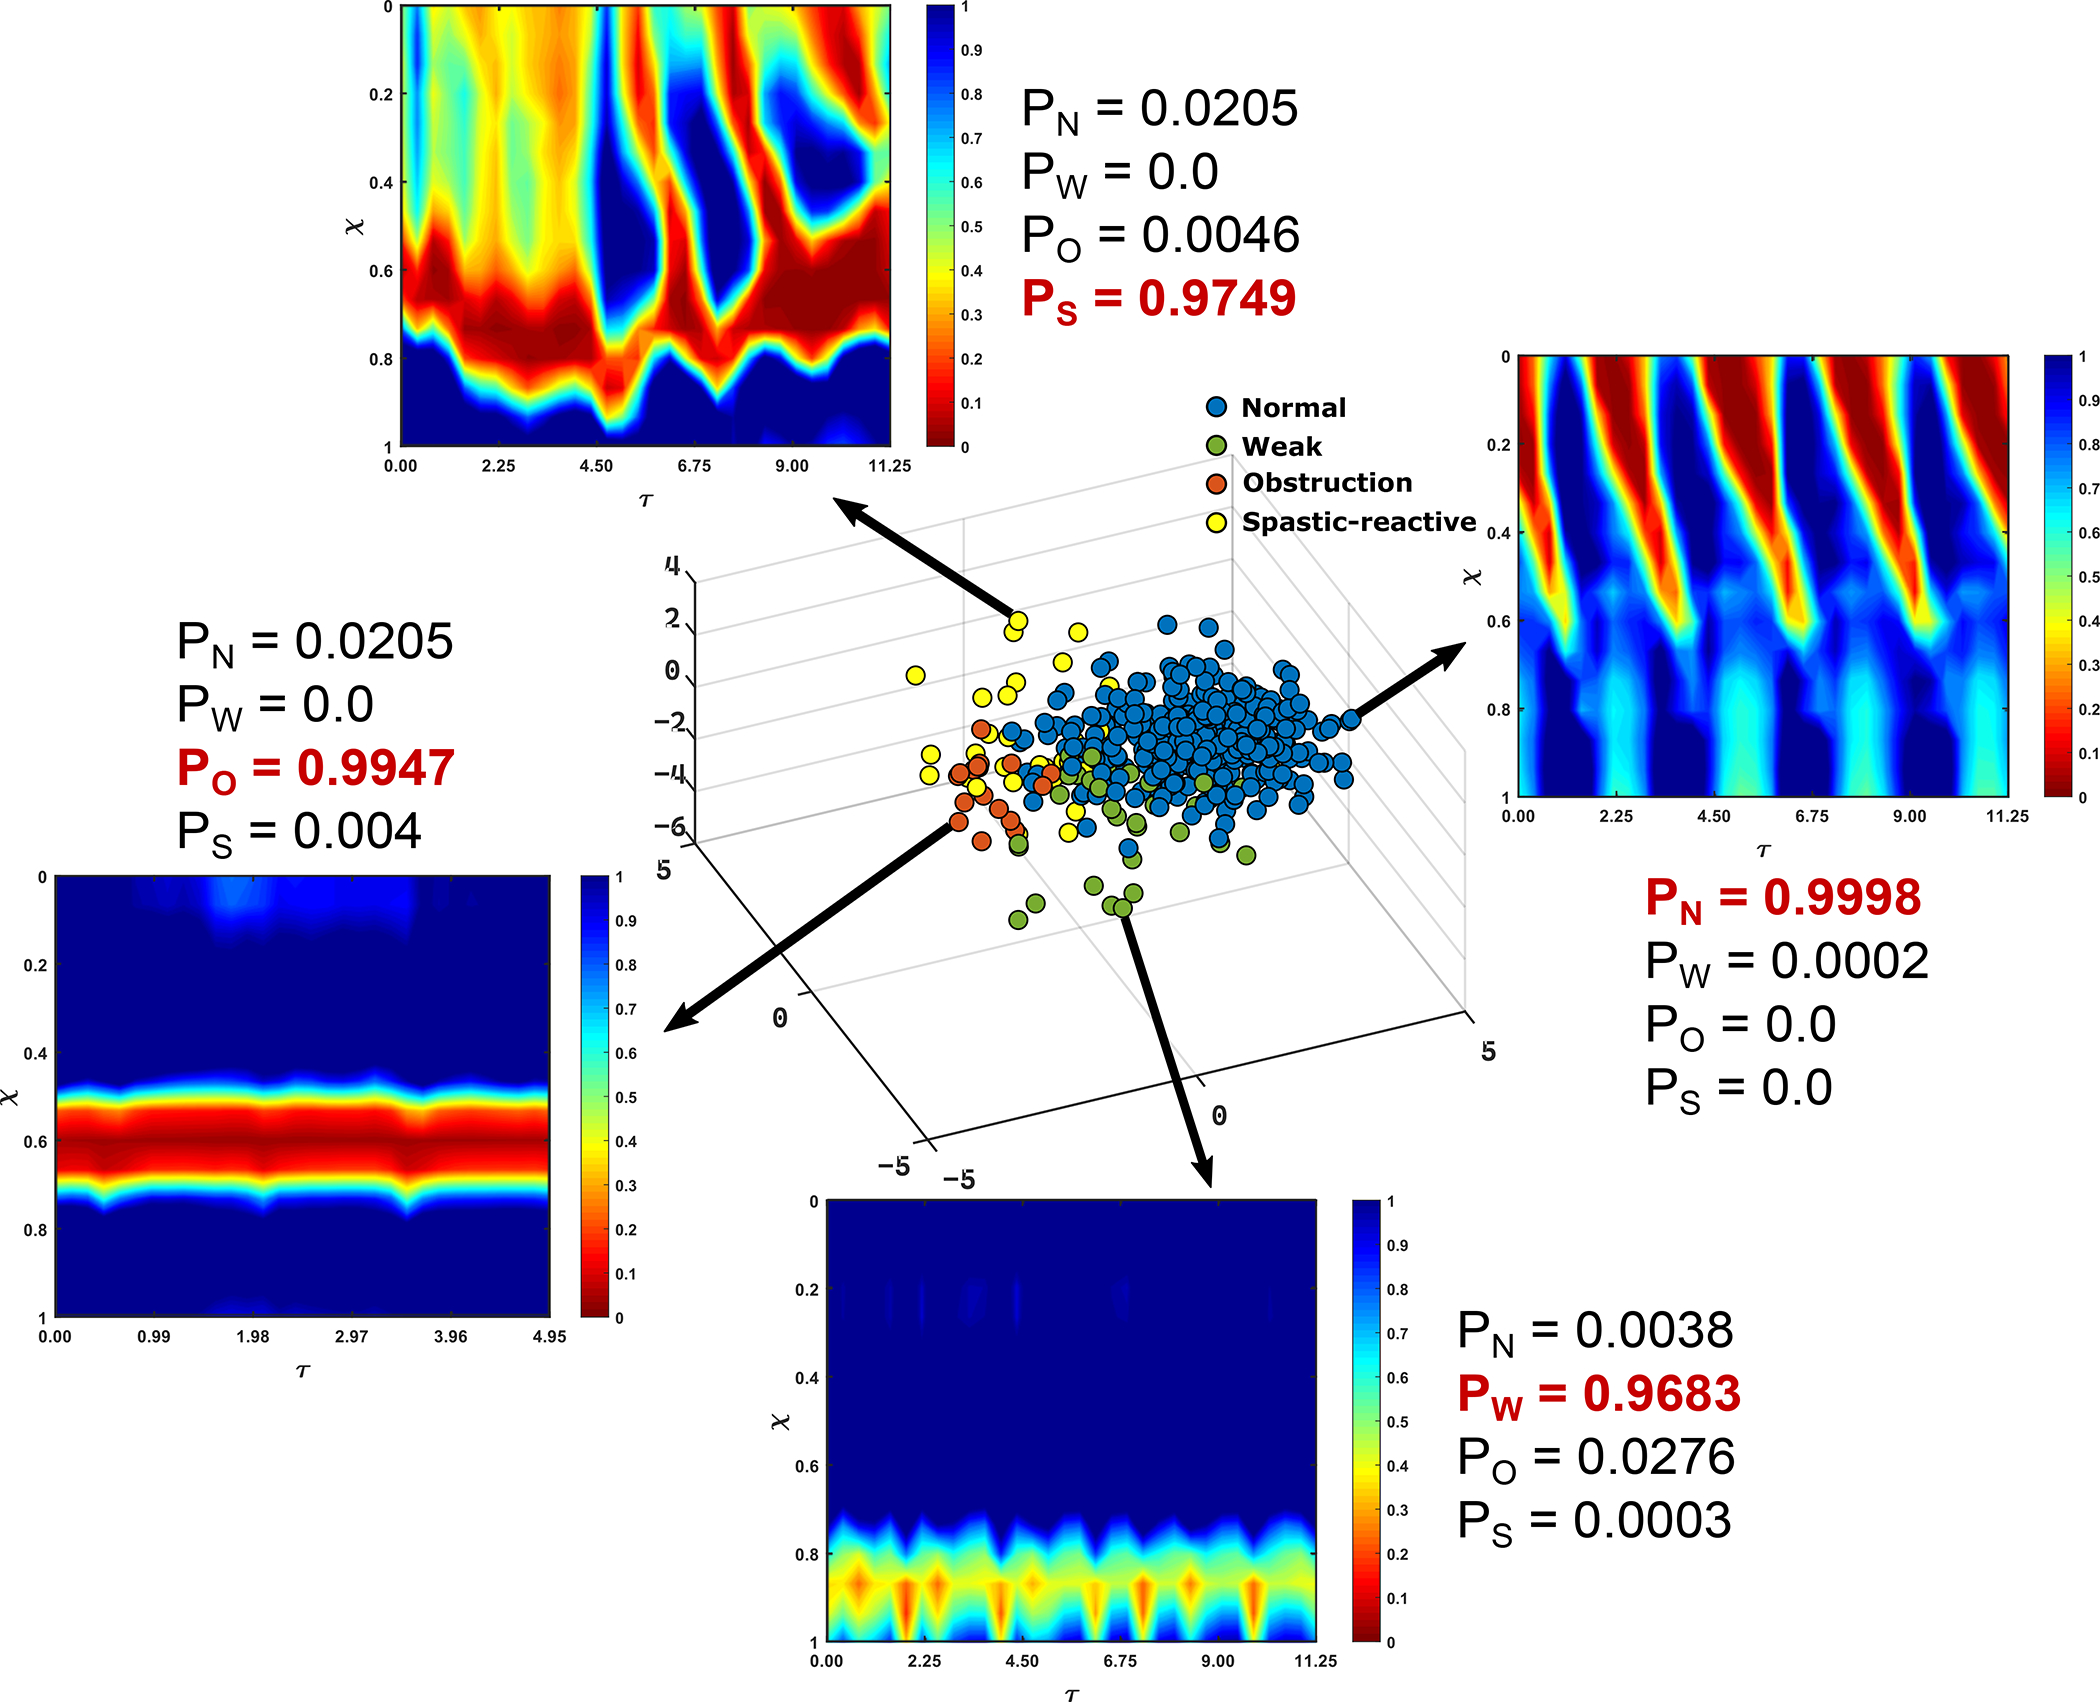
Methods: The "mechanical health" of the esophagus was analyzed in 740 subjects including a spectrum of motility disorder patients and normal subjects. The mechanical health was quantified through a set of parameters including wall stiffness, active relaxation, and contraction pattern. These parameters were used by a variational autoencoder to generate a parameter space called virtual disease landscape (VDL). Finally, probabilities were assigned to each point (subject) on the VDL through linear discriminant analysis (LDA), which in turn was used to compare with FLIP and HRM diagnoses.
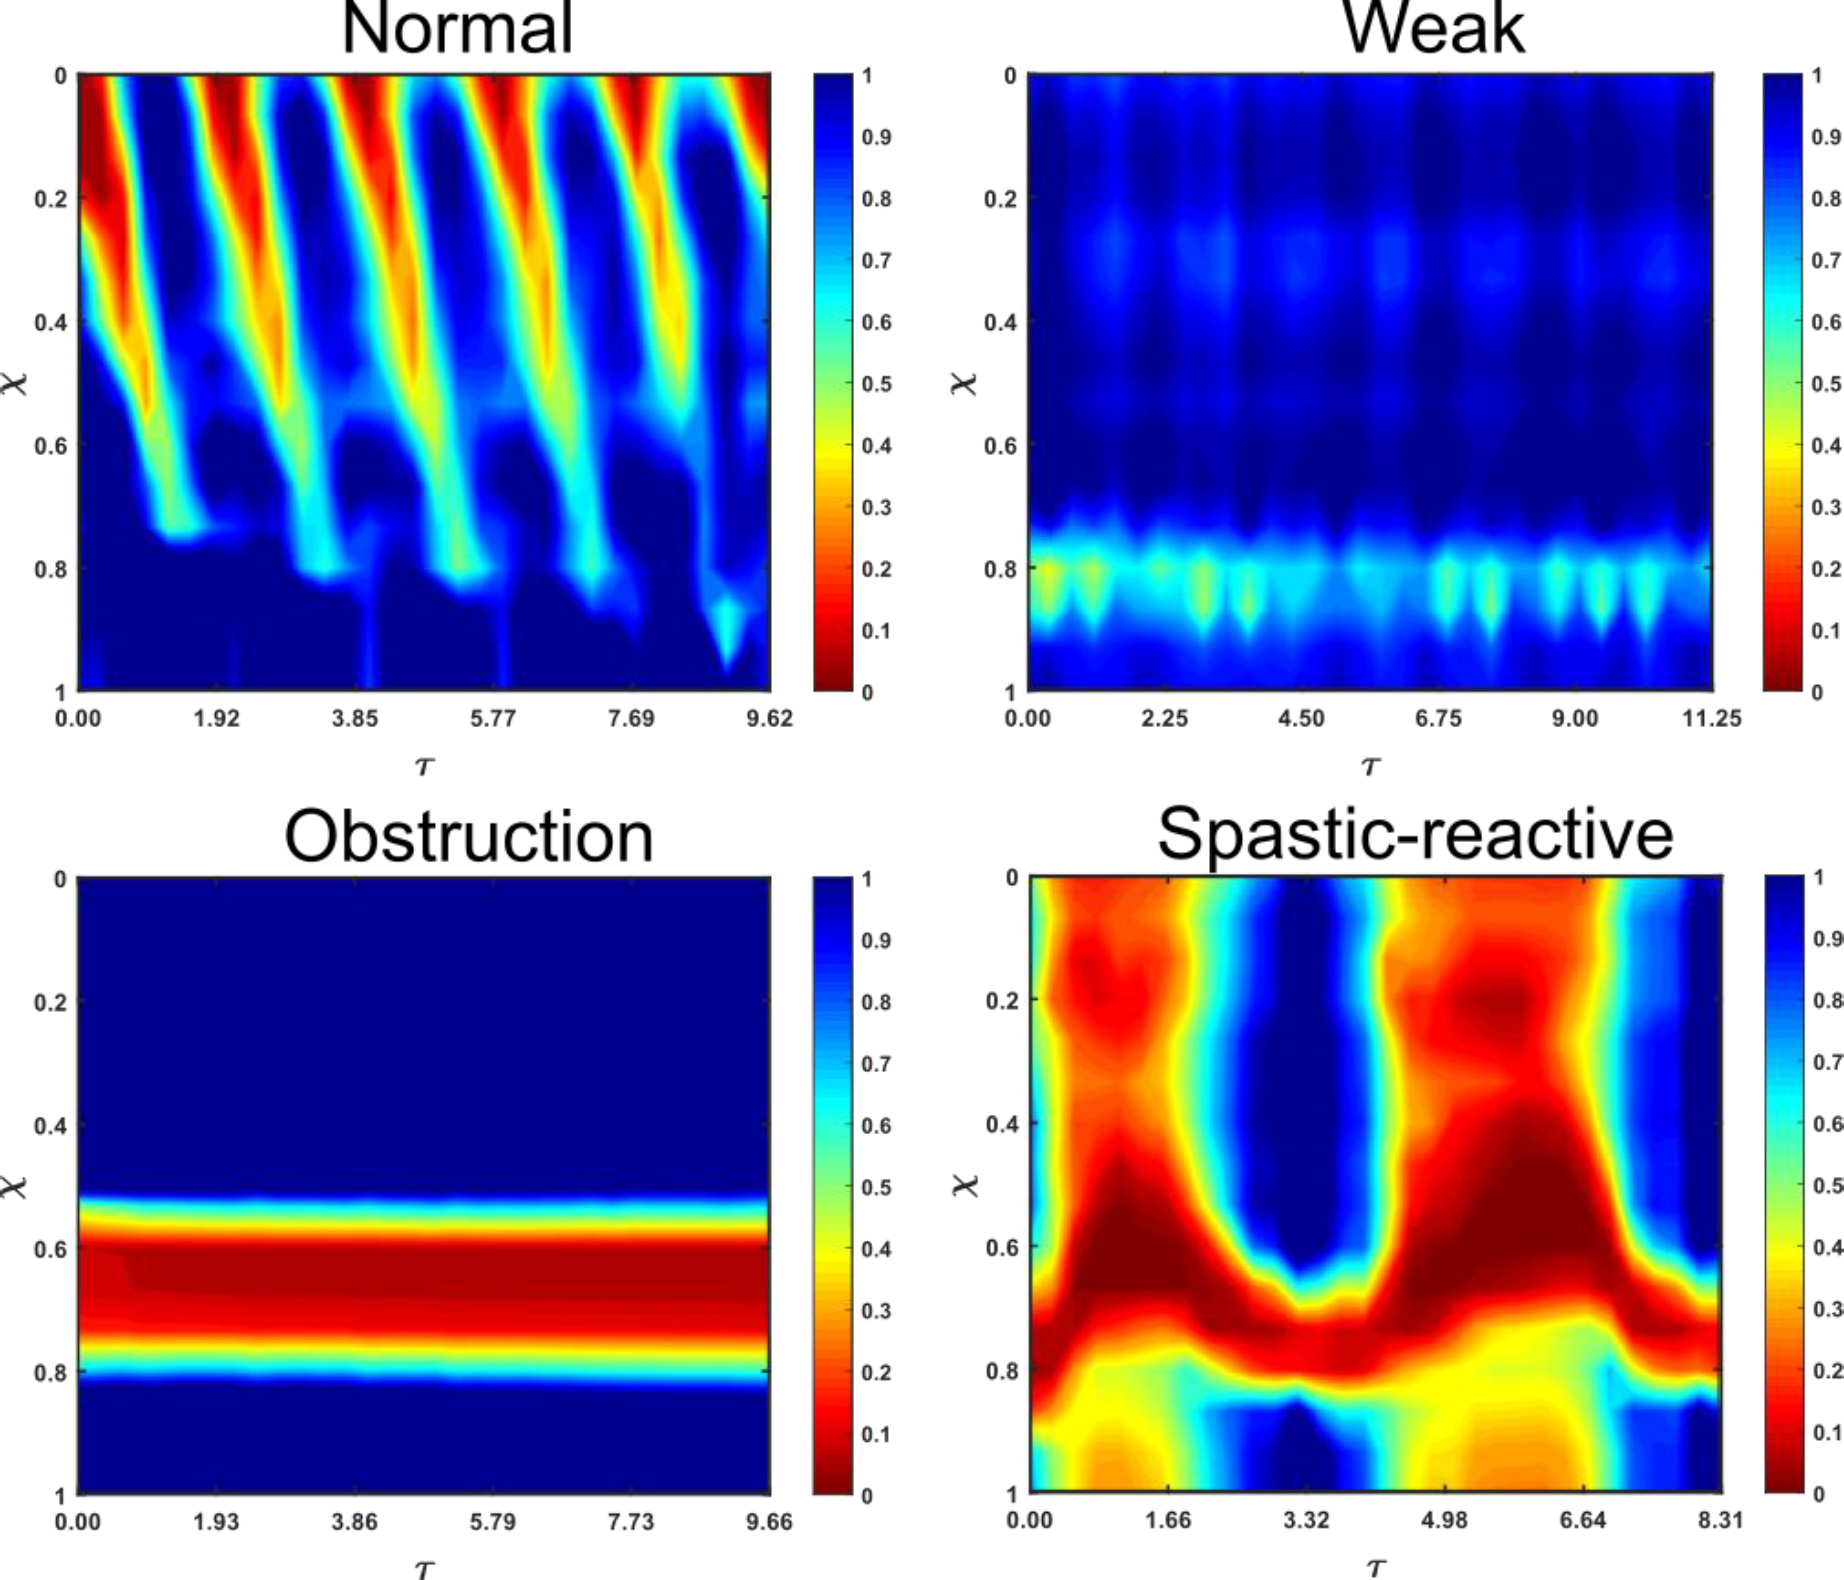
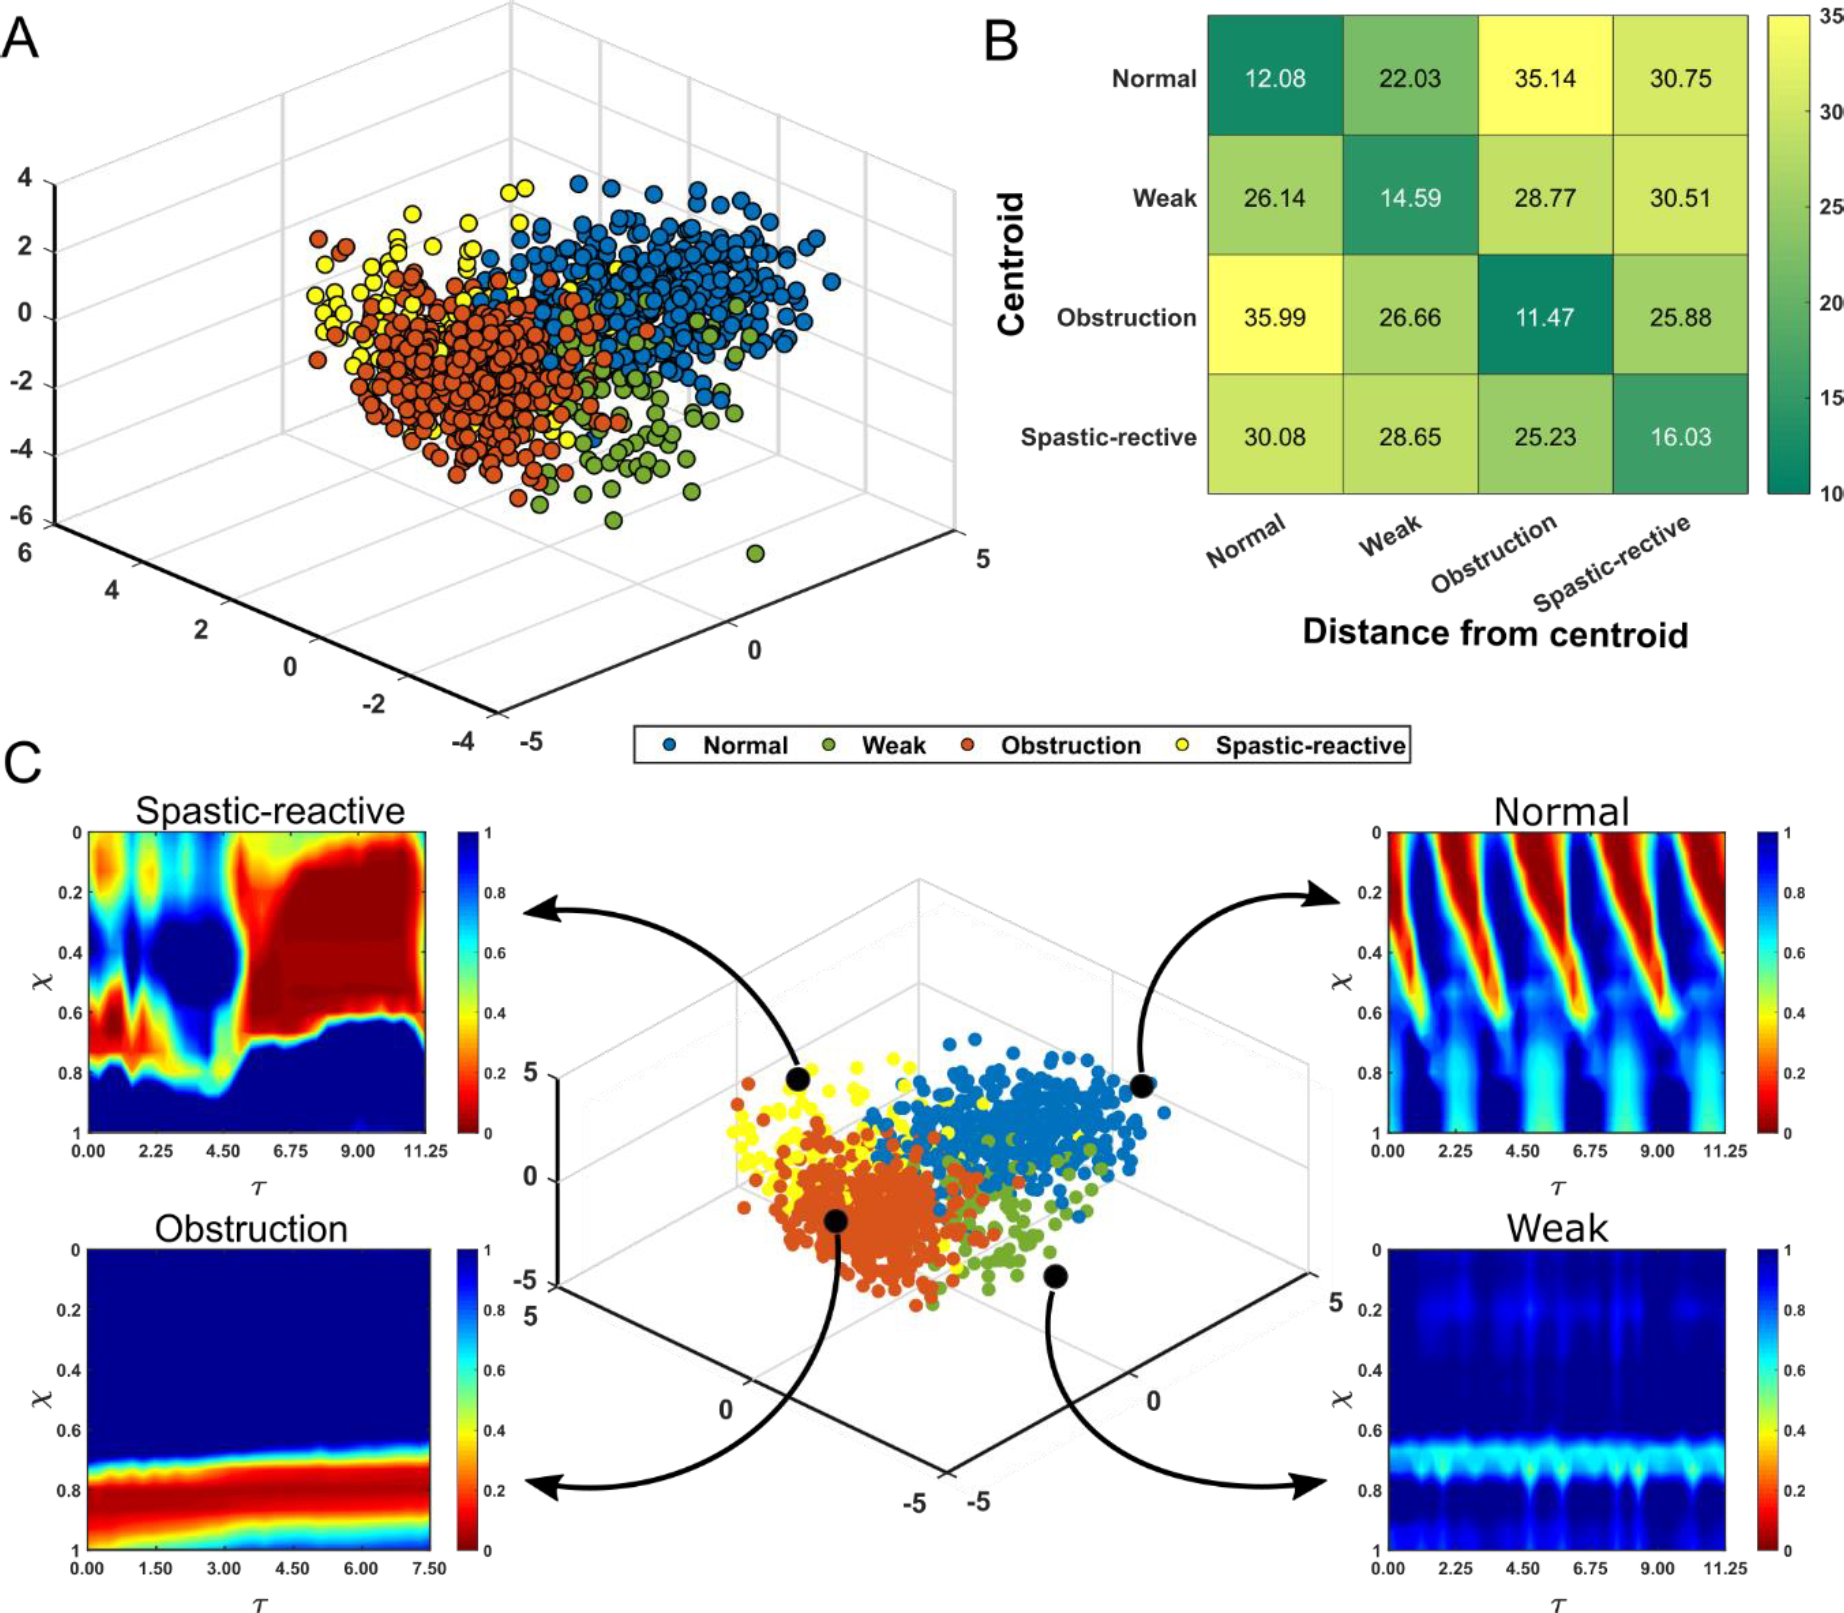
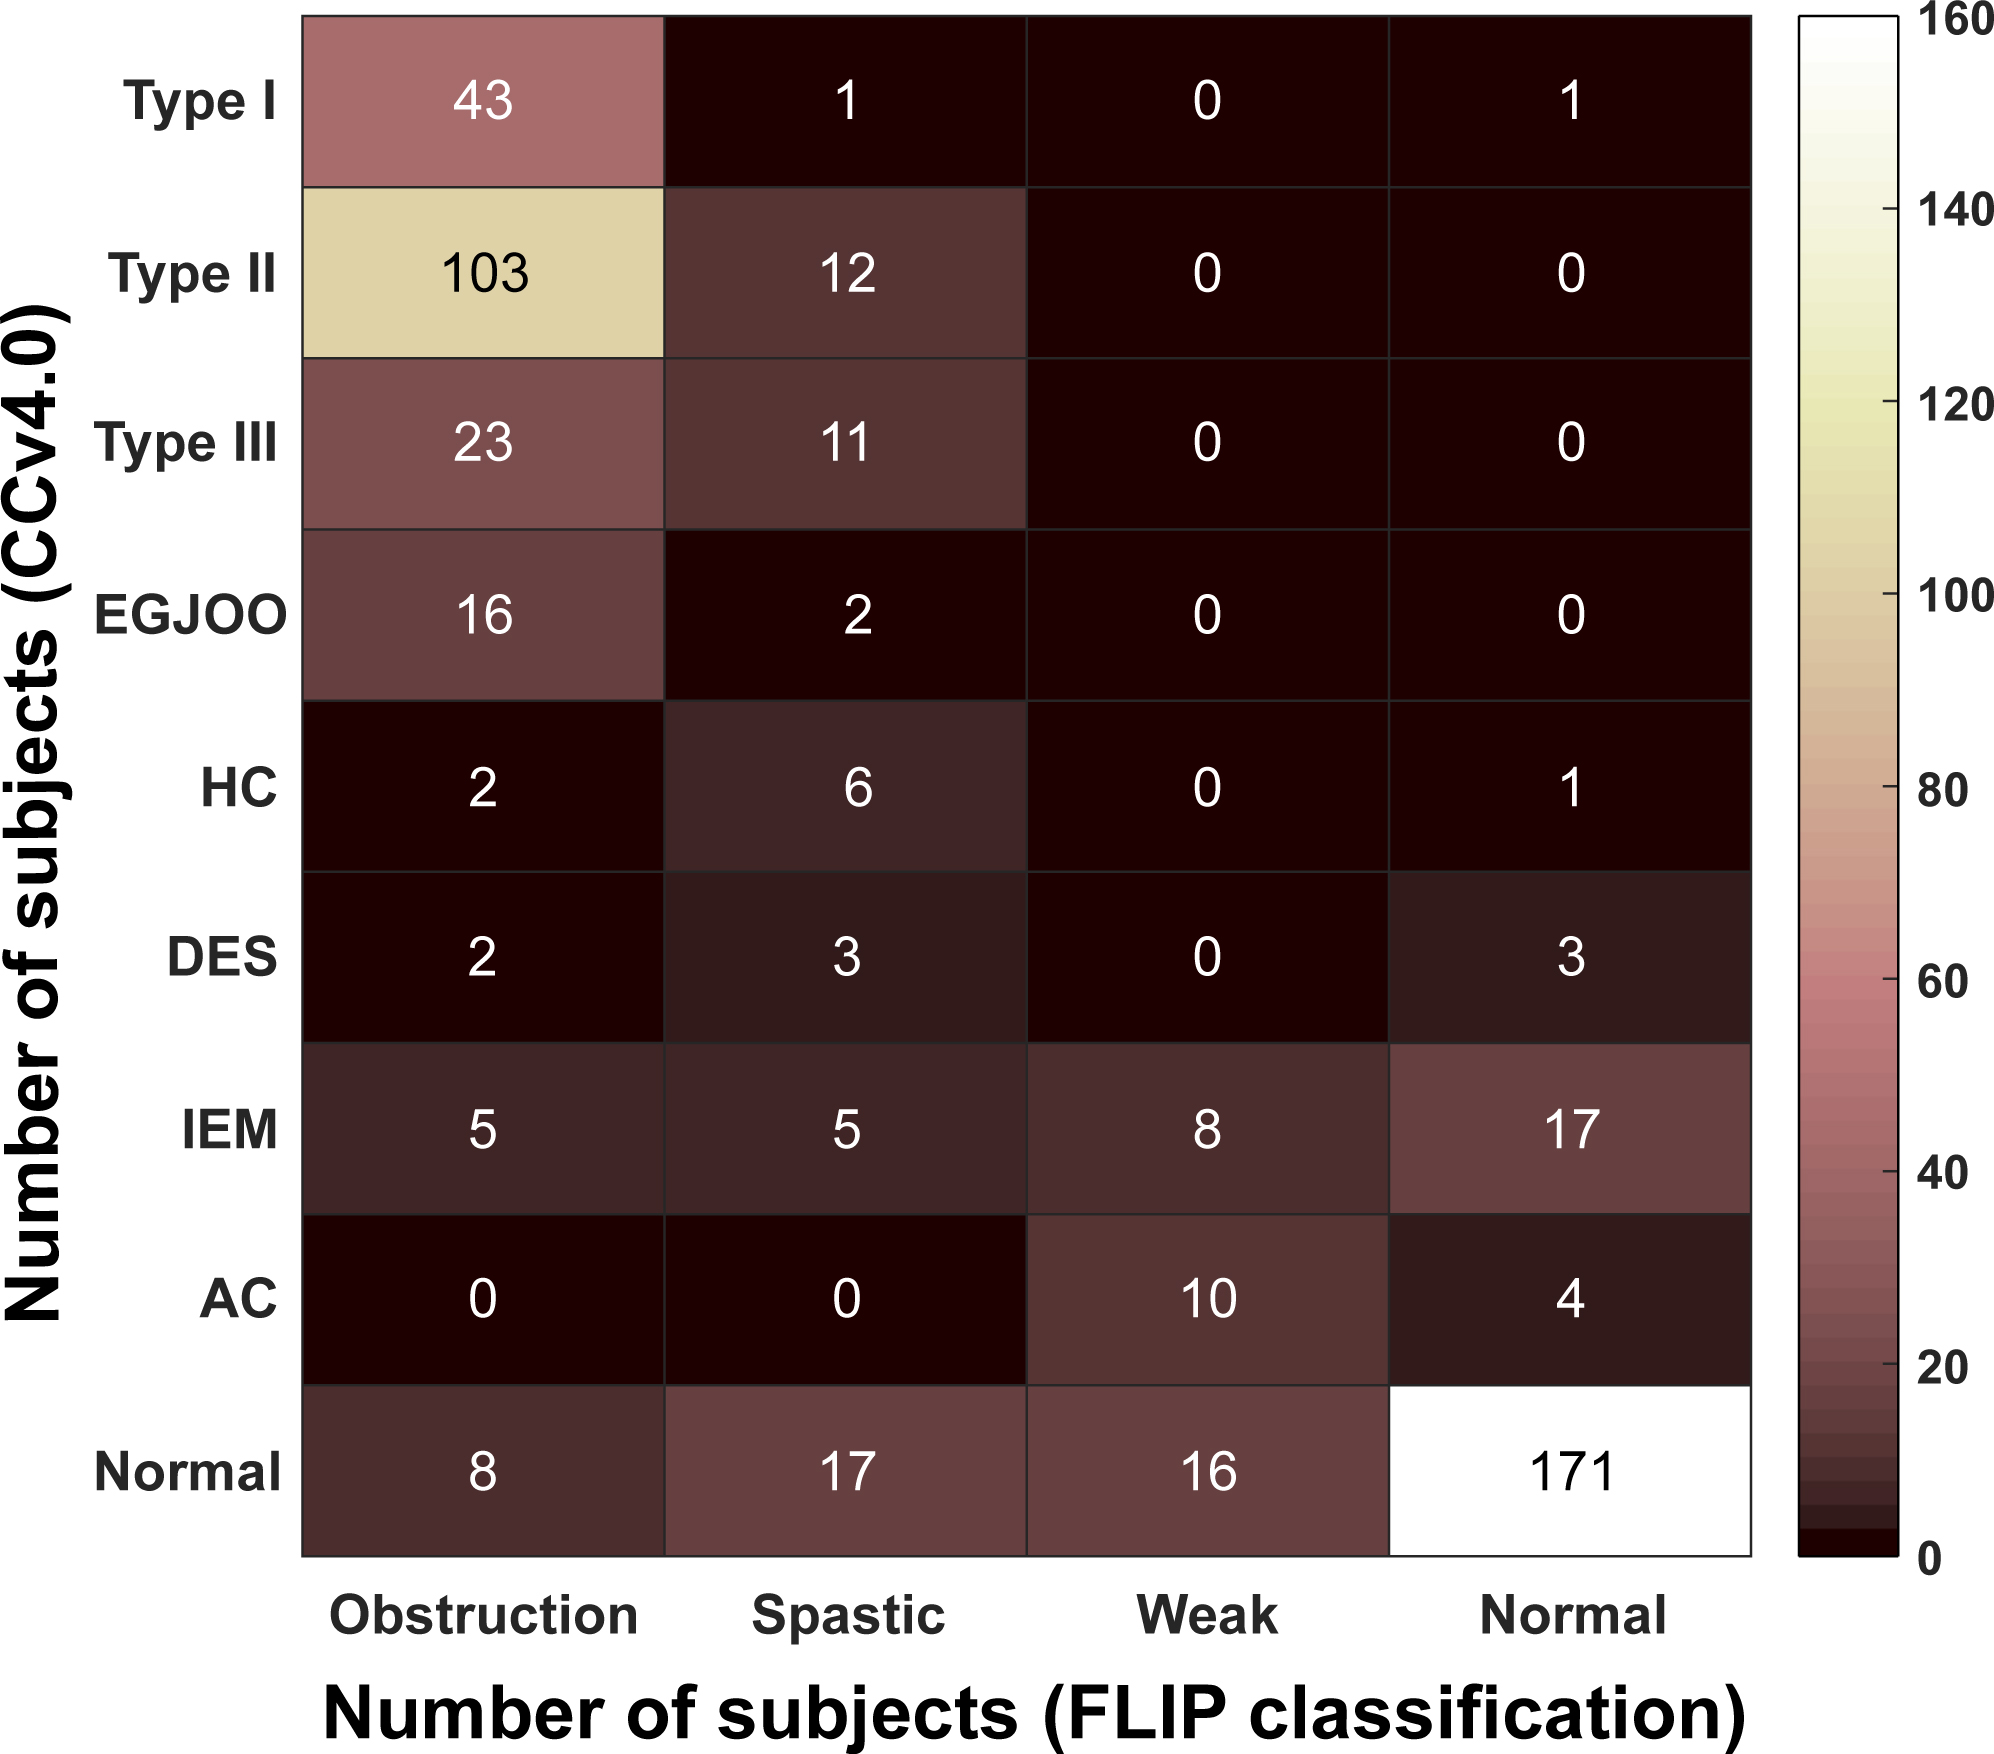
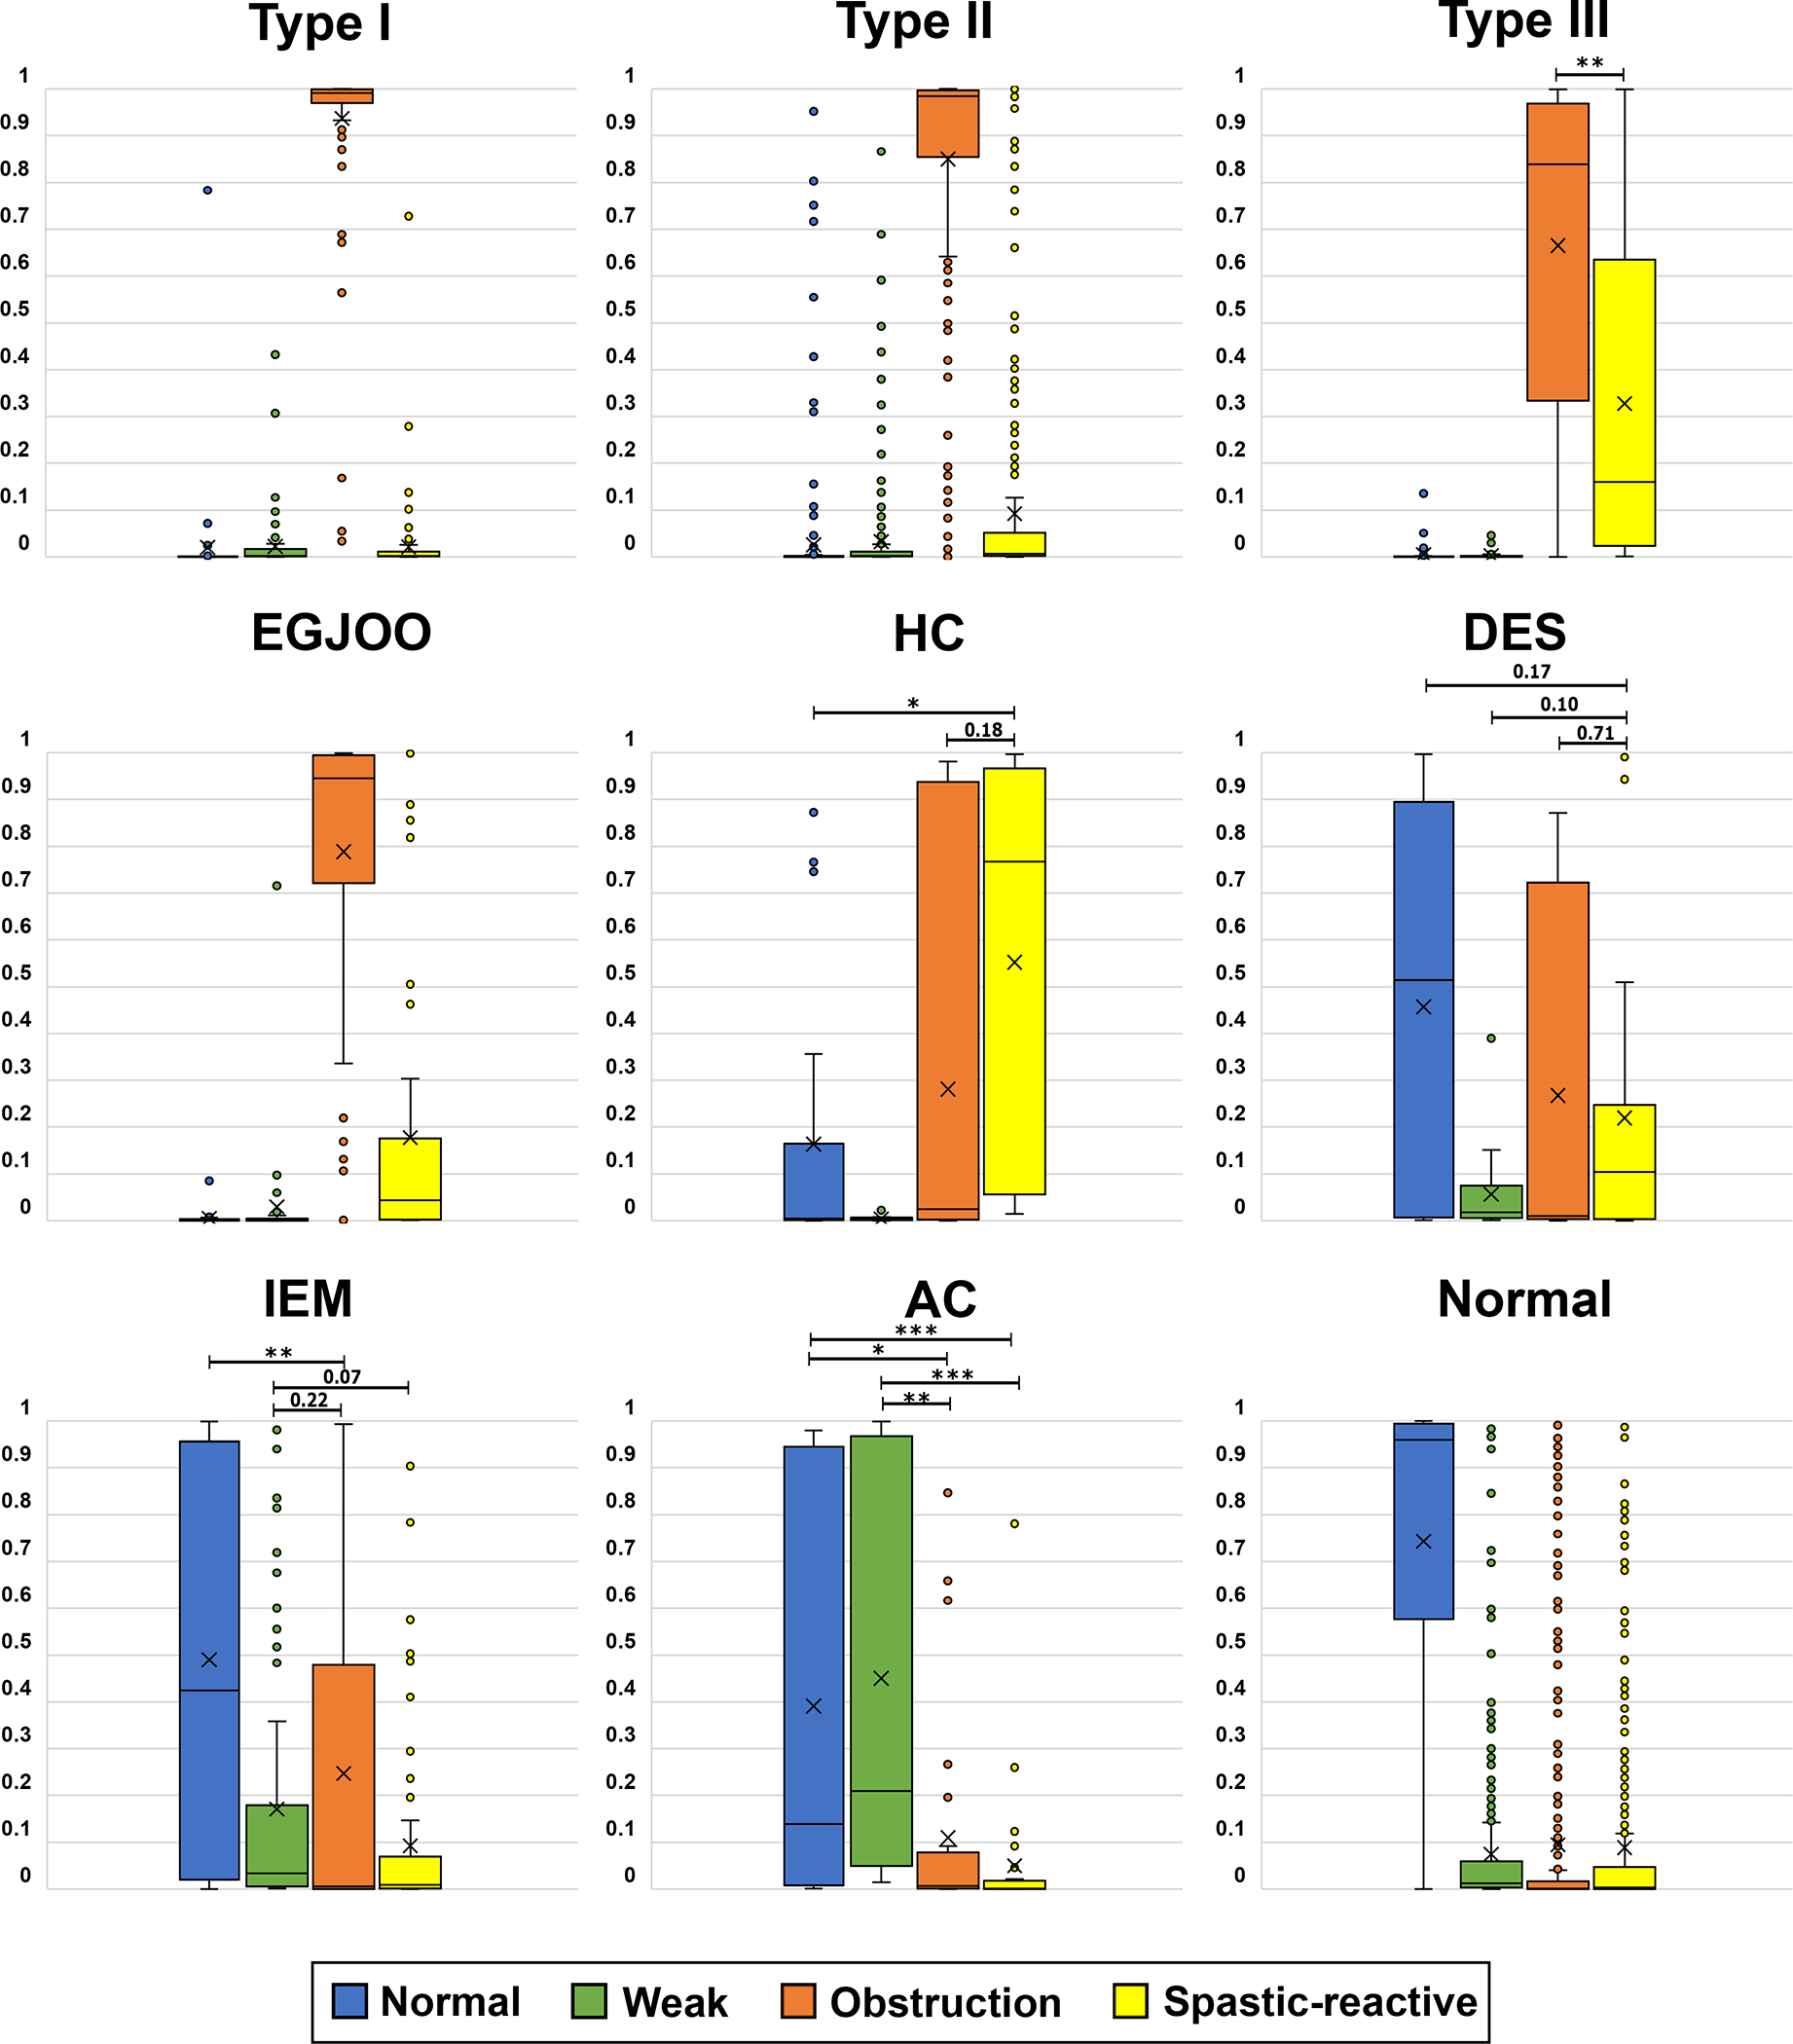
Results: Subjects clustered into different regions of the VDL with their location relative to each other (and normal) defined by the type and severity of dysfunction. The two major categories that separated best on the VDL were subjects with normal esophagogastric junction (EGJ) opening and those with EGJ obstruction. Both HRM and FLIP diagnoses correlated well within these two groups.
Conclusion: Mechanics-based parameters effectively estimated esophageal health using FLIP measurements to position subjects in a 3-D VDL that segregated subjects in good alignment with motility diagnoses gleaned from HRM and FLIP studies.
Keywords: achalasia; dysphagia; esophageal biomechanics; esophageal motility disorders; generative AI.
© 2024 The Author(s). Neurogastroenterology & Motility published by John Wiley & Sons Ltd.
Conflict of interest statement
Conflicts of Interest:
JEP: Sandhill Scientific/Diversatek (Consulting, Speaking, Grant), Takeda (Speaking), Astra Zeneca (Speaking), Medtronic (Speaking, Consulting, Patent, License), Torax (Speaking, Consulting), Ironwood (Consulting)
PJK: Ironwood (Consulting); Reckitt (Consulting), Medtronic (License)
DAC: Medtronic (Speaking, Consulting, License); Phathom Pharmaceuticals (Consulting); Braintree (Consulting); Medpace (Consulting)
Other authors have no conflicts to disclose.
Figures
Similar articles
-
Interrater Reliability of Functional Lumen Imaging Probe Panometry and High-Resolution Manometry for the Assessment of Esophageal Motility Disorders.Am J Gastroenterol. 2023 Aug 1;118(8):1334-1343. doi: 10.14309/ajg.0000000000002285. Epub 2023 Apr 11. Am J Gastroenterol. 2023. PMID: 37042784 Free PMC article.
-
Thermal compensation algorithm in ManoScan™ high resolution esophageal manometry: does it really affect manometry metrics and final diagnosis?Turk J Med Sci. 2025 Jun 2;55(3):743-753. doi: 10.55730/1300-0144.6023. eCollection 2025. Turk J Med Sci. 2025. PMID: 40686718 Free PMC article.
-
A combined endoscopy and functional lumen imaging probe panometry approach can expedite diagnosis of esophageal motility disorders.Gastrointest Endosc. 2025 Apr 8:S0016-5107(25)01506-8. doi: 10.1016/j.gie.2025.03.1329. Online ahead of print. Gastrointest Endosc. 2025. PMID: 40210016
-
When Manometry and Functional Lumen Imaging Probe Disagree: The Current Limitations of the Chicago Classification Version 4.0 and Probable Extended Indications of Functional Lumen Imaging Probe.J Neurogastroenterol Motil. 2025 Jul 30;31(3):304-312. doi: 10.5056/jnm25054. Epub 2025 Apr 18. J Neurogastroenterol Motil. 2025. PMID: 40254534 Free PMC article. Review.
-
Home treatment for mental health problems: a systematic review.Health Technol Assess. 2001;5(15):1-139. doi: 10.3310/hta5150. Health Technol Assess. 2001. PMID: 11532236
Cited by
-
A Software Framework for the Functional Lumen Imaging Probe-Mechanics (MechView).Neurogastroenterol Motil. 2025 Feb;37(2):e14981. doi: 10.1111/nmo.14981. Epub 2024 Dec 13. Neurogastroenterol Motil. 2025. PMID: 39673155 Free PMC article.
References
-
- Fox M, Hebbard G, Janiak P, et al. High-resolution manometry predicts the success of oesophageal bolus transport and identifies clinically important abnormalities not detected by conventional manometry. Neurogastroenterology & Motility 2004;16:533–542. - PubMed
-
- Fox MR, Bredenoord AJ. Oesophageal high-resolution manometry: moving from research into clinical practice. Gut 2008;57:405. - PubMed
-
- Pandolfino JE, Kim H, Ghosh SK, et al. High-Resolution Manometry of the EGJ: An Analysis of Crural Diaphragm Function in GERD. Official journal of the American College of Gastroenterology | ACG 2007;102. - PubMed
MeSH terms
Grants and funding
LinkOut - more resources
Full Text Sources
Miscellaneous
