. 2024 Sep:379:114847.
doi: 10.1016/j.expneurol.2024.114847. Epub 2024 Jun 8.

Spinal cord injury-induced metabolic impairment and steatohepatitis develops in non-obese rats and is exacerbated by premorbid obesity

Affiliations

Spinal cord injury-induced metabolic impairment and steatohepatitis develops in non-obese rats and is exacerbated by premorbid obesity

Matthew T Goodus et al. Exp Neurol. 2024 Sep.

Abstract

Impaired sensorimotor functions are prominent complications of spinal cord injury (SCI). A clinically important but less obvious consequence is development of metabolic syndrome (MetS), including increased adiposity, hyperglycemia/insulin resistance, and hyperlipidemia. MetS predisposes SCI individuals to earlier and more severe diabetes and cardiovascular disease compared to the general population, which trigger life-threatening complications (e.g., stroke, myocardial infarcts). Although each comorbidity is known to be a risk factor for diabetes and other health problems in obese individuals, their relative contribution or perceived importance in propagating systemic pathology after SCI has received less attention. This could be explained by an incomplete understanding of MetS promoted by SCI compared with that from the canonical trigger diet-induced obesity (DIO). Thus, here we compared metabolic-related outcomes after SCI in lean rats to those of uninjured rats with DIO. Surprisingly, SCI-induced MetS features were equal to or greater than those in obese uninjured rats, including insulin resistance, endotoxemia, hyperlipidemia, liver inflammation and steatosis. Considering the endemic nature of obesity, we also evaluated the effect of premorbid obesity in rats receiving SCI; the combination of DIO + SCI exacerbated MetS and liver pathology compared to either alone, suggesting that obese individuals that sustain a SCI are especially vulnerable to metabolic dysfunction. Notably, premorbid obesity also exacerbated intraspinal lesion pathology and worsened locomotor recovery after SCI. Overall, these results highlight that normal metabolic function requires intact spinal circuitry and that SCI is not just a sensory-motor disorder, but also has significant metabolic consequences.

Keywords: Cytokines; Diet-induced obesity; Insulin resistance; Kupffer cells; Locomotor recovery, alanine transferase; MASLD, metabolic dysfunction associated steatohepatitis (MASH); Metabolic syndrome; Non-alcoholic fatty liver disease; Non-alcoholic steatohepatitis (NASH).


Conflict of interest statement

Declaration of competing interest The authors declare no conflicts of interest.

Figures

Fig. 1.
Fig. 1.. Energy intake, body weight and liver mass in the 4 different groups.
(A) Caloric intake over time for each group. Comparison of group means over time revealed significant differences between pre-injury groups (n = 16/group), between SCI and DIO + SCI (n = 10/group), and between naïve rats in the low fat (LF) and high fat (DIO) uninjured groups (n = 6/group). (B) Rats on the high fat diet (DIO) had significantly greater mass on the day of SCI compared to rats on the control diet (n = 16/group). (C) Area under body weight curves over time showed increased body mass in DIO naïve and DIO + SCI rats compared to LF diet naïve and SCI rats. n = 6 Naïve, DIO; n = 10 SCI, DIO + SCI. (D) Liver mass at study end was increased similarly in obese naïve (DIO), lean SCI and obese SCI rats compared to uninjured controls. n = 6/group Naïve, DIO; n = 10/group SCI, DIO + SCI. Error bars represent ±SEM. Mean energy intake over time, body weight area under the curve (AUC) and liver mass analyzed with two-way ANOVA and Bonferroni stepdown post-hoc test. Body weight on day of SCI analyzed by t-test. *p < .05, **p < .01 and ***p < .001. Asterisks directly over bars represent comparison with Control (C) or Naïve groups (B,D). Asterisks over lines indicate significant differences in post-hoc comparisons between the groups spanned by the lines.
Fig. 2.
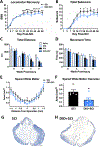
Fig. 2.. Obese SCI rats have impaired locomotor recovery and reduced intraspinal white matter tissue sparing after injury compared to lean SCI rats.
(A) Hindlimb locomotor function assessed with the BBB scale was significantly lower overall in DIO + SCI rats than lean SCI rats (p < .001 nonlinear mixed effect model), with significantly lower scores at 21 – 56d post-injury. n = 10/group (B) Overall BBB subscores assessing fine aspects of locomotion were also significantly reduced in DIO + SCI compared to lean SCI rats (overall p = .0065). (C,D) Open field activity box measurements showed no differences between groups, including comparable distances traveled and total time moving before or after SCI. (E,F) Quantification of spinal cord white matter in the rostral-caudal extent of the spinal cord at 8w post-injury showed significant reduction in white matter spared at the epicenter (p < .05). n = 5–6 values per group due to missing or folded tissue sections. (G,H) Representative images of epicenter cross-sections at 8w post-injury. Myelin is stained blue with eriochrome cyanine. Scale bar = 100 μm for G,H. A,B,E analyzed with non-linear mixed effect modeling. F analyzed by t-test. * p < .05, ** p < .01, *** p < .001 between groups.
Fig. 3.
Fig. 3.. SCI and obesity induce comparable expression of several hepatic inflammatory mediators.
(A-E) SCI in lean rats increased hepatic mRNA for CD11b, CD68, TNF, IL-1α and IL-1β compared to naïve lean rats. HF diet-induced obesity (DIO) also significantly increased mRNA for these molecules. The combination drove mRNA for CD11b, CD68, and TNF to significantly greater levels than either alone; DIO + SCI also increased IL-1β mRNA compared to DIO alone. (F) DIO and DIO + SCI had significantly increased IL-6 mRNA compared to Naïve or SCI alone. DIO + SCI also had significantly increased IL-6 over DIO alone suggesting SCI potentiated the DIO effect. *p < .05, **p < .01 and ***p < .001 via two-way ANOVA and Bonferroni stepdown post-hoc test to compare all groups. Asterisks above bars represent comparison to Naïve. Asterisks over lines are for post-hoc comparisons between groups spanned by the lines. Error bars represent mean + SEM. n = 6/group Naïve, SCI; n = 10/group DIO, DIO + SCI.
Fig. 4.
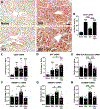
Fig. 4.. Kupffer cells, neutrophils, and T cells in livers from rats with SCI and/or diet-induced obesity (DIO).
(A) Representative images of liver sections immunolabeled for Clec4f+ Kupffer cells from each group. (B) Quantification of Clec4f area shows significantly increased liver macrophage labeling in DIO and SCI compared to naïve. In DIO + SCI group, Kupffer cells were significantly greater than in naïve, SCI and DIO livers. (C) CD3+ T cells in livers from the different groups. (D) Counts of T cells within liver showed a significant increase in DIO alone and DIO + SCI versus naïve and SCI alone. (E) Representative images of MPO immunolabel for neutrophils in the different groups. (F) MPO+ neutrophils were significantly increased in DIO naïve and DIO + SCI livers compared to naïve. Neutrophils in DIO + SCI livers were also significantly greater than in livers from SCI alone. *p < .05, **p < .01 and ***p < .001 via two-way ANOVA and Bonferroni stepdown post-hoc test to compare all groups. Asterisks above bars represent comparison to Naïve. Asterisks over lines represent post-hoc comparisons between groups spanned by the lines. Error bars represent +SEM. Scale bar = 100 μm for A, 10 μm for C and E. B,D,F: n = 3 naïve and DIO; n = 6 SCI, DIO + SCI.
Fig. 5.
Fig. 5.. Hepatic lipids and lipid-related molecule mRNA expression in livers from SCI and/or obese rats at 8wpi.
(A) Representative images of Oil Red O in liver sections at 56dpi showing increased lipids in SCI, diet-induced obese (DIO) naïve and DIO + SCI rats compared to lean naïve rat livers. (B) Quantification of Oil Red O area shows a significant increase SCI, DIO naïve and DIO + SCI livers compared to naïve livers. Lipid accumulation in DIO and DIO + SCI was also significantly greater than SCI. (C) mRNA expression of the lipid uptake transporter CD36 was significantly and comparably increased in all groups compared to naïve. (D) SCI, DIO and DIO + SCI all had significantly increased hepatic serine palmitoyltransferase (SPT) mRNA compared to control. SPT mRNA in DIO + SCI livers was significantly greater than DIO but not SCI alone. (E) HMG-CoA reductase mRNA was significantly increased in the SCI group compared to all other groups. (FH) mRNA for SREBP-1c, SREBP-2, and ChREBP, transcription factors related to lipogenic pathways, was significantly greater in SCI livers compared to DIO, SIO + SCI and naïve tissue. DIO alone did not change any TF factor expression. When obesity was present before SCI (DIO + SCI), the SCI-induced upregulation was absent. Further, mRNA for SREBP-2 was suppressed to levels lower than baseline in the DIO + SCI group. *p < .05, **p < .01 and ***p < .001 via two-way ANOVA and Bonferroni stepdown post-hoc test to compare all groups. Asterisks above bars represent comparison to Naïve. Asterisks over lines represent post-hoc comparisons between groups spanned by the lines. Error bars represent mean + SEM. Scale bar = 100 μm. B: n = 3 naïve, DIO; n = 6 SCI, DIO + SCI; C-H: n = 6 naïve, DIO, n = 10 SCI, DIO + SCI.
Fig. 6.
Fig. 6.. SCI increases hepatic iron, which is not present when SCI occurred on a background of obesity.
(A) Representative images of non-heme iron in livers visualized with Perls stain. (B) Quantification of stained area showing non-heme iron is significantly increased in SCI livers compared to naïve controls, obese naïve and obese SCI rats, both of which were not different from controls. (C) Representative images of H-ferritin immunolabeling from each group. (D) Quantification of area of H-ferritin shows a significant increase in livers from SCI and DIO rats compared to naive controls and DIO + SCI groups. *p < .05, **p < .01 and ***p < .001 via two-way ANOVA and Bonferroni stepdown post-hoc test. Asterisks above bars represent comparison to Naïve. Asterisks over lines represent post-hoc comparisons between groups spanned by the lines. n = 3 naïve, DIO; n = 6 SCI, DIO + SCI. Error bars represent mean + SEM. Scale bar = 100 μm.
Fig. 7.
Fig. 7.. SCI causes liver damage and endotoxemia comparable to obesity, which are further increased by the combination of SCI and obesity.
(A) SCI, DIO and DIO + SCI all significant increase circulating ALT levels; ALT was also significantly higher in DIO + SCI versus either alone starting at 4w post-injury and thereafter (* vs. Naïve, + vs. SCI, ^ vs. DIO; all significance levels (p < .050.001 indicated by single symbol). (B) Circulating endotoxin was increased in DIO, SCI and DIO + SCI compared to naïve, and DIO + SCI endotoxin levels were significantly higher than in DIO or SCI at several times post-injury (significance indicators same as A). (C) Compared to naïve controls, serum fetuin-A protein at study end was significantly increased in SCI, DIO, and DIO + SCI groups. DIO + SCI serum had significantly greater circulating fetuin-A compared to DIO or SCI alone. (D) iNOS mRNA was comparably increased in all three groups compared to naïve levels. DIO + SCI livers had greater iNOS mRNA than in SCI alone. (E) Average counts of 8-OHdG+ cells in liver sections show significantly elevated DNA oxidation in SCI, DIO and DIO + SCI groups compared to naïve. There were no differences between groups. (F) Representative images of 8-OHdG+ immunolabeling in livers at 8wpi. Scale bar = 100 μm. C-E: Asterisks above bars represent comparison to Naïve. Asterisks over lines represent post-hoc comparisons between groups spanned by the lines. C-E: *p < .05, **p < .01 and ***p < .001 via two-way ANOVA and Bonferroni stepdown post-hoc test. A-D: n = 6 Naïve, DIO, n = 10 SCI, DIO + SCI; E: n = 3 naive, DIO, n = 6 SCI, DIO + SCI. Error bars represent mean + SEM.
Fig. 8.
Fig. 8.. Compared to obesity, SCI causes comparable or worse hyperglycemia, dyslipidemia, and insulin resistance, and the combination of SCI plus obesity exacerbates insulin resistance.
(A) SCI and diet-induced obesity (DIO) significantly increased circulating free fatty acids (FFAs) compared to naive. SCI with or without DIO induced significantly more serum FFAs than DIO alone. (B) SCI alone or combined with DIO significantly increased serum triglycerides compared to naive and DIO. (C,D) Serum glucose and insulin were comparably increased by SCI and DIO compared to naïve controls. Combining DIO + SCI induced significantly higher serum glucose and insulin levels compared to SCI or DIO alone. (E,F) Significant insulin resistance occurred in all groups compared to naïve; SCI on a background of obesity (DIO + SCI) caused significantly greater insulin resistance than SCI or DIO alone. *p < .05, **p < .01 and ***p < .001 via two-way ANOVA and Bonferroni stepdown post-hoc test. Asterisks above bars represent comparison to Naïve. Asterisks over lines represent post-hoc comparisons between groups spanned by the lines. n = 6 Naïve, DIO, n = 79 SCI, DIO + SCI (due to missing values). Error bars represent +SEM.
Fig. 9.
Fig. 9.
Venn diagram illustrating outcome measures in the current study that were greater in SCI vs. DIO, greater in DIO vs. SCI or equal in both groups. Bolded blue text indicates outcome measures that were significantly greater in DIO + SCI compared to SCI or DIO.

Similar articles

Cited by

References

    1. Ahmed U, Latham PS, Oates PS, 2012. Interactions between hepatic iron and lipid metabolism with possible relevance to steatohepatitis. World J. Gastroenterol 18 (34) 10.3748/wjg.v18.i34.4651. - DOI - PMC - PubMed
    1. Almad A, McTigue DM, 2010. Chronic expression of PPAR-delta by oligodendrocyte lineage cells in the injured rat spinal cord. J. Comp. Neurol 518 (6), 785–799. 10.1002/cne.22242. - DOI - PMC - PubMed
    1. An L, Wirth U, Koch D, et al., 2022. The role of gut-derived lipopolysaccharides and the intestinal barrier in fatty liver diseases. J. Gastrointest. Surg 26 (3), 671–683. 10.1007/s11605-021-05188-7. - DOI - PMC - PubMed
    1. Anderson ER, Shah YM, 2013. Iron homeostasis in the liver. Compr. Physiol 3 (1), 315–330. 10.1002/cphy.c120016. - DOI - PMC - PubMed
    1. Armandi A, Rosso C, Caviglia GP, Bugianesi E, 2021. Insulin resistance across the Spectrum of nonalcoholic fatty liver disease. Metabolites 11 (3). 10.3390/metabo11030155. - DOI - PMC - PubMed

LinkOut - more resources