. 2024 Jul;300(7):107452.
doi: 10.1016/j.jbc.2024.107452. Epub 2024 Jun 7.

Comprehensive functional characterization of complement factor I rare variant genotypes identified in the SCOPE geographic atrophy cohort

Collaborators, Affiliations

Comprehensive functional characterization of complement factor I rare variant genotypes identified in the SCOPE geographic atrophy cohort

Thomas M Hallam et al. J Biol Chem. 2024 Jul.

Abstract

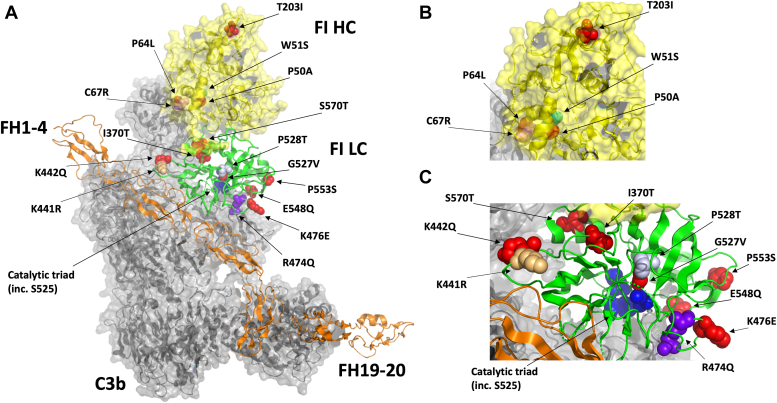
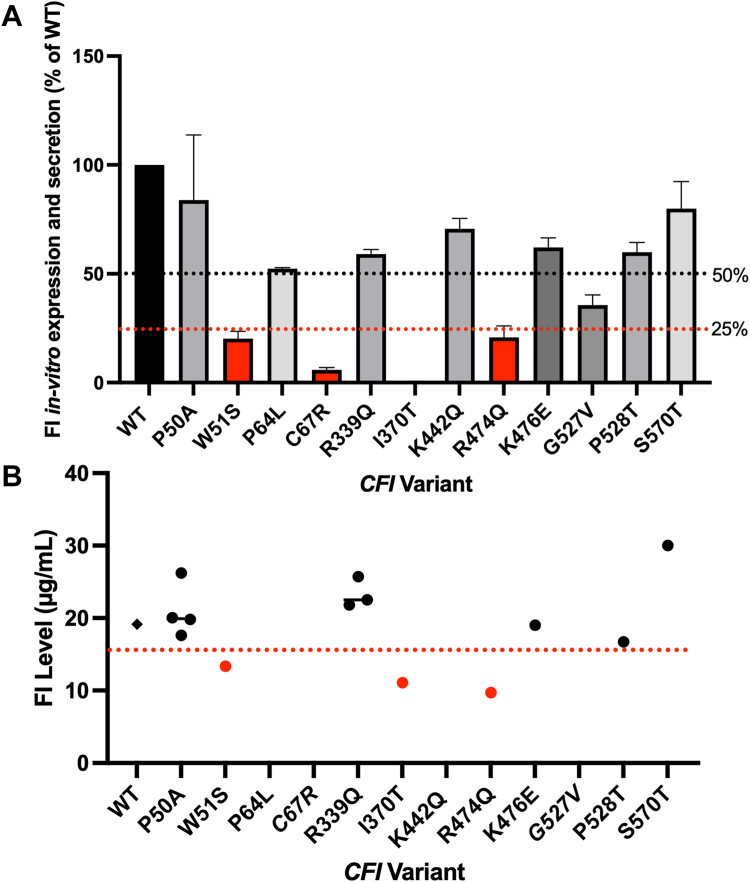
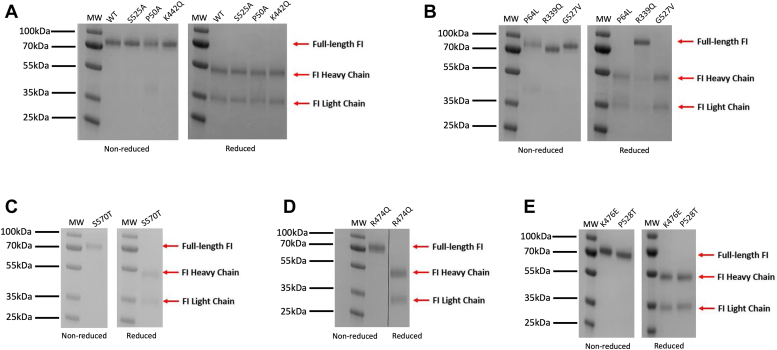
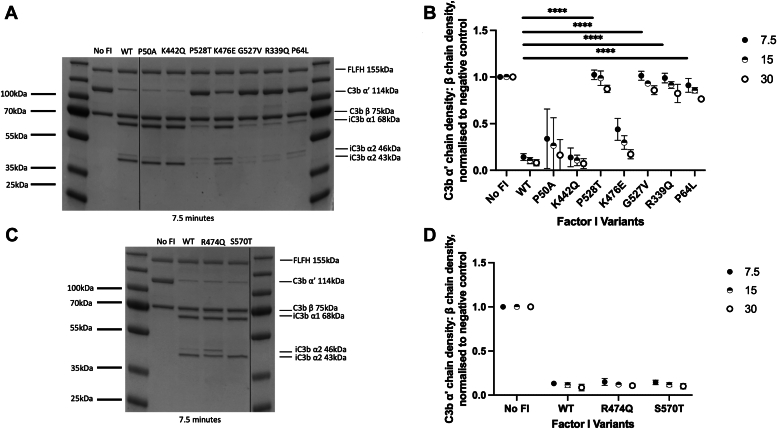
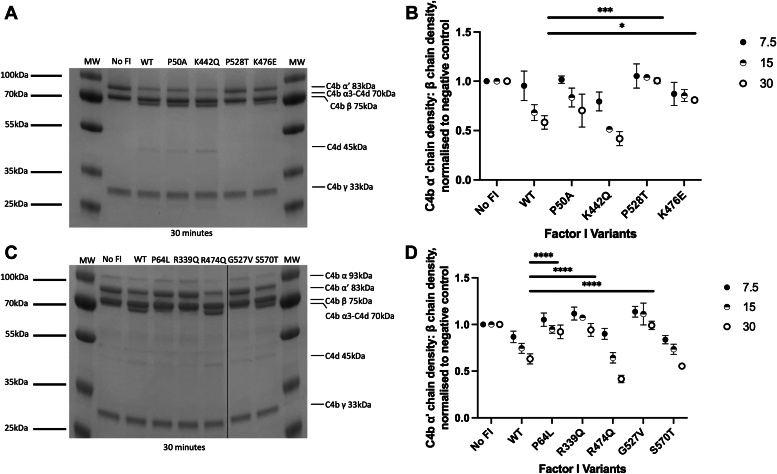
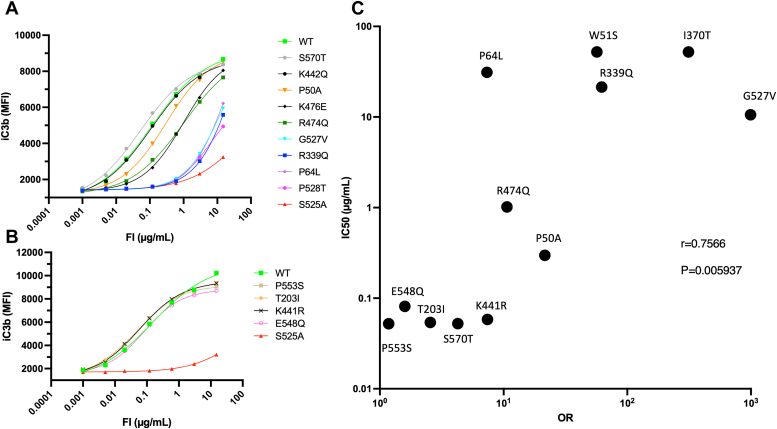
Rare variants (RVs) in the gene encoding the regulatory enzyme complement factor I (CFI; FI) that reduce protein function or levels increase age-related macular degeneration risk. A total of 3357 subjects underwent screening in the SCOPE natural history study for geographic atrophy secondary to age-related macular degeneration, including CFI sequencing and serum FI measurement. Eleven CFI RV genotypes that were challenging to categorize as type I (low serum level) or type II (normal serum level, reduced enzymatic function) were characterized in the context of pure FI protein in C3b and C4b fluid phase cleavage assays and a novel bead-based functional assay (BBFA) of C3b cleavage. Four variants predicted or previously characterized as benign were analyzed by BBFA for comparison. In all, three variants (W51S, C67R, and I370T) resulted in low expression. Furthermore, four variants (P64L, R339Q, G527V, and P528T) were identified as being highly deleterious with IC50s for C3b breakdown >1 log increased versus the WT protein, while two variants (K476E and R474Q) were ∼1 log reduced in function. Meanwhile, six variants (P50A, T203I, K441R, E548Q, P553S, and S570T) had IC50s similar to WT. Odds ratios and BBFA IC50s were positively correlated (r = 0.76, p < 0.01), while odds ratios versus combined annotation dependent depletion (CADD) scores were not (r = 0.43, p = 0.16). Overall, 15 CFI RVs were functionally characterized which may aid future patient stratification for complement-targeted therapies. Pure protein in vitro analysis remains the gold standard for determining the functional consequence of CFI RVs.

Keywords: C3 glomerulopathy(C3G); age-related macular degeneration (AMD); atypical hemolytic uremic syndrome (aHUS); complement; complement factor I; complement system; enzyme mutation; innate immunity; retinal degeneration.


Conflict of interest statement

Conflict of interest D. K.: Gyroscope Therapeutics (consultancy, equity, grant income), Novartis (consultancy), Alexion Pharmaceuticals (consultancy), Apellis (consultancy); Sarepta (consultancy), Chemocentryx (Consultancy), Sobi (consultancy), Samsung (consultancy), Purespring (consultancy), Roche (consultancy); C. L. H: Q32 Bio (consultancy), Gyroscope Therapeutics (Consultancy), Novartis (employee), Ra Pharmaceuticals (Grant income), Biocryst (consultancy); K. J. M: Qualasept (consultancy), Freeline Therapeutics (consultancy), Catalyst Biosciences (grant income, consultancy), Idorsia Pharmaceuticals (grant income), Gemini Therapeutics (grant income, consultancy), Alexion Pharmaceuticals (grant income, consultancy); T. M. H.: Gyroscope Therapeutics, Novartis (employee); S. J. S.: Gyroscope Therapeutics, Novartis (employee); E. G.: Gyroscope Therapeutics, Novartis (employee); A. D.: Gyroscope Therapeutics, Novartis, Beacon Therapeutics (employee); A. V. J.: Gyroscope Therapeutics, Novartis (employee); A. L.: Gyroscope Therapeutics (consultancy, equity), Roche (consultancy), Apellis (consultancy), Novartis (consultancy).

Figures

Figure 1
Figure 1
SCOPE FI variants selected for production, position within the AP regulatorytrimolecular complex.A, three-dimensional structure of the AP regulatory trimolecular complex of FH1-4_19 to 20 (orange), C3b (gray), and Factor I (heavy chain (HC): yellow, and light chain (LC): green), amino acid with identified variation within the cohort (colored (red, green, gray, or purple spheres), catalytic triad (blue spheres). B, zoomed in on HC. C, zoomed in on LC. Figures were generated using PyMOL v2.5.4 (Schrodinger, LLC) and PDB structure 5o32 (65). AP, alternative pathway; PDB, Protein Data Bank.
Figure 2
Figure 2
Antigenic assessment of FI variants.A, recombinant expression and secretion analysis of FI variants. In six well-plates, HEK293T cells were transfected using the standard method with plasmids containing cDNA for each FI variant and incubated for 72 h in the absence of hygromycin (N = 10 for WT, minimum of N = 3 for each variant). ELISA was used to determine the concentration, shown here as the percentage of WT. The mean and standard deviation are displayed for each variant. Lines represent 50% and 25% of WT level, and red bars represent those below 25% expression versus WT. B, antigenic levels for FI Variants in serum. Plotted by circles are the FI serum levels (μg/ml) detected in the serum samples of individuals in the SCOPE cohort carrying the CFI rare variants investigated in this study. The black diamond for “WT” represents the mean FI level for the control cohort (19.1 μg/ml). The red dotted line represents the low-level cutoff point (15.6 μg/ml). No measurement was performed for the carriers of three variants (P64L, C67R and G527V) and K442Q was a designed mutant. Red dots represent those variants with FI levels below the low-level cutoff. cDNA, complementary DNA; CFI, complement factor I.
Figure 3
Figure 3
SDS-PAGE for purified FI variants. Purified FI variants and WT recombinant FI were subjected to standard SDS-PAGE (AE). Coomassie blue-stained SDS-PAGE gels show ∼1 μg of purified FI under nonreducing (left gel AE) or reducing conditions (right gel AE) for each variant that could be made and the WT. The heavy chain of factor I is represented by the band at 50 kDa, whereas the light chain is represented by the band at 38 kDa. Splicing sites for removal of irrelevant lanes are marked by a black line. Ladder size: 10 to 250 kDa. MW, molecular weight.
Figure 4
Figure 4
Evaluation of fluid phase C3b cofactor activity of FI variants by SDS-PAGE and kinetic analysis.A and C, after incubation of each FI variant with C3b and FH, SDS-PAGE was utilized to demonstrate proteolytic activity over a range of time points (7.5–30 min; 7.5 min shown here. 15- and 30-min time points are shown in Fig. S1). FI enzymatic activity was assessed by monitoring the loss of the α′ band of C3b at 114 kDa and the generation of the α1 and α2 chains of iC3b. Splicing sites for removal of irrelevant lanes are marked by a black line. B and D, the remaining density of the C3b α′ chain (Y-axis) is plotted after incubation of each FI variant with C3b and FH for 7.5, 15, and 30 min at 37 °C. The density of the α′ chain band is normalized to the β chain band density of the same lane. The resulting figure is further normalized to a negative control lacking FI, yielding a proportion of α′ chain remaining in comparison to the no-FI control (no FI = 1; all α′ chain remaining). The normalized α′ chain remaining for each variant is provided as the mean (N = 3 for all variants apart from G527V (N = 2)) with SD presented as error bars and significance tested at 7.5 min using One-way ANOVA and Dunnett’s multiple comparisons test. ∗p < 0.05, ∗∗p < 0.01, ∗∗∗p < 0.001, ∗∗∗∗p < 0.0001.
Figure 5
Figure 5
Evaluation of C4b cofactor activity of FI variants by SDS-PAGE and kinetic analysis.A and C, after incubation of each FI variant with C4b and C4BP, SDS-PAGE was utilized to demonstrate proteolytic activity over a range of time points (7.5–30 min; 30 min shown here. 7.5 and 15 -min time points are shown in Fig. S2). FI enzymatic activity was assessed by monitoring the loss of the α′ band of C4b (83 kDa) and the generation of the C4d band (45 kDa). Splicing sites for removal of irrelevant lanes are marked by a black line. B and D, the remaining density of the C4b α′ chain (Y-axis) is plotted after incubation of each FI variant with C4b and FH for 7.5, 15, and 30 min at 37 °C. The density of the α′ chain band is normalized to the β chain band density of the same lane. The resulting figure is further normalized to a negative control lacking FI, yielding a proportion of α′ chain remaining in comparison to the no-FI control (no FI = 1; all C4b α′ chain remaining). The normalized α′ chain remaining for each variant is provided as the mean (n = 3 for all variants) with SD presented as error bars and significance tested at 30 min using one-way ANOVA and Dunnett’s multiple comparisons test. ∗p < 0.05, ∗∗p < 0.01, ∗∗∗p < 0.001, ∗∗∗∗p < 0.0001. C4BP, C4b binding protein.
Figure 6
Figure 6
Analysis of bead-based C3b cleavage IC50s for FI variants.A, bead-based functional assay (BBFA) of C3b cleavage. Each FI RV was titrated 1:4 into C3b-coated beads with excess FH and incubated for 1 h to allow cleavage of C3b by each FI variant. Function is directly proportional to signal where increasing MFI represents more iC3b formation. Four parameter logistic regression curves are shown by lines (WT: light green; P50A: orange P64L: purple; R339Q: blue; K442Q: black with circles; R474Q: dark green; K476E: black with diamonds; S525A: red; G527V: cyan; P528T: pink; S570T: gray). Each point shows the median fluorescence intensity (MFI) of a minimum of 1000 beads for each concentration of FI variant (μg/ml). Assay representative of three independent repeats for all variants apart from R474Q with two repeats. B, bead-based functional assay (BBFA) of C3b cleavage for T203I (orange), K441R (black), E548Q (pink), P553S (gold), compared to WT (green) and S525A (red). C, correlation analysis of BBFA IC50s versus odds ratio. Pairwise correlation analysis was carried out by plotting the OR (X-axis) and IC50 from the BBFA (Y-axis) for each FI variant and the Spearman correlation test was performed. An r value of 0.74 (p = 0.0059) suggests a moderate positive correlation between the two values (∗∗p < 0.01). RV, rare variants.

Similar articles

Cited by

References

    1. Wong W.L., Su X., Li X., Cheung C.M.G., Klein R., Cheng C.Y., et al. Global prevalence of age-related macular degeneration and disease burden projection for 2020 and 2040: a systematic review and meta-analysis. Lancet Glob. Health. 2014;2:e106–e116. - PubMed
    1. Wang Y., Zhong Y., Zhang L., Wu Q., Tham Y., Rim T.H., et al. Global incidence, progression, and risk factors of age-related macular degeneration and projection of disease Statistics in 30 Years: a modeling study. Gerontology. 2022;68:721–735. - PubMed
    1. Fleckenstein M., Keenan T.D.L., Guymer R.H., Chakravarthy U., Schmitz-Valckenberg S., Klaver C.C., et al. Age-related macular degeneration. Nat. Rev. Dis. Primers. 2021;7:31. - PubMed
    1. Ambati J., Fowler B.J. Mechanisms of age-related macular degeneration. Neuron. 2012;75:26–39. - PMC - PubMed
    1. Maguire M.G., Martin D.F., Ying G.S., Jaffe G.J., Daniel E., Grunwald J.E., et al. Five-year outcomes with anti–Vascular Endothelial Growth factor treatment of Neovascular age-related macular degeneration: the comparison of age-related macular degeneration treatments trials. Ophthalmology. 2016;123:1751–1761. - PMC - PubMed

Publication types

LinkOut - more resources