. 2024 Oct 1;116(10):1632-1644.
doi: 10.1093/jnci/djae091.

RET overexpression leads to increased brain metastatic competency in luminal breast cancer

Affiliations

RET overexpression leads to increased brain metastatic competency in luminal breast cancer

Petra Jagust et al. J Natl Cancer Inst. .

Abstract

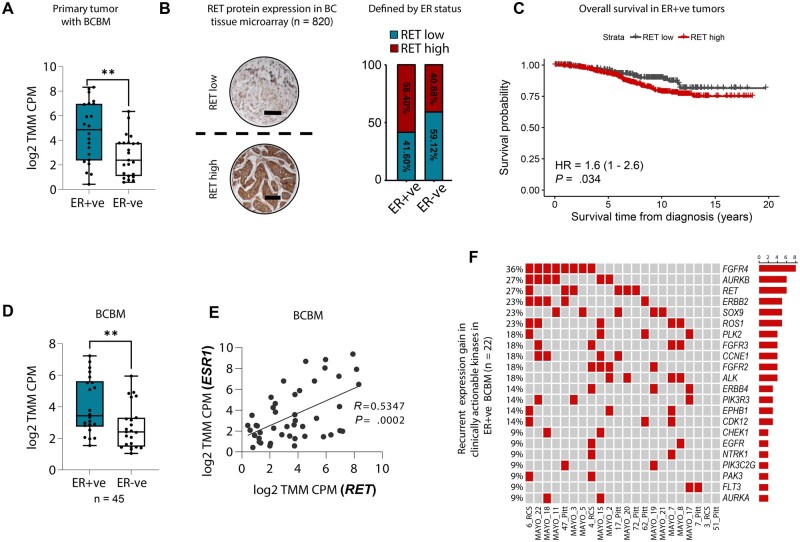
Background: Breast cancer brain metastasis is a rising occurrence, necessitating a better understanding of the mechanisms involved for effective management. Breast cancer brain metastases diverge notably from the primary tumor, with gains in kinase and concomitant losses of steroid signaling observed. In this study, we explored the role of the kinase receptor RET in promoting breast cancer brain metastases and provide a rationale for targeting this receptor.

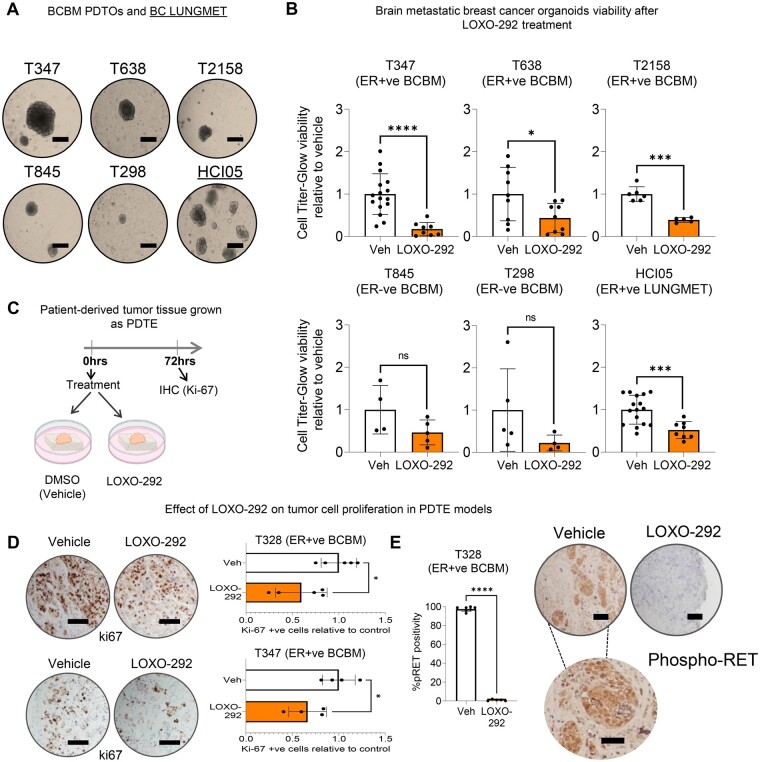
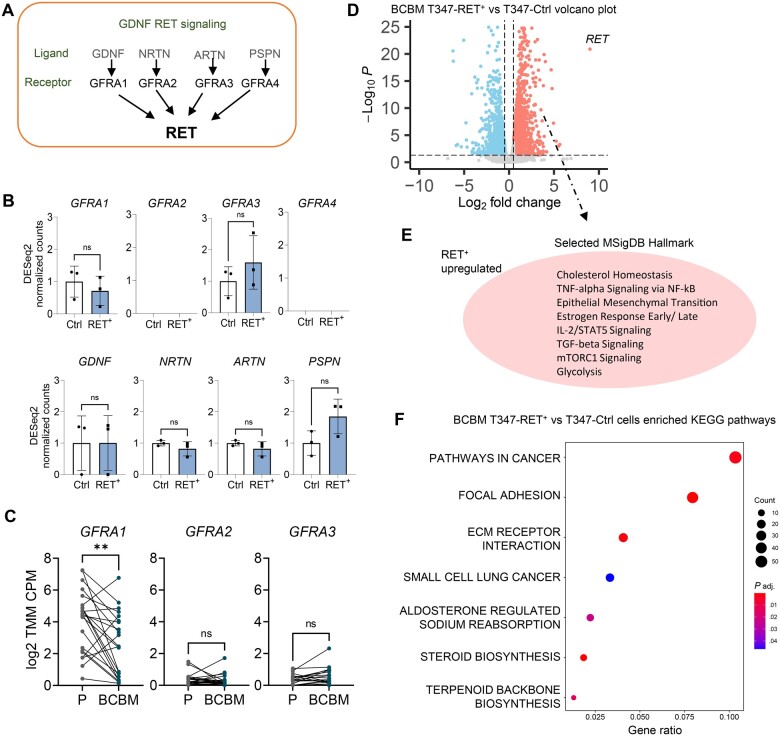
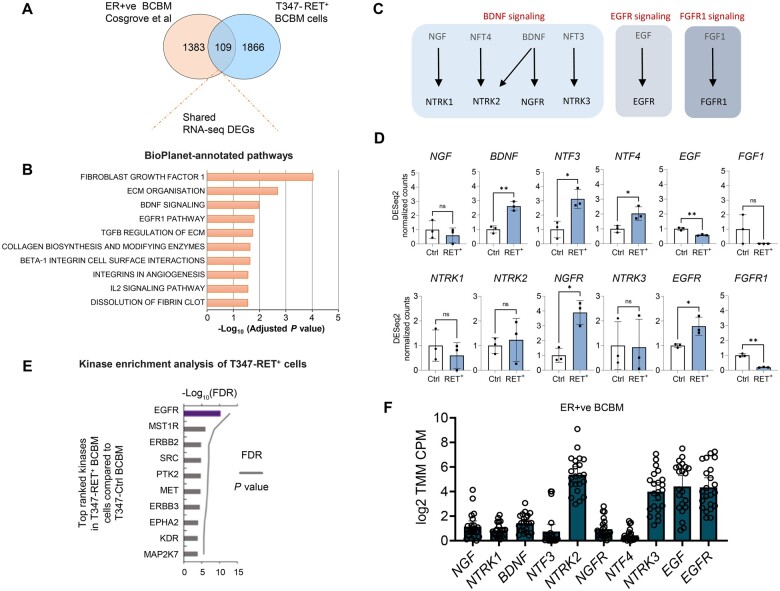
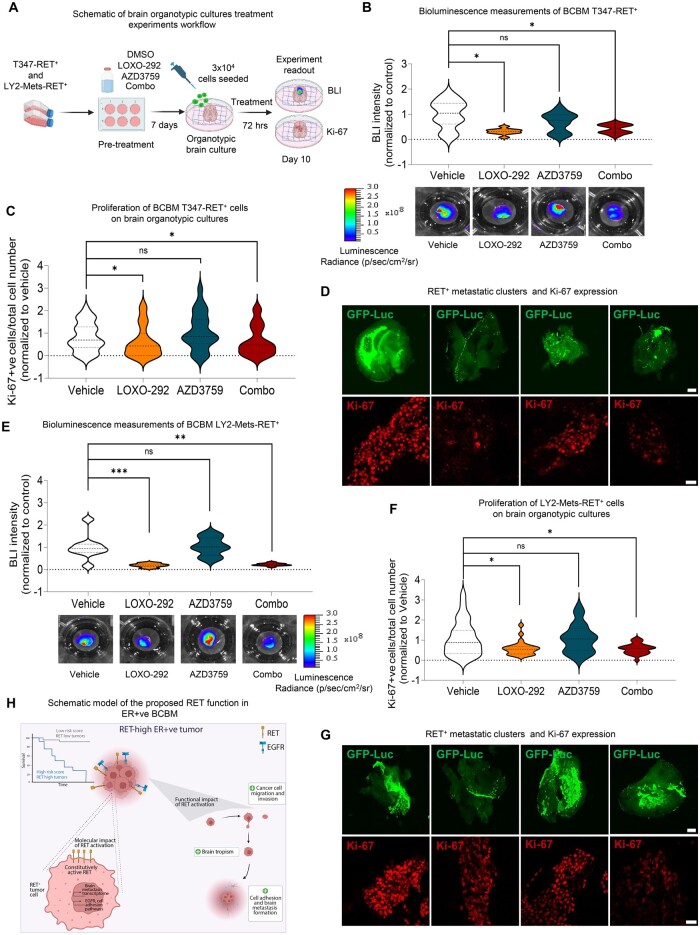
Methods: RET expression was characterized in a cohort of patients with primary and brain metastatic tumors. RET functionality was assessed using pharmacological inhibition and gene silencing in patient-derived brain metastatic tumor explants and in vivo models, organoid models, and brain organotypic cultures. RNA sequencing was used to uncover novel brain metastatic relevant RET mechanisms of action.

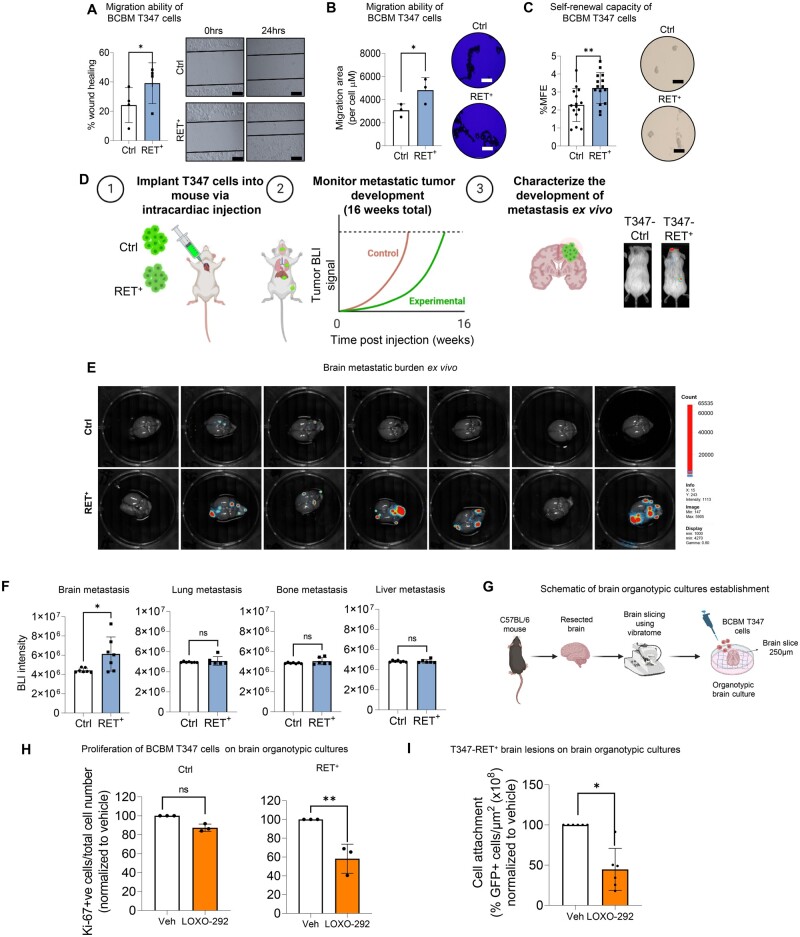
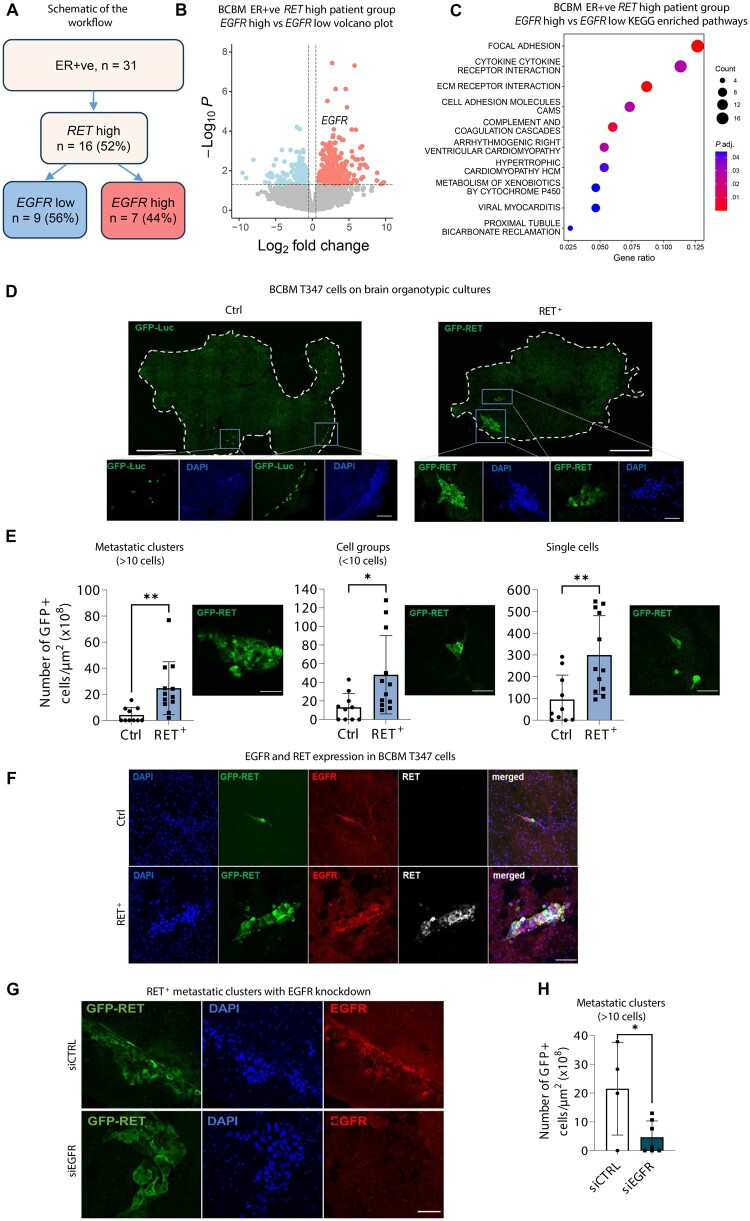
Results: A statistically significant enrichment of RET in brain metastases was observed in estrogen receptor-positive breast cancer, where it played a role in promoting cancer cell adhesion, survival, and outgrowth in the brain. In vivo, RET overexpression enhanced brain metastatic competency in patient-derived models. At a mechanistic level, RET overexpression was found to enhance the activation of gene programs involved in cell adhesion, requiring EGFR cooperation to deliver a pro-brain metastatic phenotype.

Conclusion: Our results illustrate, for the first time, the role of RET in regulating colonization and outgrowth of breast cancer brain metastasis and provide data to support the use of RET inhibitors in the management strategy for patients with breast cancer brain metastases.


Conflict of interest statement

The authors declare no conflict of interest.

Figures

Figure 1.
Figure 1.
RET is a key player in estrogen receptor–positive breast cancer brain metastasis. A) RET gene expression based on estrogen receptor expression in primary tumors with BCBM (n = 45 patients). Whiskers go from the minimum to the maximum value. The P value was obtained using a 2-tailed t test. **P <.01. B) Representative images of immunohistochemical staining of RET protein on a tissue microarray (n = 820) of BC samples. Scale bars, 100 μm. Dashed line represents the cutoff for RET high and RET low expression samples. RET high and RET low cutoff (immunohistochemical cutoff score = 300) was obtained with the ROC curve (left). The percentage of RET high and RET low in the ER+ve (n = 661) and ER-ve (n = 159) patient population (right). C) Kaplan-Meier analysis of overall survival in ER+ve BC tissue (n = 661). D) RET gene expression in BCBM comparing ER-ve (n = 23) and ER+ve (n = 22) patient samples. The P value was obtained using a 2-tailed t test. **P <.01. E) Correlation of ESR1 and RET gene expression (log2 TMM CPM) in BCBM patient samples (n = 45). The P value was obtained using a 2-tailed Pearson correlation test. F) OncoPrint of clinically actionable kinases with discrete expression gains in ER+ve BCBM patient samples (n = 45). BC = Breast Cancer; BCBM = Breast Cancer Brain Metastasis; ER+ve = Estrogen-Receptor positive; ER-ve = Estrogen-Receptor negative; ROC = Receiver Operating Characteristic curve.
Figure 2.
Figure 2.
RET overexpression is a vulnerability in estrogen receptor–positive breast cancer brain metastatic tumors. A) Representative images of PDTOs. Individual organoids are shown (scale bar, 50 µm). B) Viability assessed by CellTiter-Glo kit showing luminescence (mean [SD]) after 7 days of Veh (DMSO) or LOXO-292 (10 µM) treatment in PDTOs. Two-tailed t test with Welch correction. P = ns, statistically non significant; *P <.05; ***P <.001; ****P <.0001 (n = 6 - 16, biological PDTO replicates). C) Graphical representation of establishment and treatment of PDTE. This scheme was created using elements from Biorender (https://biorender.com/). D) Ki-67% (proliferation index) analyzed by immunohistochemistry after treating PDTE with vehicle (DMSO) or LOXO-292 (10 µM) for 72 hours. Bar chart (mean [SD]) displays the percentage of Ki-67+ve cells (representative Ki-67 images shown on the left; scale bars, 100 μm). Two-sided unpaired t test with Welch correction. *P <.05 (n = 4, biological PDTE replicates). E) Relative phospho-RET protein expression; bar chart shows mean (SD) positivity after vehicle (DMSO) or LOXO-292 (10 µM) treatment for 72 hours, assessed by immunohistochemistry in a T328-PDTE. Two-sided unpaired t test with Welch correction. Scale bars, 100 μm. ****P <.001 (n = 6 - 8, biological PDTE replicates). BCBM = Breast Cancer Brain Metastasis; PDTOs = Patient Derived BCBM Organoids; PDTE = Patient Derived Tumor Explants; ER+ve = Estrogen-Receptor positive; ER-ve = Estrogen-Receptor negative; BC LUNGMET = lung metastasis of breast cancer; Ki-67+ve = Ki-67 positive cells; Veh = vehicle.
Figure 3.
Figure 3.
Constitutively increased expression of RET mediates brain-specific metastasis development and homing. A) In vitro migration ability of BCBM T347-Ctrl and T347-RET+ cells after 24 hours, measured with a wound healing assay (n = 4 biological replicates per cell line). Graph shows the percentage of wound closing compared to time zero (mean [SD]). Representative images (scale bar, 200 µm) at time 0 hours and 24 hours after the scratch was made. Two-sided paired t test. *P <.05. B) A Cellomics Cell Motility Kit was used to assess individual cell movement in collagen in a 96-well plate after 24 hours. Representative images of cells after fixing and staining (scale bars represent 200 μm). The mean migratory area per cell (μm) is shown on the graph (n = 3 biological replicates per cell line). Two-sided paired t test. *P <.05. C) Self-renewal capacity of T347-RET+ and T347-Ctrl cells was measured by mammosphere formation assay. Second-generation mammospheres (>50 µm) were counted under a microscope and presented as mammosphere formation efficiency (mean [SD]). Two-sided unpaired t test. **P <.005 (n = 3 biological replicates). D) Graphical representation of the experimental design. Mice were injected intracardialy with T347-Ctrl or T347-RET+ cells (n = 7 mice per cell line) and monitored over 16 weeks. This schematic was created using elements from Biorender (https://biorender.com/). E) At end of experiment (16 weeks) ex vivo brain BLI images were taken. F) Quantification of ex vivo brain BLI in brain, lung, bone and liver. The bar graph represents mean brain BLI values (n = 6 - 7 mice per cell line). Two-sided Mann-Whitney t test. P = ns, statistically non significant. *P <.05. G) Graphical representation of brain organotypic culture establishment. This scheme was created using elements from Biorender (https://biorender.com/). H) Ki-67% (proliferation index) analyzed by immunofluorescence after 72 hours of treatment of T347-Ctrl and T347-RET+ brain organotypic cultures with Veh (DMSO) or LOXO-292 (10 µM). Two-sided unpaired t test. P = ns, statistically non significant; **P <.01. (bar chart mean [SD]). I) Quantification of T347-RET+ cells’ attachment to the brain organotypic cultures after treatment with Veh (DMSO) or LOXO-292 (10 µM) (n = 6 brain organotypic cultures). BCBM cell lesion areas are normalized to the brain slice area for each replicate. Graph values are normalized to the control treated with DMSO. The bar chart shows mean [SD]. Two-sided Mann-Whitney t test, *P <.05. BCBM = Breast Cancer Brain Metastasis; Veh = vehicle; MFE = mammosphere formation efficiency; BLI = bioluminescence.
Figure 4.
Figure 4.
RET+ breast cancer brain metastatic cells display distinct pro–metastatic pathway activation (A) Graphical representation of the RET-GDNF signaling pathway. B) Gene expression of RET family receptors and soluble neurotrophic factor ligands in BCBM T347-Ctrl (Ctrl) and T347-RET+ (RET+) cells. C) Gene expression of GNDF family receptors in primary (P) breast cancer and BCBM (n = 22 patients). D) RNA sequencing was performed on T347-Ctrl and T347-RET+ cells. Differential gene expressions visualized with a volcano plot. E) Key MSigDb pathways found to be associated with a RET+ upregulated gene set are highlighted. F) KEGG pathway enrichment analysis was performed comparing RET+ with Ctrl gene expression (P <.05, log2 fold change > 0.5, pathway analysis of upregulated genes). GFRA 1-4 = GDNF Family Receptor Alpha 1-4; GDNF = Glial cell line-Derived Neurotrophic Factors; NTRN = Neurturin; ARTN = Artemin; PSPN = Persephin; P = Primary breast cancer; BCBM = Breast Cancer Brain Metastasis.
Figure 5.
Figure 5.
RET overexpression in breast cancer mediates brain-specific phenotype. A) Venn diagram showing 109 genes for the intersection between DEGs of ER+ve BCBM patient data (n = 22; log2 fold change > 2) and BCBM T347-RET+ cells (log2 fold change > 1) from RNA-seq data. B) BioPlanet-annotated pathways. The top 10 pathways based on adjusted P value are shown from overlapped genes (109 genes, from Figure 5, A). C) Graphical representation of BDNF and EGFR signaling neurothrophins and receptors. D) Gene expression of BDNF, EGFR, and FGFR1 signaling receptors and ligands in T347-Ctrl and T347-RET+ cells. E) RNA-seq data from T347-RET+ versus T347-Ctrl cells was analyzed using Kinase Enrichment Analysis, version 3. The top 10 identified kinases are shown. F) Gene expression in ER+ve BCBM patients (n = 22). BDNF = brain-derived neurotrophic factor; DEGs = Differentially Expressed Genes; ER+ve = Estrogen Receptor–positive; BCBM = Breast Cancer Brain Metastasis; RNA-seq = RNA sequencing; EGFR = Epidermal Growth Factor Receptor; FDR = false discovery rate; NGF = Nerve Growth Factor; BDNF = Brain Derived Neurotrophic Factor; NTF3 = Neurotrophin 3; NTF4 = Neurotrophin 4; EGF = Epidermal Growth Factor; FGF1 = Fibroblast Growth Factor 1; NTRK1 = Neurotrophic Receptor Tyrosine Kinase 1; NTRK2 = Neurotrophic Receptor Tyrosine Kinase 2; NGFR = Nerve Growth Factor Receptor; NTRK3 = Neurotrophic Receptor Tyrosine Kinase 3; FGFR1 = Fibroblast Growth Factor Receptor 1.
Figure 6.
Figure 6.
RET+ breast cancer brain metastatic cells display distinct behavior and function. A) The schematic workflow of ER+ve patients analysis based on their RET and EGFR gene expression in BCBM. The percentage of patients in the investigated population is shown in brackets. B) DEGs between the ER+ve BCBM RET high EGFR high (n = 7 patients) and RET high EGFR low (n = 9 patients) are visualized with a volcano plot. C) KEGG pathway enrichment analysis was performed comparing ER+ve BCBM RET high EGFR high to RET high EGFR low (P <.05, log2 fold change > 0.5, pathway analysis of upregulated genes). D) Representative immunofluorescence images of T347 metastatic clusters and cells (Ctrl and RET+) on brain organotypic cultures. DAPI - blue, T347-Ctrl-GFP-Luc or T347-RET+-GFP cells - green. The white line shows the borders of brain organotypic cultures. Whole-brain slice images are in the upper panel (scale bar, 1000 μm), and magnified images are in the lower panel (scale bar, 100 μm). E) Quantitative analysis of T347-Ctrl and T347-RET+ cell adherence. The number of formed metastatic clusters (>10 cells), number of groups (<10 cells) and single cells on the brain organotypic cultures (n = 3 biological replicates) were counted and presented per area of brain slice. Two-sided unpaired t test. *P <.05; **P <.01. Representative images of single cells, groups, and metastatic clusters are shown (scale bar, 100 μm). F) Representative immunofluorescence images showing RET and EGFR staining in T347-RET+ and T347-Ctrl cells in brain organotypic cultures (scale bar, 100 μm). G) Representative images of the immunofluorescence from Figure 6, H (scale bar 100 μm). H) Graph showing the number of formed T347-RET+ metastatic clusters at 72 hours on brain organotypic cultures (n = 3 biological replicates) after EGFR silencing. Two-sided unpaired t test. *P <.05. ER+ve = estrogen-receptor positive; EGFR = Epidermal Growth Factor Receptor; BCBM = Breast Cancer Brain Metastases; DEGs = Differential Expressed Genes; siEGFR = small interfering RNA for EGFR; siCTRL = small interfering RNA for control.
Figure 7.
Figure 7.
The effect of LOXO-292 and AZD3759 on breast cancer brain metastasis establishment. A) Schematic representation of experimental design. B) Upper panel: quantification of BLI signal (p/sec/cm2/sr) from T347-RET+ colonies on brain organotypic cultures after 10 days of treatment (7 days of pretreatment and 72 hours of treatment ex vivo). Violin plots show BLI signal distribution 72 hours after seeding cells on brain organotypic cultures normalized to vehicle (DMSO; n = 10 brain organotypic cultures per condition). Two-sided Mann-Whitney t test. P = ns, statistically non significant; *P <.05 (bar chart mean [SD]). Lower panel: representative images of BLI signal from T347-RET+ colonies treated with vehicle (DMSO), LOXO-292 (1 µM), AZD3759 (10 nM), or LOXO-292 and AZD3759 combination (Combo). C) Ki-67% (proliferation index) analyzed by immunofluorescence after 10 days of treatment of T347-RET+ brain organotypic cultures. At least 2 images were counted per brain organotypic culture (n = 10 brain organotypic cultures per condition). Violin plots with median (dark dashed line) and quartiles (lighter dashed lines) show distribution of the graph values firstly normalized to total cell count per image and then normalized to vehicle control (DMSO). Two-sided Mann-Whitney t test. P = ns, statistically non significant; *P <.05 (bar chart mean [SD]). D) Representative immunofluorescence images from Figure 7, C. Upper panel: T347-RET+-GFP-Luc cell colonies (green) on brain organotypic culture (scale bar, 1000 μm). Lower panel: T347-RET+-GFP-Luc stained for Ki-67 (red; scale bar, 50 μm). E) Upper panel: quantification of BLI signal from LY2-Mets-RET+ colonies on brain organotypic cultures after 10 days of treatment (7 days of pretreatment and 72 hours of treatment ex vivo). Violin plots represent BLI after 72 hours normalized to vehicle (DMSO; n = 9 -12 brain organotypic cultures). Two-sided Mann-Whitney t test. P = ns, statistically non significant; **P <.01, ***P <.001 (bar chart mean [SD]). Lower panel: representative images of BLI signal from LY2-Mets-RET+ colonies on brain organotypic cultures after 10 days of treatment with vehicle (DMSO), LOXO-292 (10 µM), AZD3759 (10 nM), or LOXO-292 and AZD3759 combination (Combo). F) Ki-67% (proliferation index) analyzed by immunofluorescence after 10 days of treatment of LY2-Mets-RET+ brain organotypic cultures. At least 2 images were counted per brain organotypic culture (n = 10 brain organotypic cultures per condition). Values are normalized to the cell number per image. Final data are shown normalized to control vehicle (DMSO) as violin plots with median (dark dashed line) and quartiles (lighter dashed lines) of distribution displayed. Two-sided Mann-Whitney t test. P = ns, statistically non significant; *P <.05 (bar chart mean [SD]). G) Representative immunofluorescence images from Figure 7, F. Upper panel: LY2-RET+-GFP-Luc cell colonies (green) on brain organotypic cultures (scale bar, 1000 μm). Lower panel: Ki-67% representative images of LY2-Mets-RET+-GFP-Luc (red; scale bar, 50 μm). H) Schematic of RET function in ER+ve BCBM. BLI = bioluminescence; ER+ve = Estrogen-Receptor positive; BCBM = Breast Cancer Brain Metastasis.

Similar articles

Cited by

References

    1. Leone JP, Lin NU.. Systemic therapy of central nervous system metastases of breast cancer. Curr Oncol Rep. 2019;21(7):59. - PubMed
    1. Valiente M, van Swearingen AED, Anders CK, et al.Brain metastasis cell lines panel: a public resource of organotropic cell lines. Cancer Res. 2020;80(20):4314-4323. - PMC - PubMed
    1. Bos PD, Zhang XHF, Nadal C, et al.Genes that mediate breast cancer metastasis to the brain. Nature. 2009;459(7249):1005-1009. - PMC - PubMed
    1. Klemm F, Maas RR, Bowman RL, et al.Interrogation of the microenvironmental landscape in brain tumors reveals disease-specific alterations of immune cells. Cell. 2020;181(7):1643-1660.e17. - PMC - PubMed
    1. Sartorius CA, Hanna CT, Gril B, et al.Estrogen promotes the brain metastatic colonization of triple negative breast cancer cells via an astrocyte-mediated paracrine mechanism. Oncogene. 2015;35(22):2881-2892. - PMC - PubMed