

The value of apparent diffusion coefficient values in predicting Gleason grading of low to intermediate-risk prostate cancer
- PMID: 38853212
- PMCID: PMC11162992
- DOI: 10.1186/s13244-024-01684-x
The value of apparent diffusion coefficient values in predicting Gleason grading of low to intermediate-risk prostate cancer
Abstract
Objectives: To investigate the diagnostic performance of the apparent diffusion coefficient (ADC) for low to intermediate-risk prostate cancer (PCa), as well as its correlation with the prognostic Gleason score (GS).
Materials and methods: Retrospective analysis of MRI images and relevant clinical data from patients with prostate disease. The differences in ADC between different GS groups were compared, and the efficacy of ADC in PCa diagnosis were analyzed. Furthermore, the diagnostic performance of the mean ADC (ADCmean) and minimum ADC (ADCmin) values was compared.
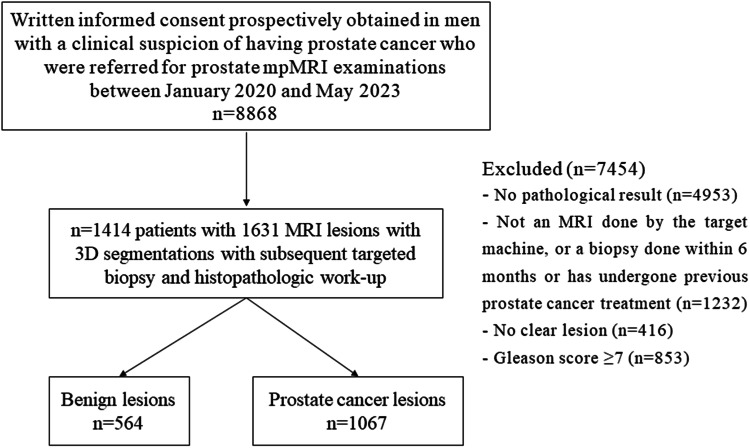
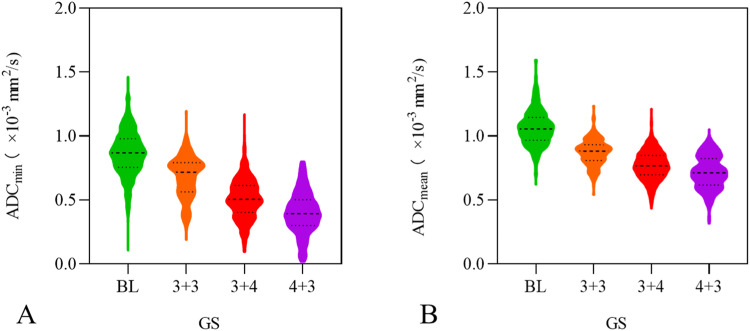
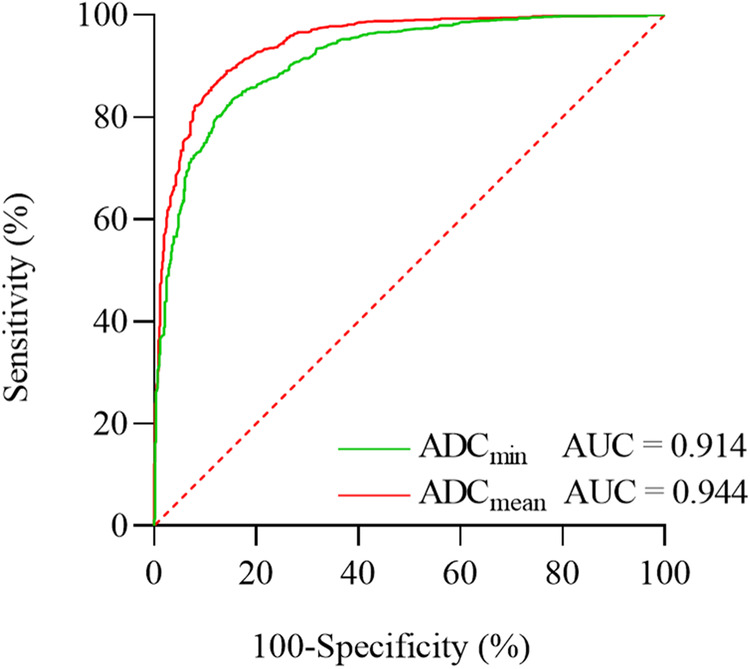
Results: There were 1414 patients with 1631 lesions. In terms of GS, both ADCmin and ADCmean values of the GS 4 + 3 group were significantly lower than those of the GS 3 + 4 group, GS 3 + 3 group, and the benign group, with all differences being statistically significant (p < 0.01). The AUC values for diagnosing PCa based on ADCmin and ADCmean were 0.914 and 0.944, respectively. The corresponding diagnostic thresholds were 0.703 × 10⁻³ mm2/s for ADCmin and 0.927 × 10⁻³ mm2/s for ADCmean. The magnitudes of ADCmin and ADCmean values exhibited a negative correlation with GS values (ρ = -0.750, p < 0.001; ρ = -0.752, p < 0.001).
Conclusions: ADC values demonstrate an inverse relationship with the invasiveness of PCa, indicating that higher invasiveness is associated with lower ADC values. Additionally, ADC values exhibit high diagnostic potential, sensitivity, and specificity for distinguishing between GS 3 + 4 and GS 4 + 3 lesions. Moreover, the diagnostic value of ADCmean is even more significant, highlighting its crucial role in the diagnosis of low to intermediate-risk PCa.
Critical relevance statement: ADC values are a valuable tool for distinguishing different levels of aggressiveness in PCa. They help in the preoperative assessment of the biological characteristics of PCa, allowing clinicians to develop personalized treatment strategies, effectively mitigating the risk of unnecessary interventions.
Key points: The preoperative GS is crucial for planning the clinical treatment of PCa. The invasiveness of PCa is inversely correlated with ADC values. ADC values play a crucial role in the accurate preoperative evaluation of low to intermediate-risk PCa, thus aiding clinicians in developing tailored treatment plans.
Keywords: Prostate cancer, Magnetic resonance imaging, Apparent diffusion coefficient, Gleason score.
© 2024. The Author(s).
Conflict of interest statement
The authors declare that they have no competing interests.
Figures
References
-
- Zheng RS, Zhang SW, Sun KX, et al. Cancer statistics in China, 2016. Zhonghua zhong liu za zhi. 2023;45:212–220. - PubMed
LinkOut - more resources
Full Text Sources
