. 2024 Jun 9;17(1):43.
doi: 10.1186/s13045-024-01562-5.

Neutrophil-specific expression of JAK2-V617F or CALRmut induces distinct inflammatory profiles in myeloproliferative neoplasia

Affiliations

Neutrophil-specific expression of JAK2-V617F or CALRmut induces distinct inflammatory profiles in myeloproliferative neoplasia

Tobias Ronny Haage et al. J Hematol Oncol. .

Abstract

Background: Neutrophils play a crucial role in inflammation and in the increased thrombotic risk in myeloproliferative neoplasms (MPNs). We have investigated how neutrophil-specific expression of JAK2-V617F or CALRdel re-programs the functions of neutrophils.

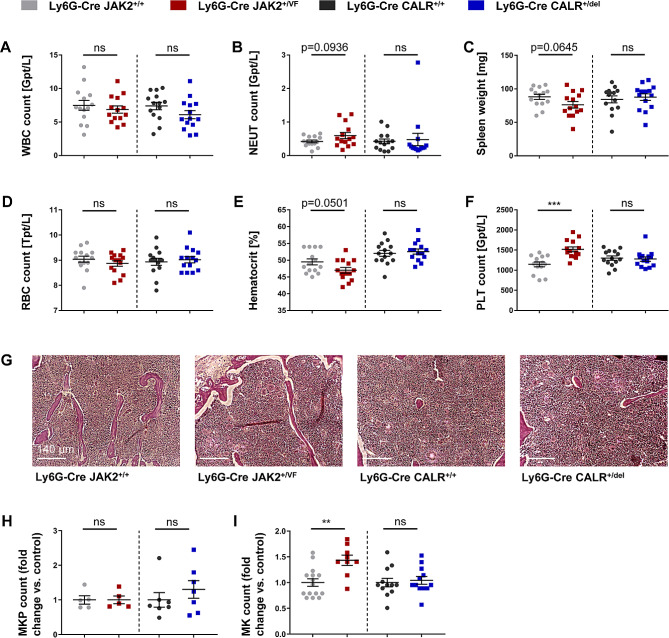
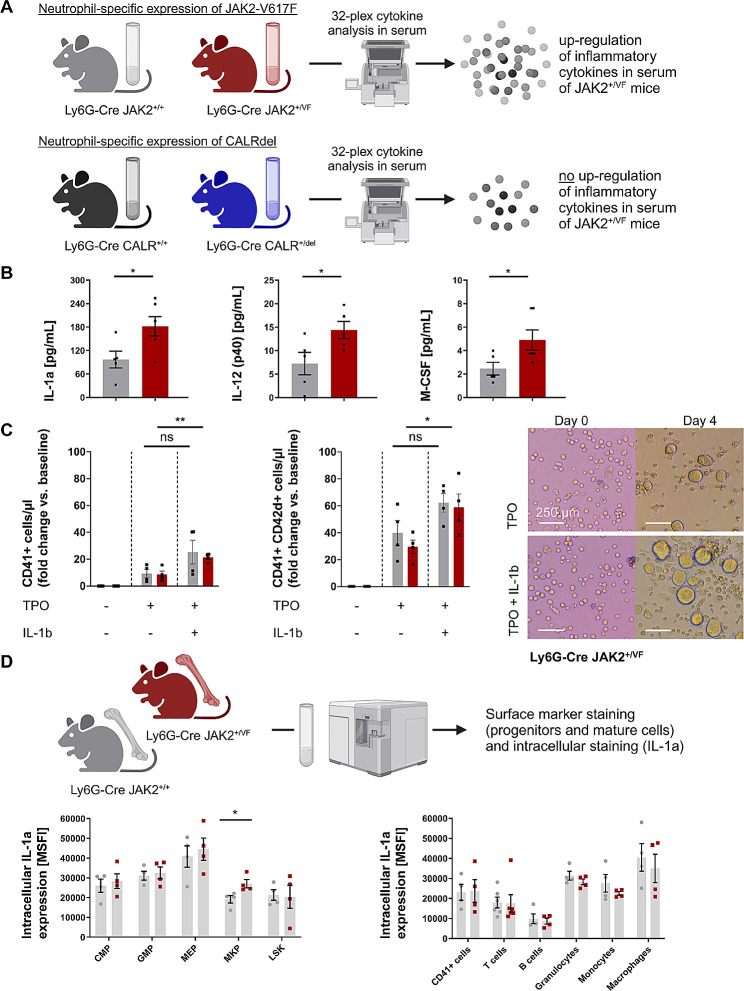
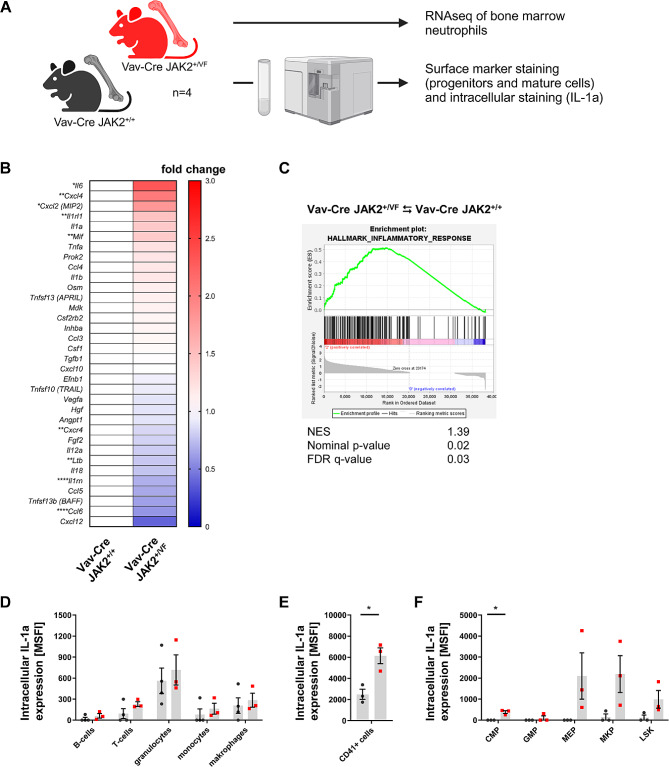
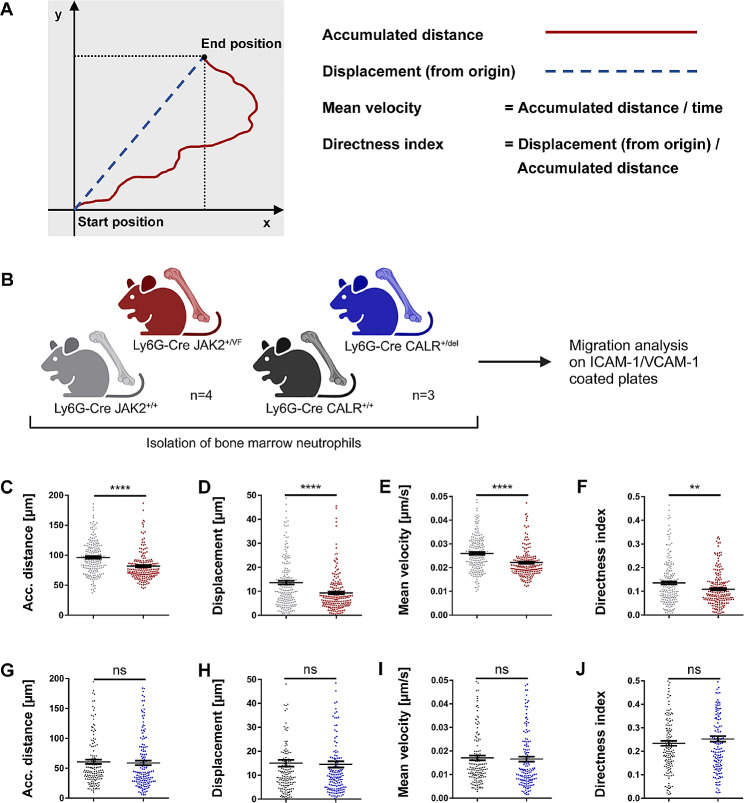
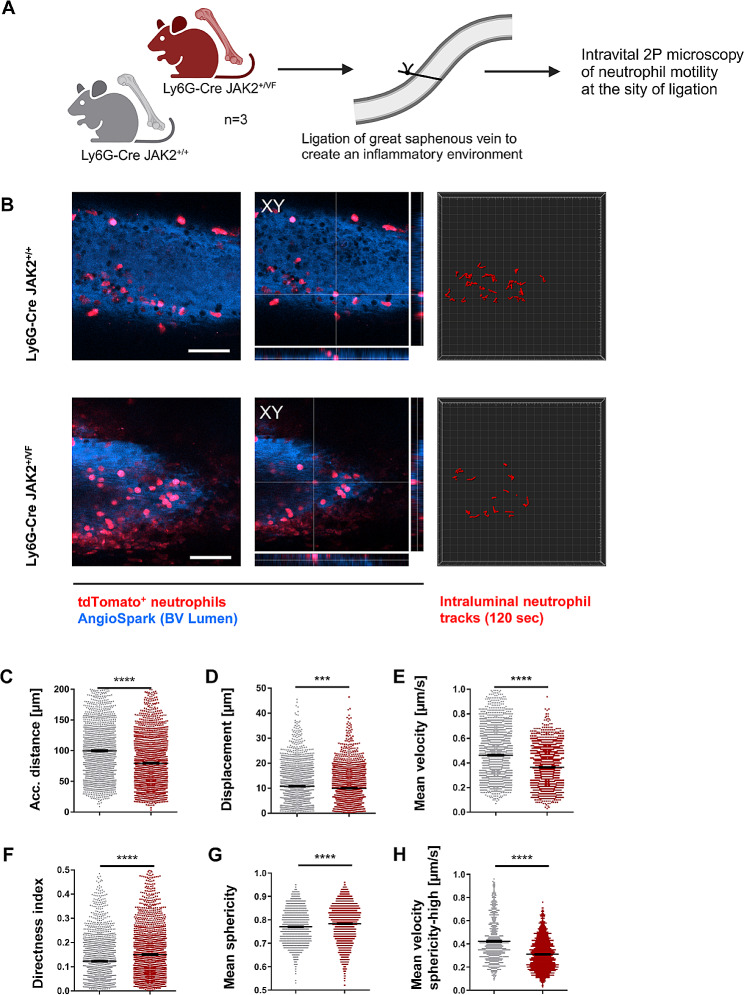
Methods: Ly6G-Cre JAK2-V617F and Ly6G-Cre CALRdel mice were generated. MPN parameters as blood counts, splenomegaly and bone marrow histology were compared to wild-type mice. Megakaryocyte differentiation was investigated using lineage-negative bone marrow cells upon in vitro incubation with TPO/IL-1β. Cytokine concentrations in serum of mice were determined by Mouse Cytokine Array. IL-1α expression in various hematopoietic cell populations was determined by intracellular FACS analysis. RNA-seq to analyse gene expression of inflammatory cytokines was performed in isolated neutrophils from JAK2-V617F and CALR-mutated mice and patients. Bioenergetics of neutrophils were recorded on a Seahorse extracellular flux analyzer. Cell motility of neutrophils was monitored in vitro (time lapse microscopy), and in vivo (two-photon microscopy) upon creating an inflammatory environment. Cell adhesion to integrins, E-selectin and P-selection was investigated in-vitro. Statistical analysis was carried out using GraphPad Prism. Data are shown as mean ± SEM. Unpaired, two-tailed t-tests were applied.

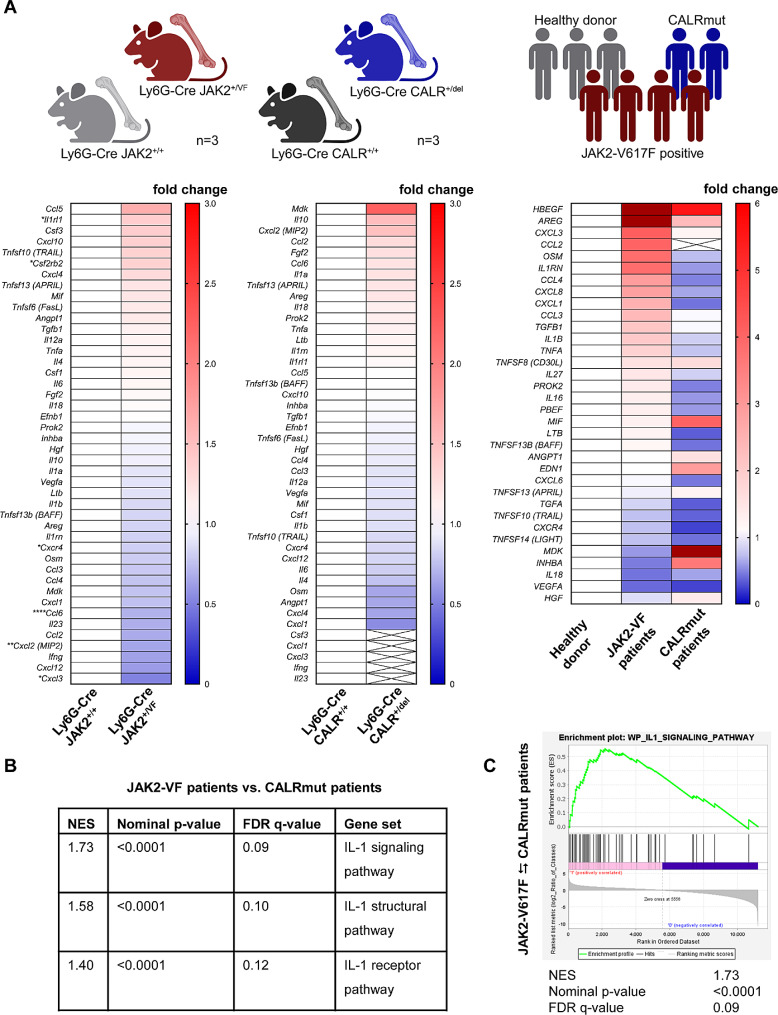
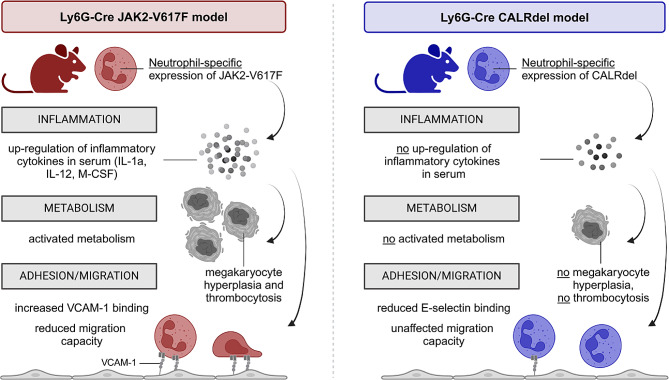
Results: Strikingly, neutrophil-specific expression of JAK2-V617F, but not CALRdel, was sufficient to induce pro-inflammatory cytokines including IL-1 in serum of mice. RNA-seq analysis in neutrophils from JAK2-V617F mice and patients revealed a distinct inflammatory chemokine signature which was not expressed in CALR-mutant neutrophils. In addition, IL-1 response genes were significantly enriched in neutrophils of JAK2-V617F patients as compared to CALR-mutant patients. Thus, JAK2-V617F positive neutrophils, but not CALR-mutant neutrophils, are pathogenic drivers of inflammation in MPN. In line with this, expression of JAK2-V617F or CALRdel elicited a significant difference in the metabolic phenotype of neutrophils, suggesting a stronger inflammatory activity of JAK2-V617F cells. Furthermore, JAK2-V617F, but not CALRdel, induced a VLA4 integrin-mediated adhesive phenotype in neutrophils. This resulted in reduced neutrophil migration in vitro and in an inflamed vessel. This mechanism may contribute to the increased thrombotic risk of JAK2-V617F patients compared to CALR-mutant individuals.

Conclusions: Taken together, our findings highlight genotype-specific differences in MPN-neutrophils that have implications for the differential pathophysiology of JAK2-V617F versus CALR-mutant disease.

Keywords: CALR mutations; Inflammation; JAK2-V617F; MPN; Neutrophils.


Conflict of interest statement

D.B.L. works as a drug safety physician for Infectopharm. All other authors declare no conflict of interest.

Figures

Fig. 1
Fig. 1
Neutrophil-specific expression of JAK2-V617F, but not CALRdel, induces thrombocytosis and megakaryocyte hyperplasia. (A-F) White blood cell (WBC) count, neutrophil (NEUT) count, spleen weight, red blood cell (RBC) count, hematocrit, and platelet (PLT) count of Ly6G-Cre JAK2+/+, JAK2+/VF, CALR+/+ and CALR+/del mice (each n = 14). (G) Representative hematoxylin-eosin staining of bone marrow sections of JAK2+/+ (n = 5), JAK2+/VF (n = 3), CALR+/+ (n = 8) and CALR+/del mice (n = 10). (H) Megakaryocyte progenitor (MKP) counts in bone marrow of Ly6G-Cre JAK2+/+ (n = 5), JAK2+/VF (n = 5), CALR+/+ (n = 7) and CALR+/del mice (n = 7) shown as fold change versus control. (I) Quantitative analysis (performed in a blinded fashion) of megakaryocytes (MKs) in bone marrow of Ly6G-Cre JAK2+/+, JAK2+/VF, CALR+/+ and CALR+/del mice in 200x high-power fields (HPF) showing numbers of MKs/HPF as fold change versus control. Data are shown as mean ± SEM. **p ≤ 0.01, ***p ≤ 0.001 (unpaired, two-tailed t-test)
Fig. 2
Fig. 2
Neutrophil-specific expression of JAK2-V617F, but not CALRdel, up-regulates inflammatory cytokines. (A) Cartoon depicting the experimental design to study serum cytokine concentrations in JAK2+/VF and CALR+/del mice in comparison to their corresponding WT controls. Cytokine protein concentrations in serum of Ly6G-Cre JAK2+/+ (n = 6) and JAK2+/VF mice (n = 6), and in serum of Ly6G-Cre CALR+/+ (n = 8) and CALR+/del mice (n = 10) were analyzed by Eve Technologies, Canada (Mouse Cytokine Array/Chemokine Array 32-Plex, duplicate testing). Created with Biorender.com. (B) Bar graphs of significantly elevated serum cytokine concentrations of IL-1α, IL-12(p40) and M-CSF in Ly6G-Cre JAK2+/VF mice. Data are shown as median ± IQR. *p ≤ 0.05 (unpaired, two-tailed t-test). (C) IL-1β induced megakaryocytic differentiation of lineage-negative cells isolated from bone marrow. Left and middle panel: Impact of IL-1β (25 ng/ml) on the number of formed immature (CD41+) and mature (CD41+ CD42d+) megakaryocytes upon TPO-driven differentiation of lineage-negative cells isolated from bone marrow of Ly6G-Cre JAK2+/+ and JAK2+/VF mice (each n = 4). Data are shown as mean ± SEM. *p  0.05 (unpaired, two-tailed t-test). Right panel: Representative images of megakaryocytes differentiated from lineage-negative bone marrow cells isolated from Ly6G-Cre JAK2+/+ and JAK2+/VF mice at baseline and upon four-day TPO-driven differentiation with or without IL-1β (n = 2). (D) Neutrophil-specific expression of JAK2-V617F increases IL-1α expression in megakaryocyte progenitors (MKP). Intracellular staining for IL-1α levels in various hematopoietic cell populations using anti-IL-1α antibody and isotype control antibody, respectively was performed as described under Supplemental Methods. Mean fluorescence intensity (MFI) was measured by flow cytometry. The specific MFI (MSFI) was calculated by subtracting the MFI of the isotype control from the MFI of the anti-IL-1α antibody stained sample. Data are shown as mean ± SEM. *p ≤ 0.05 (unpaired, two-tailed t-test with Welch correction). Cartoon created with Biorender.com
Fig. 3
Fig. 3
RNA-seq in granulocytes from JAK2-V617F and CALR-mutated mice and patients shows distinct inflammatory cytokine signatures (A) Left and middle panel: RNA-seq of granulocytes obtained from Ly6G-Cre JAK2+/+, JAK2+/VF, CALR+/+ and CALR+/del mice (each n = 3) was performed by GENEWIZ Inc. (Leipzig, Germany). Using DESeq2, a comparison of gene expression between the JAK2+/+ versus JAK2+/VF and CALR+/+ versus CALR+/del groups of samples was performed. The heatmaps represent fold changes in mean normalized counts of cytokine RNA abundances relative to the WT controls. Left panel: Ly6G-Cre JAK2+/+ versus JAK2+/VF mice; middle panel: Ly6G-Cre CALR+/+ versus CALR+/del mice. *adjusted p-value ≤ 0.05, **adjusted p-value ≤ 0.01, ****adjusted p-value ≤ 0.0001; right panel: RNA-seq was performed on peripheral blood granulocytes isolated from JAK2-V617F positive (n = 4), healthy donors (n = 3) and CALR-mutated (n = 2) patients by GENEWIZ Inc. (Leipzig, Germany). Using DESeq2, a comparison of RNA expression between JAK2-V617F positive patients versus age-matched healthy donors and CALR-mutated patients versus healthy donors was performed. The heatmaps depict fold changes of mean normalized counts of cytokine RNA abundances relative to the healthy donor controls. Cartoon created with Biorender.com. (B) GSEA of IL-1 pathways in granulocytes isolated from JAK2-V617F positive patients compared to CALR-mutated patients. Positive NES in the heatmap indicate substantial (FDR q-values < 0.15) enrichment in granulocytes from JAK2-V617F positive patients. The values point out NES for each pathway. All gene sets were obtained from the GSEA website (UC San Diego and Broad Institute; https://www.gsea-msigdb.org). (C) RNA-seq data from JAK2-V617F positive patients (n = 4 consecutive patients) compared to CALR-mutated (n = 2 consecutive patients) patients is tested for enrichment of genes related to the “Interleukin 1 Signaling Pathway” by Gene Set Enrichment Analysis (GSEA). GSEA was performed using the GSEAv4.3.2 (UC San Diego and Broad Institute; https://www.gsea-msigdb.org). Comparisons exhibiting a p-value < 0.05 and FDR q-value < 0.15 were considered significant. The enrichment map was used for visualization of the GSEA results. Normalized Enrichment Score (NES) and False Discovery Rate (FDR) p-values were calculated upon 10,000 gene set permutations
Fig. 4
Fig. 4
Pan-hematopoietic expression of JAK2-V617F up-regulates pro-inflammatory cytokines in neutrophils and hematopoietic progenitors (A) Cartoon depicting the experimental design to study gene expression signatures in neutrophils and intracellular IL-1α expression in Vav-Cre JAK2+/VF mice in comparison to their corresponding WT controls. Created with Biorender.com. (B) RNA-seq of granulocytes obtained from Vav-Cre JAK2+/VF and JAK2+/+ mice (each n = 4) was performed by GENEWIZ Inc. (Leipzig, Germany). Using DESeq2, a comparison of gene expression between the Vav-Cre JAK2+/+ versus JAK2+/VF groups of samples was performed. The heatmaps represent fold changes in mean normalized counts of cytokine RNA abundances relative to the WT controls. Vav-Cre JAK2+/+ versus JAK2+/VF mice; *adjusted p-value ≤ 0.05, **adjusted p-value ≤ 0.01, ****adjusted p-value ≤ 0.0001 (C) GSEA of “Hallmark Inflammatory Response” genes in granulocytes isolated from Vav-Cre JAK2+/VF and JAK2+/+ mice. The enrichment map was used for visualization of the GSEA results. Normalized Enrichment Score (NES) and False Discovery Rate (FDR) p-values were calculated upon 10,000 gene set permutations. The positive NES of 1.39 in the figure indicates substantial (FDR q-value = 0.03; nominal p-value = 0.02) enrichment in genes linked with the inflammatory response. The “Hallmark Inflammatory Response” gene set was obtained from the GSEA website (UC San Diego and Broad Institute; https://www.gsea-msigdb.org). (D, E, F) Intracellular staining for IL-1α levels in various hematopoietic cell populations using anti-IL-1α antibody and isotype control antibody, respectively was performed as described under Supplemental Methods. Mean fluorescence intensity (MFI) was measured by flow cytometry. The specific MFI (MSFI) was calculated by subtracting the MFI of the isotype control from the MFI of the anti-IL-1α antibody stained sample. Data are shown as mean ± SEM. *p ≤ 0.05 (unpaired, two-tailed t-test with Welch correction)
Fig. 5
Fig. 5
Neutrophils isolated from Ly6G-Cre JAK2+/VF mice display enhanced metabolic activity. (A) Cartoon depicting the experimental design to study metabolic activity in neutrophils isolated from Ly6G-Cre JAK2+/VF and CALR+/del. Created with Biorender.com. (B) Glycolysis stress test (GST) and (C) mitochondrial stress test (MST) analyzing extracellular acidification rate (ECAR), as a surrogate for aerobic glycolysis, and oxygen consumption rate (OCR), as a surrogate for oxidative phosphorylation in neutrophils isolated from Ly6G-Cre JAK2+/VF and Ly6G-Cre CALR+/del (n = 3 with 3–6 technical replicates) were recorded in real-time upon sequential injection of compounds/inhibitors as described in the Supplemental Methods. The data presented were normalized to the background (phase 1 for GST and phase 4 for MST). Based on these and the corresponding wild-type data (Supplemental Fig. 7A and B), the metabolic parameters glycolysis (D), glycolytic capacity (E), basal respiration (F), maximal respiration (G), and the OCR/ECAR ratio as a surrogate for the balance between glycolysis and OXPHOS (H) were calculated and presented as the log2 fold change (log2 FC) of each individual relative to the respective wild-type average. (I) The baseline overall metabolic phenotype was calculated from (B and C) and plotted as an ECAR/OCR map. Data are shown as mean ± SEM. *p ≤ 0.05, **p ≤ 0.01, ***p ≤ 0.001 (unpaired, two-tailed t-test). Abbreviations: OCR, oxygen consumption rate; ECAR, extracellular acidification rate; 2DG, 2-deoxyglucose; FCCP, Carbonyl cyanide-p-trifluoromethoxyphenylhydrazone; AA/R, Antimycin A/Rotenone
Fig. 6
Fig. 6
Neutrophil-specific JAK2-V617F, but not CALRdel, changes the migration behavior of neutrophils in vitro. (A) Scheme of cell migration parameters investigated. (adapted from Zengel et al.; [68]. Accumulated distance from origin to end position is indicated as a red line. Displacement as minimum distance between origin and end position is depicted with the blue dashed line. Mean velocity is calculated from the ratio of accumulated distance and time. Directness as ratio of displacement and accumulated distance indicates a measure of how direct a cell migrates from its origin to its end position. A directness value tending towards 1 indicates a straight migration from the start to the end position. Thus, an increase in directness index indicates that cells more directly migrate from their origin to their end position. (B) Cartoon depicting the experimental design to study migration characteristics in neutrophils isolated from Ly6G-Cre JAK2+/VF and CALR+/del mice in comparison to their corresponding WT controls. Created with Biorender.com. (C-F) Microfluidic chambers were coated with recombinant mouse ICAM-1 and VCAM-1. tdTomato expressing neutrophils isolated from Ly6G-Cre JAK2+/VF and JAK2+/+ mice were seeded and time lapse recording of cell migration was started. Neutrophils isolated (200 tdTomato+ neutrophils investigated) from Ly6G-Cre JAK2+/+ and JAK2+/VF mice (each n = 4) exhibited the following migration parameters: accumulated distance of 96.2 μm compared to 81.9 μm, displacement of 13.6 μm compared to 9.3 μm, mean velocity of 0.026 μm/sec compared to 0.022 μm/sec, and directness index of 0.14 compared to 0.11. (G-J) Migration parameters obtained in 150 tdTomato+ neutrophils investigated in Ly6G-Cre CALR+/+ and CALR+/del mice (each n = 3). Data are shown as mean ± SEM. **p ≤ 0.01, ****p ≤ 0.0001 (unpaired, two-tailed t-test)
Fig. 7
Fig. 7
JAK2-V617F suppresses the motility of neutrophils in an inflammatory environment. (A) Cartoon depicts experimental design to investigate neutrophil intraluminal crawling after partial ligation of the great saphenous vein (GSV) using intravital 2P microscopy. Created with Biorender.com. (B) To identify neutrophils (red) within the GSV from those localized in the surrounding connective tissue, AngioSPARK680 (blue) was applied intravenously. Imaging was started 20 min after applying partial ligation of the GSV, two examples from imaging after 80 min are shown for Ly6G-Cre JAK2+/+ (upper panels) and JAK2+/VF (lower panels) are shown. Left: Image projection of tree z-planes spanning 15 μm. Scale bar, 50 μm. Middle: XYZ sections of an example neutrophil on the vessel wall. Right: Neutrophil motion tracks of 120 s of imaging each. (C-H) Measurements of in vivo two-photon microscopy showing accumulated distance, displacement, mean velocity, directness index, and mean sphericity of 2,339 tdTomato+ neutrophils from Ly6G-Cre JAK2+/+ and 2,334 tdTomato+ neutrophils from Ly6G-Cre JAK2+/VF mice (n = 3 per condition) as well as the mean velocity of sphericityhigh neutrophils. Neutrophils isolated exhibited the following migration parameters (JAK2+/+ compared to JAK2+/VF): accumulated distance of 99.7 μm compared to 79.4 μm, displacement of 10.8 μm compared to 10.0 μm, mean velocity of 0.464 μm/sec compared to 0.365 μm/sec, and directness index of 0.12 compared to 0.15. Data are shown as mean ± SEM. ***p ≤ 0.001, ****p ≤ 0.0001 (unpaired, two-tailed t-test)
Fig. 8
Fig. 8
Adhesion and soluble ligand binding characteristic of JAK2-V617F and CALRdel-expressing neutrophils (A) Cartoon depicting the experimental design to study adhesion characteristics in neutrophils isolated from Ly6G-Cre JAK2+/VF and CALR+/del mice and from Vav-Cre CALR+/del mice in comparison to their corresponding WT controls. Created with Biorender.com. (B-D) Expression of CD18 (β2 integrin), CD29 (β1 integrin) and CD162 (PSGL-1) was evaluated as MSFI and calculated as fold change versus control. (B, C) Expression of CD18 (β2 integrin) and CD29 (β1 integrin) of tdTomato+ cells of Ly6G-Cre JAK2+/+ (n = 10), JAK2+/VF (n = 10), CALR+/+ (n = 7) and CALR+/del mice (n = 7). (D) Expression of CD162 (PSGL-1) of tdTomato+ cells of Ly6G-Cre JAK2+/+ (n = 11), JAK2+/VF (n = 11), CALR+/+ (n = 7) and CALR+/del mice (n = 7). (E, F) Static adhesion of tdTomato+ cells isolated from JAK2+/+ (n = 11), JAK2+/VF (n = 11), CALR+/+ (n = 9) and CALR+/del mice (n = 10) on Fc-free ICAM-1 and VCAM-1 coated plates. Static adhesion assays revealed significant differences in tdTomato+ neutrophil adhesion to VCAM-1 between JAK2+/+ and JAK2+/VF mice (JAK2-V617F: 1.1 ± 0.038; WT: 1.0 ± 0.003; p = 0.0163; n = 11). No differences were shown in static adhesion to ICAM-1. (G) Soluble ligand binding to Fc-tagged VCAM-1 of tdTomato+ cells isolated from JAK2+/+ (n = 10), JAK2+/VF (n = 10), CALR+/+ (n = 9) and CALR+/del mice (n = 9). Fold change versus control analysis. Soluble ligand binding to VCAM-1/Fc was increased and significantly higher in tdTomato+ neutrophils of JAK2+/VF mice compared to their corresponding WT control (1.77 ± 0.312; WT: 1.0 ± 0.044; p = 0.0258; n = 10). *p ≤ 0.05 (unpaired, two-tailed t-test). (H) Left and middle panel: Static adhesion of sorted tdTomato+ neutrophils isolated from JAK2+/VF (n = 9) and CALR+/del (n = 10) mice to Fc-free E-selectin coated plates in comparison to their corresponding JAK2+/+ (n = 9) and CALR+/+ (n = 10) controls. Right panel: Neutrophils harvested from Vav-Cre CALR+/del mice (n = 8) showed significantly impaired adhesion to immobilized E-selectin compared to Vav-Cre CALR+/+ (n = 7) mice (0.91 ± 0.036; WT: 1.00 ± 0.016; p = 0.0443). (I) Binding to soluble Fc-tagged E-selectin of granulocytes isolated from Ly6G-Cre CALR+/+ (n = 10), Ly6G-Cre CALR+/del (n = 9) as well as Vav-Cre CALR+/+ (n = 7) and Vav-Cre CALR+/del (n = 7) mice, respectively shown as fold change versus control analysis. Binding of tdTomato+ granulocytes isolated from Ly6G-Cre CALR+/del mice to soluble E-selectin was found significantly decreased compared to Ly6G-Cre CALR+/+ mice (0.69 ± 0.063; WT: 1.00 ± 0.068; p = 0.0039). Binding to soluble Fc-tagged E-selectin (sCD62E) of bone marrow granulocytes derived from Vav-Cre CALR+/del mice was also found significantly reduced in comparison to corresponding WT mice (0.83 ± 0.043; WT: 1.00 ± 0.005; p = 0.0018). **p ≤ 0.01 (unpaired, two-tailed t-test) Exclusion of one outlier in Ly6G-Cre CALR+/del and Vav-Cre CALR+/del mice, respectively with the Grubbs’ outlier test (Ly6G-Cre CALR+/del: G = 2.324, α = 0.05; Vav-Cre CALR+/del: G = 2.271, α = 0.05). (J) Left and middle panel: Static adhesion of sorted tdTomato+ neutrophils isolated from Ly6G-Cre JAK2+/VF (n = 9) and CALR+/del (n = 10) mice to Fc-free P-selectin coated plates in comparison to their corresponding JAK2+/+ (n = 9) and CALR+/+ (n = 10) controls. Right panel: Static adhesion of isolated granulocytes from Vav-Cre CALR+/del (n = 8) and CALR+/+ (n = 7) mice to Fc-free P-selectin coated plates (0.91 ± 0.04; WT: 1.00 ± 0.037). (K) Binding to soluble P-selectin/Fc (sCD62P) of neutrophils isolated from Ly6G-Cre CALR+/del (n = 10) and Vav-Cre CALR+/del (n = 8) mice compared with Ly6G-Cre CALR+/+ (n = 10) and Vav-Cre CALR+/+ (n = 8) control mice, respectively. Exclusion of one outlier in Vav-Cre CALR+/del mice with the Grubbs’ outlier test (G = 2.367, α = 0.05). Data are shown as mean ± SEM. p ≤ 0.05, **p ≤ 0.01 (unpaired, two-tailed t-test)
Fig. 9
Fig. 9
Graphical summary of proposed mechanisms of action of JAK2-V617F in neutrophils. Ly6G-Cre JAK2+/VF mice exhibit distinct features regarding inflammation, metabolism, adhesion, and migration compared to Ly6G-Cre CALR+/del mice. Created with Biorender.com

Similar articles

Cited by

References

    1. Kralovics R, et al. A gain-of-function mutation of JAK2 in Myeloproliferative disorders. N Engl J Med. 2005;352(17):1779–90. doi: 10.1056/NEJMoa051113. - DOI - PubMed
    1. Levine RL, et al. Activating mutation in the tyrosine kinase JAK2 in polycythemia vera, essential thrombocythemia, and myeloid metaplasia with myelofibrosis. Cancer Cell. 2005;7(4):387–97. doi: 10.1016/j.ccr.2005.03.023. - DOI - PubMed
    1. James C, et al. A unique clonal JAK2 mutation leading to constitutive signalling causes polycythaemia vera. Nature. 2005;434(7037):1144–8. doi: 10.1038/nature03546. - DOI - PubMed
    1. Nangalia J, et al. Somatic CALR mutations in Myeloproliferative neoplasms with nonmutated JAK2. N Engl J Med. 2013;369(25):2391–405. doi: 10.1056/NEJMoa1312542. - DOI - PMC - PubMed
    1. Klampfl T, et al. Somatic mutations of Calreticulin in Myeloproliferative Neoplasms. N Engl J Med. 2013;369(25):2379–90. doi: 10.1056/NEJMoa1311347. - DOI - PubMed

Publication types