. 2024 Jul 29;379(1906):20230224.
doi: 10.1098/rstb.2023.0224. Epub 2024 Jun 10.

Synapse-specific structural plasticity that protects and refines local circuits during LTP and LTD

Affiliations

Synapse-specific structural plasticity that protects and refines local circuits during LTP and LTD

Kristen M Harris et al. Philos Trans R Soc Lond B Biol Sci. .

Abstract

Synapses form trillions of connections in the brain. Long-term potentiation (LTP) and long-term depression (LTD) are cellular mechanisms vital for learning that modify the strength and structure of synapses. Three-dimensional reconstruction from serial section electron microscopy reveals three distinct pre- to post-synaptic arrangements: strong active zones (AZs) with tightly docked vesicles, weak AZs with loose or non-docked vesicles, and nascent zones (NZs) with a postsynaptic density but no presynaptic vesicles. Importantly, LTP can be temporarily saturated preventing further increases in synaptic strength. At the onset of LTP, vesicles are recruited to NZs, converting them to AZs. During recovery of LTP from saturation (1-4 h), new NZs form, especially on spines where AZs are most enlarged by LTP. Sentinel spines contain smooth endoplasmic reticulum (SER), have the largest synapses and form clusters with smaller spines lacking SER after LTP recovers. We propose a model whereby NZ plasticity provides synapse-specific AZ expansion during LTP and loss of weak AZs that drive synapse shrinkage during LTD. Spine clusters become functionally engaged during LTP or disassembled during LTD. Saturation of LTP or LTD probably acts to protect recently formed memories from ongoing plasticity and may account for the advantage of spaced over massed learning. This article is part of a discussion meeting issue 'Long-term potentiation: 50 years on'.

Keywords: long-term depression; long-term potentiation; spaced learning; synapse; ultrastructure.


Conflict of interest statement

We declare we have no competing interests.

Figures

Saturation and recovery of LTP in S. radiatum of hippocampal CA1 from adult rats.
Figure 1.
Saturation and recovery of LTP in stratum radiatum of hippocampal CA1 from adult rats. (a) The first two bouts of theta-burst stimulation (1 TBS = 8 trains at 30 s intervals of 10 bursts at 5 Hz with 4 pulses/burst at 100 Hz, delivered at approximately half-maximal response of the field excitatory postsynaptic potential (fEPSP) determined prior to baseline stimulation, red arrowheads) demonstrate saturation of LTP that lasts for at least 60 min (yellow and blue bars, eight slices with error bars). (b) LTP recovery at 180 min (22 slices with error bars). (c) Timing of the recovery of LTP in rat and mouse hippocampal slices (n = number of slices). Adapted from [49].
Evidence that synapse enlargement is silent during the recovery of capacity for LTP.
Figure 2.
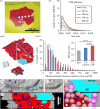
Evidence that synapse enlargement is silent during the recovery of capacity for LTP. (a) LTP demonstrated from within-slice experiments. In separate experiments, the slices were fixed at 5 min, 30 min or 2 h after the induction of LTP. (Inset shows electrode positions in CA1, stratum radiatum of an acute slice. TBS was delivered to Stim. 1 or Stim. 2, to counterbalance for distance from area CA3. The tissue was sampled in the vicinity of the two stimulating electrodes to obtain synapses that underwent TBS and induction of LTP versus control stimulation in the same slice.) (b) Electron microscopy image illustrating a dendrite (yellow) and postsynaptic density (PSD, red). (c) Three-dimensional reconstruction of dendrite (yellow) with PSD areas (red) in a region of high spine density. (d) PSD sizes in the LTP and control conditions when fixed at 5 min, 30 min or 2 h after the induction of LTP. PSDs were enlarged at 2 hr relative to all other conditions (p < 0.001). Control PSD area is on average smaller by 2 h as new small spines emerged during control stimulation. This small spine outgrowth was stalled in favour of PSD enlargement during LTP. (Adapted from [24,50].)
Evidence that nascent zone plasticity mediates the saturation and recovery of LTP.
Figure 3.
Evidence that nascent zone plasticity mediates the saturation and recovery of LTP. (a) Active zone (red) with docked (royal blue arrow), non-docked (white arrow), and reserve (green arrow) vesicles, and a PSD. (b, c) Nascent zone (aqua) has a PSD but no presynaptic vesicles above it. (d, e) Three-dimensional reconstructions of the synapse illustrated in ac. (f) Electron microscopy (EM) image illustrating synaptic vesicles that are tethered (green arrows) to a dense core vesicle (DCV). (g) DCVs are recruited from inter-bouton regions to synaptic boutons at 5 min after TBS (n = number of syn). (h) DCV at the edge of an AZ. (i) Plot of the number of DCVs that would be needed to convert a NZ to AZ by filling it with the tethered docked vesicles versus the number of NZs in the control or LTP conditions that would be fully converted to AZ if a DCV were to be recruited with tethered vesicles. (j) NZ area decreases by 30 min after LTP induction.( j) NZ size is re-elevated by 2 h after LTP induction. (l) NZ recovery at 2 h during LTP is greatest on spines with the largest AZ areas (Perf = in vivo controls). (Adapted from [50].)
Effects of LTP on strong versus weak active zones defined by the positioning of presynaptic vesicles.
Figure 4.
Effects of LTP on strong versus weak active zones defined by the positioning of presynaptic vesicles. (a–f) Strong active zones (sAZ) have tightly docked vesicles (purple). (g–j) Weak active zones (wAZ) have loosely docked (turquoise) or non-docked (light blue) vesicles. (Molecular tethering filaments are illustrated in yellow.) (c,d) Side view of three-dimensional tomogram illustrates presynaptic membrane surface (silver) with tight and loose docked vesicles and tethering filaments. Unbiased sampling frames for (e,f) tight and (i,j) loose or non-docked vesicles. (k) The density of tightly docked vesicles, but not loose or non-docked vesicles, increases in the tomographic nanodomains after LTP. (l–p) The length of the tethering filaments for both tight and loose docked vesicles was shortened at 2 h after LTP induction. (Adapted from [60].)
Relationship of strong versus weak AZ to AMPAR open response profiles and the effects of LTP on docked vesicle positions relative to nascent zones.
Figure 5.
Relationship of strong versus weak AZ to AMPAR open response profiles and the effects of LTP on docked vesicle positions relative to nascent zones. (a) Simulated glutamate release sites (white circles), stable (dark blue) and mobile (light blue) AMPARs across a PSD surface (red). (b) MCell model reveals a decrease in AMPAR activation with distance from release sites. (c(i)) The minimum distance from a docked vesicle to a nascent zone (c(ii)) increases from 200 nm in control to 250 nm by 2 h of LTP. (d) Dual-axis tilt tomography reveals docked vesicles (navy arrows) and (e) a vesicle making an omega figure resulting in a pore (yellow arrow). (f) Reconstruction through two serial sections (approx. 100 nm each) of an axon-spine interface (grey), with docked vesicles (blue) and pores scaled by opening size (yellow). (Virtual section thickness = 3 nm.) (g) In tomograms, strong active zones (sAZ) encompass regions with less than 50% drop in receptor response (100 nm) around vesicle docking sites. Weak AZs (wAZ) only have loose or non-docked vesicles (white translucent) that are in a position where they could eventually dock. NZs (turquoise) have no presynaptic vesicles. (a and b are adapted from [62] and cg are adapted from [50].)
Molecular mechanisms of NZ to AZ plasticity.
Figure 6.
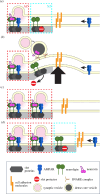
Molecular mechanisms of NZ to AZ plasticity. (a) Starting synapse with active (AZ) and nascent (NZ) zones. (b) LTP is induced, the spine enlarges (large black arrow), and a series of events are triggered resulting in (c) the capture of AMPAR to the previous NZ and the formation of a new AZ. (d) With time, a new NZ is created. See text for detailed descriptions.
Effects of LTP on sentinel spines and dendritic resources that enable maximum synapse enlargement and spine clustering.
Figure 7.
Effects of LTP on sentinel spines and dendritic resources that enable maximum synapse enlargement and spine clustering. (a) EM image and three-dimensional reconstruction of a 2 h control spine containing a tubule (tub) of SER (green). (b) EM image and three-dimensional reconstruction of a 2 h LTP spine containing a spine apparatus (SA). (c) About 12% of control spines have SER, distributed 50:50 between single tubules and spine apparatus, whereas by 2 h after the induction of LTP, the same frequency of spines contain SER, but more than 80% of them have an elaborate spine apparatus (SA). (d) Enlargement of PSDs on SER-containing spines following LTP. (e) EM image and three-dimensional reconstruction of spine without SER. (f) PSD enlargement on SER- spines following LTP. (g) EM image and three-dimensional reconstruction of a spine containing a polyribosome (PR). (h) PSD enlargement on PR containing spines following LTP. (i) Delineating spine clusters: sentinel, SER-containing, spine, in a high-density cluster contrasting with low-density cluster. (j) Quantifying SER branches in the dendritic shafts. (k) High-density spine cluster in the 2 h LTP condition. (l) Low-density spine cluster in the 2 h control condition. (m) Relationship between summed PSD area across spines in clusters versus shaft SER branches increases following LTP. (Adapted from [54].)
Model of structural synaptic plasticity during the saturation and recovery of LTP.
Figure 8.
Model of structural synaptic plasticity during the saturation and recovery of LTP.
Synaptic plasticity during saturation and recovery of the capacity for LTD.
Figure 9.
Synaptic plasticity during saturation and recovery of the capacity for LTD. (a) Two-photon imaging of LTD-associated dendritic spine shrinkage induced by low-frequency glutamate uncaging (LFU; 90 pulses of 0.2 mS at 0.1 Hz, adapted from [136]). (b) Demonstration of the saturation of LTD-associated dendritic spine shrinkage: a second LFU fails to induce further spine shrinkage. (c) Model of LTD involving weak active zones, strong active zones, nascent zones and loss of dendritic spines that results in low-density spine clusters or no spine clustering.

References

    1. Ramón Y Y, Cajal S. 1891. Sur la structure de l’ecorce cerebrale de quelques mammiferes. Cellule 7 , 124–176.
    1. Ramón Y, Cajal S. 1896. Las espinas colaterales de las celulas del cerebro tenidas por el azul de metileno. Revista Trimestral Microgratica 1 , 123–136.
    1. Kasai H, Ziv NE, Okazaki H, Yagishita S, Toyoizumi T. 2021. Spine dynamics in the brain, mental disorders and artificial neural networks. Nat. Rev. Neurosci. 22 , 407–422. (10.1038/s41583-021-00467-3) - DOI - PubMed
    1. Bliss TV, Lomo T. 1973. Long-lasting potentiation of synaptic transmission in the dentate area of the anaesthetized rabbit following stimulation of the perforant path. J. Physiol. 232 , 331–356. (10.1113/jphysiol.1973.sp010273) - DOI - PMC - PubMed
    1. Lynch G, Kessler M, Arai A, Larson J. 1990. The nature and causes of hippocampal long-term potentiation. Prog. Brain Res. 83 , 233–250. (10.1016/s0079-6123(08)61253-4) - DOI - PubMed

MeSH terms

LinkOut - more resources