. 2024 Jul 29;379(1906):20230230.
doi: 10.1098/rstb.2023.0230. Epub 2024 Jun 10.

Differential effectiveness of dietary zinc supplementation with autism-related behaviours in Shank2 knockout mice

Affiliations

Differential effectiveness of dietary zinc supplementation with autism-related behaviours in Shank2 knockout mice

Kevin Lee et al. Philos Trans R Soc Lond B Biol Sci. .

Abstract

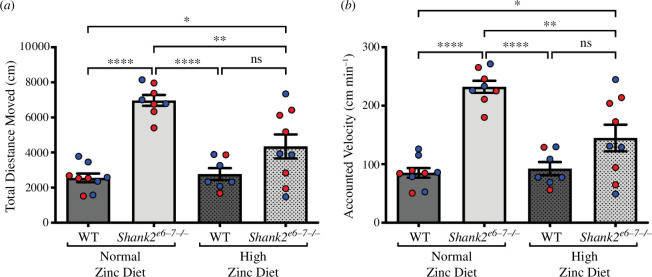
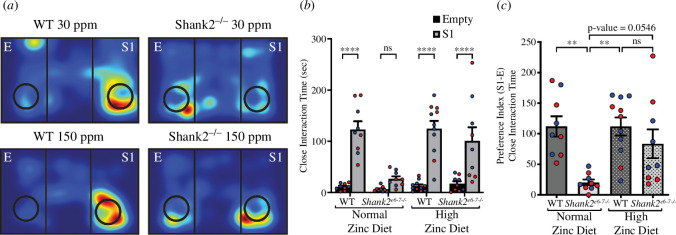
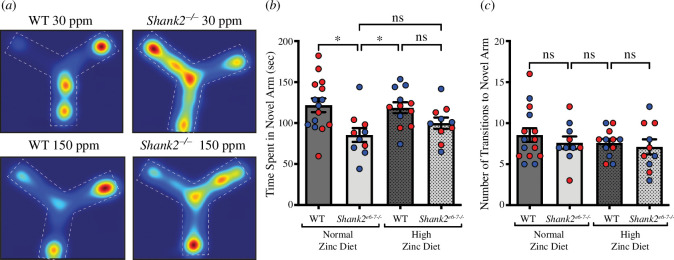
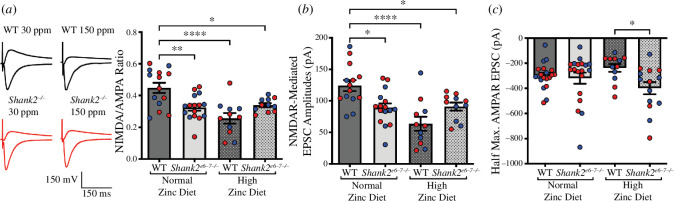
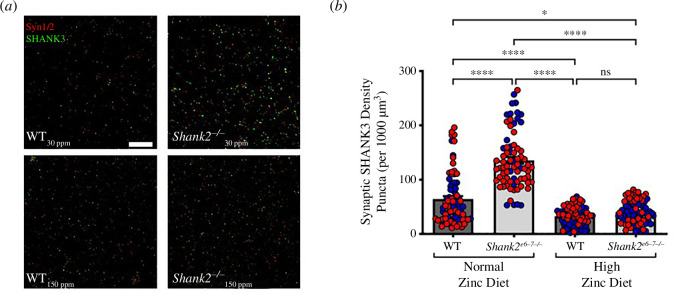
The family of SHANK proteins have been shown to be critical in regulating glutamatergic synaptic structure, function and plasticity. SHANK variants are also prevalent in autism spectrum disorders (ASDs), where glutamatergic synaptopathology has been shown to occur in multiple ASD mouse models. Our previous work has shown that dietary zinc in Shank3-/- and Tbr1+/- ASD mouse models can reverse or prevent ASD behavioural and synaptic deficits. Here, we have examined whether dietary zinc can influence behavioural and synaptic function in Shank2-/- mice. Our data show that dietary zinc supplementation can reverse hyperactivity and social preference behaviour in Shank2-/- mice, but it does not alter deficits in working memory. Consistent with this, at the synaptic level, deficits in NMDA/AMPA receptor-mediated transmission are also not rescued by dietary zinc. In contrast to other ASD models examined, we observed that SHANK3 protein was highly expressed at the synapses of Shank2-/- mice and that dietary zinc returned these to wild-type levels. Overall, our data show that dietary zinc has differential effectiveness in altering ASD behaviours and synaptic function across ASD mouse models even within the Shank family. This article is part of a discussion meeting issue 'Long-term potentiation: 50 years on'.

Keywords: autism; shank; synapse; zinc.


Conflict of interest statement

We declare we have no competing interests.

Figures

Hyperactivity is reversed by high dietary zinc in Shank2−/− mice.
Figure 1.
Hyperactivity is reversed by high dietary zinc in Shank2−/− mice. (a) Bar graph of total distance moved in WT (dark grey) and Shank2−/− (light grey) mice. Shank2−/− mice moved significantly further than WT mice. High dietary zinc reversed this phenotype, with Shank2−/− mice movement not significantly higher than WT mice fed high dietary zinc but now significantly lower than Shank2−/− mice fed the normal zinc diet. (b) Bar graph of the velocity of movement in WT (dark grey) and Shank2−/− (light grey) mice. Shank2−/− mice moved significantly faster than WT mice when on a normal zinc diet; however, high dietary zinc reversed this phenotype, with Shank2−/− mice velocity no longer significantly higher than WT mice fed high dietary zinc but now significantly lower than Shank2−/− mice fed the normal zinc diet. Each dot represents an individual animal. WT 30 ppm mice: n = 9; Shank2−/− 30 ppm mice: n = 8; WT 150 ppm mice: n = 7; and Shank2−/− 150 ppm mice: n = 9. Blue data points are male mice and red data points are female mice. All data were analysed using one-way ANOVA with Tukey’s post hoc test. ns = not significant. *p < 0.05, **p < 0.01, ****p < 0.0001.
Social interaction and social preference ASD phenotypes are reversed by high dietary zinc in Shank2−/− mice.
Figure 2.
Social interaction and social preference ASD phenotypes are reversed by high dietary zinc in Shank2−/− mice. (a) Heat maps representing example movements of animals during the social interaction test. E: empty cup, S1: stranger 1. (b) Bar graph of social interaction times in WT (dark grey) and Shank2−/− (light grey) mice. Shank2−/− mice showed no preference between the stranger mouse and the empty cup in contrast to WT mice,which preferred the stranger mouse interaction. With high dietary zinc, social preference for interaction with the stranger mouse was restored in Shank2−/− mice. (c) Bar graph of social preference in WT (dark grey) and Shank2−/− (light grey) mice. Again, Shank2−/− mice showed significantly less preference for close interaction time with the stranger mouse compared with WT mice, and high dietary zinc reversed this phenotype such that social preference was now significantly higher than in Shank2−/− mice fed normal dietary zinc and no longer significantly different from WT. Each data point represents an individual animal (WT 30 ppm mice = 9, Shank2−/− 30 ppm mice = 9, WT 150 ppm mice = 11, Shank2−/− 150 ppm mice = 9). Blue data points are male mice and red data points are female mice. Data were analysed using (b) two-way analysis of variance (ANOVA) with Šídák’s post hoc test and (c) one-way ANOVA with Tukey’s post hoc test. ns = not significant. **p < 0.01, ***p < 0.001, ****p < 0.0001.
Y-maze testing shows a deficit in working memory in Shank2−/− mice that are not rescued by dietary zinc
Figure 3.
Y-maze testing shows a deficit in working memory in Shank2−/− mice that are not rescued by dietary zinc. (a) Heat maps representing example movements of animals during the Y-maze test. (b) Bar graph of time spent in the novel arm of the Y-maze in WT (dark grey) and Shank2−/− (light grey) mice. Shank2−/− mice spent significantly less time in the novel arm compared with WT mice. With high dietary zinc, Shank2−/− mice remained not significantly different from Shank2−/− mice fed a normal zinc diet. (c) No significant differences were observed across the WT and Shank2−/− mice with respect to the number of transitions into the novel arm of the Y-maze. Each data point represents an individual animal (WT 30 ppm mice = 15, Shank2−/− 30 ppm mice = 10, WT 150 ppm mice = 12, Shank2−/− 150 ppm mice = 10). Blue data points are male mice and red data points are female mice. All data were analysed using one-way ANOVA with Tukey’s post hoc test. ns = not significant. *p < 0.05.
Electrophysiological analysis of NMDA/AMPA receptor-mediated currents in WT and Shank2−/− mice
Figure 4.
Electrophysiological analysis of NMDA/AMPA receptor-mediated currents in WT and Shank2−/− mice. (a) NMDA/AMPA EPSC ratios in WT and Shank2−/− mice fed normal (30 ppm) and high (150 ppm) dietary zinc. The NMDA/AMPA ratio was significantly decreased in Shank2−/− mice compared with WT controls, and high dietary zinc failed to return the ratio back to control levels. (b) NMDAR-mediated EPSC amplitudes at a stimulus intensity that stably evoked 200–350 pA AMPAR-mediated EPSC responses. NMDAR-mediated EPSC amplitudes were significantly reduced in Shank2−/− mice fed with a normal zinc diet (30 ppm) compared with WT controls and were not rescued by a high zinc diet (150 ppm). WT 30 ppm: 14 cells/6 mice, Shank2−/− 30 ppm: 16 cells/8 mice, WT 150 ppm: 11 cells/5 mice, Shank2−/− 150 ppm: 11 cells/6 mice (a) and (b). Data were analysed using one-way ANOVA with Tukey’s post hoc test for (a) and (b). (c) Half-maximal AMPAR EPSC amplitudes are not significantly altered in Shank2−/− mice with either high zinc diet. WT 30 ppm: 20 cells/9 mice, Shank2−/− 30 ppm: 19 cells/9 mice, WT 150 ppm: 12 cells/6 mice, and Shank2−/− 150 ppm: 14 cells/7 mice. Blue data points are male mice and red data points are female mice. Data were analysed using the non-parametric Kruskal–Wallis test. ns = not significant. *p < 0.05, **p < 0.01, ****p < 0.001.
Immunohistochemical analysis of SHANK3 expression in WT and Shank2−/− mice
Figure 5.
Immunohistochemical analysis of SHANK3 expression in WT and Shank2−/− mice. (a) Example confocal images of synapsin (red) and SHANK3 (green) hippocampal puncta expression in WT and Shank2−/− mice fed normal or high zinc diet. Scale bar = 10 µm. (b) Bar graph of the analysis of synaptic SHANK3 puncta density in WT (dark grey) and Shank2−/− (light grey) mice. Shank2−/− mice on a normal zinc diet showed significantly higher synaptic SHANK3 density compared with WT. Increasing dietary zinc resulted in a significant decrease in synaptic SHANK3 density in Shank2−/− mice. WT 30 ppm mice: n = 6; Shank2−/− 30 ppm mice: n = 6; WT 150 ppm mice: n = 6; and Shank2−/− 150 ppm mice: n = 6. Note that puncta were analysed from an average of three slices per animal with an average of four images taken per slice. Blue data points are male mice and red data points are female mice. Statistical differences were calculated with the D’Agostino and Pearson normality test for normally distributed data and with the Kruskal–Wallis (one-way ANOVA) test for multiple comparisons. ns = not significant, *p < 0.05, ****p < 0.0001.

Similar articles

Cited by

References

    1. Berkel S, et al. . 2010. Mutations in the SHANK2 synaptic scaffolding gene in autism spectrum disorder and mental retardation. Nat. Genet. 42, 489–491. (10.1038/ng.589) - DOI - PubMed
    1. Chilian B, Abdollahpour H, Bierhals T, Haltrich I, Fekete G, Nagel I, Rosenberger G, Kutsche K. 2013. Dysfunction of SHANK2 and CHRNA7 in a patient with intellectual disability and language impairment supports genetic epistasis of the two loci. Clin. Genet. 84, 560–565. (10.1111/cge.12105) - DOI - PubMed
    1. Leblond CS, et al. . 2012. Genetic and functional analyses of SHANK2 mutations suggest a multiple hit model of autism spectrum disorders. PLoS Genet. 8, e1002521. (10.1371/journal.pgen.1002521) - DOI - PMC - PubMed
    1. Pinto D, et al. . 2010. Functional impact of global rare copy number variation in autism spectrum disorders. Nature 466, 368–372. (10.1038/nature09146) - DOI - PMC - PubMed
    1. Sanders SJ, et al. . 2012. De novo mutations revealed by whole-exome sequencing are strongly associated with autism. Nature 485, 237–241. (10.1038/nature10945) - DOI - PMC - PubMed