Clinical Trial
. 2024 Sep 5;26(9):1602-1616.
doi: 10.1093/neuonc/noae105.

Targeting IGF2 to reprogram the tumor microenvironment for enhanced viro-immunotherapy

Affiliations
Clinical Trial

Targeting IGF2 to reprogram the tumor microenvironment for enhanced viro-immunotherapy

Min Hye Noh et al. Neuro Oncol. .

Abstract

Background: The FDA approval of oncolytic herpes simplex-1 virus (oHSV) therapy underscores its therapeutic promise and safety as a cancer immunotherapy. Despite this promise, the current efficacy of oHSV is significantly limited to a small subset of patients largely due to the resistance in tumor and tumor microenvironment (TME).

Methods: RNA sequencing (RNA-Seq) was used to identify molecular targets of oHSV resistance. Intracranial human and murine glioma or breast cancer brain metastasis (BCBM) tumor-bearing mouse models were employed to elucidate the mechanism underlying oHSV therapy-induced resistance.

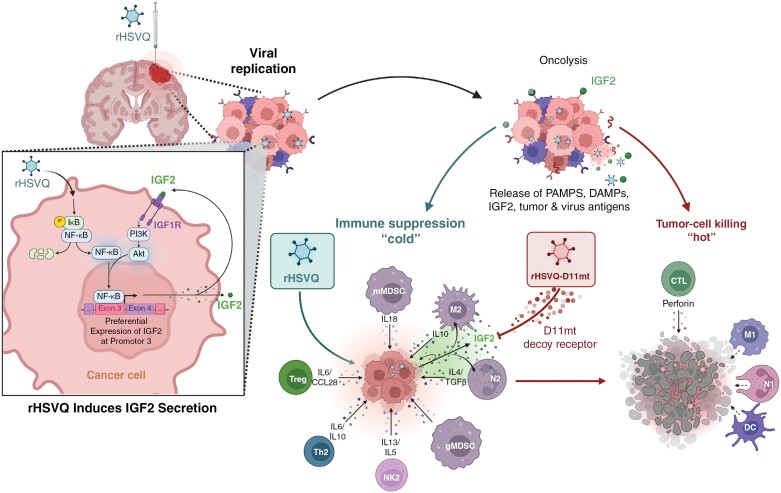
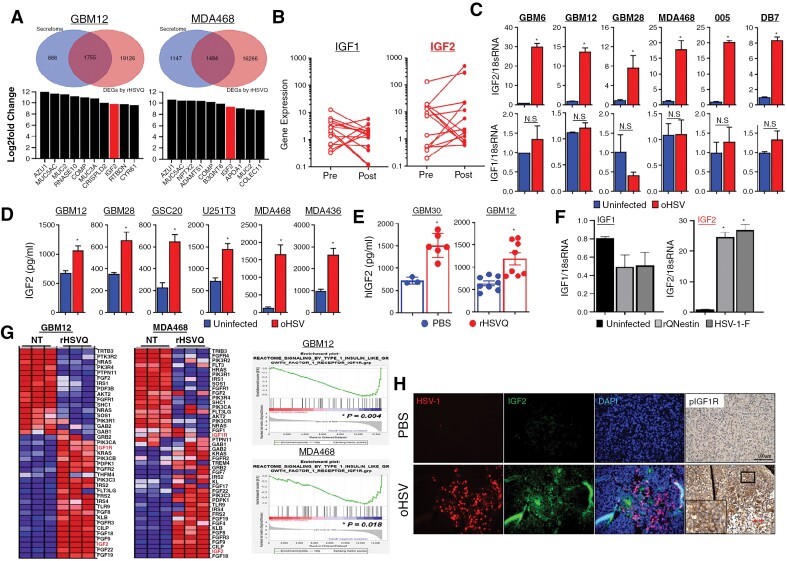
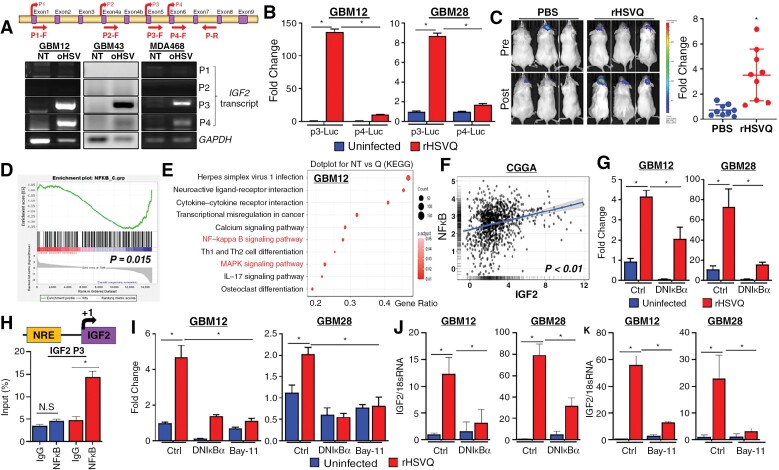
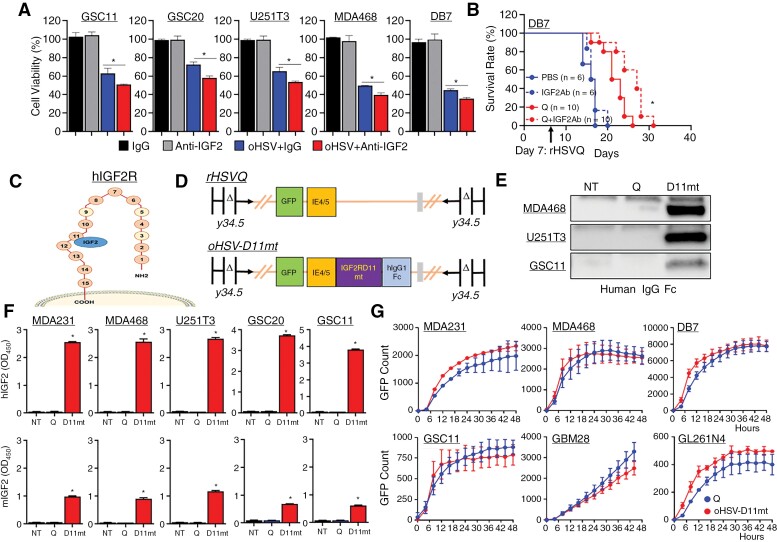
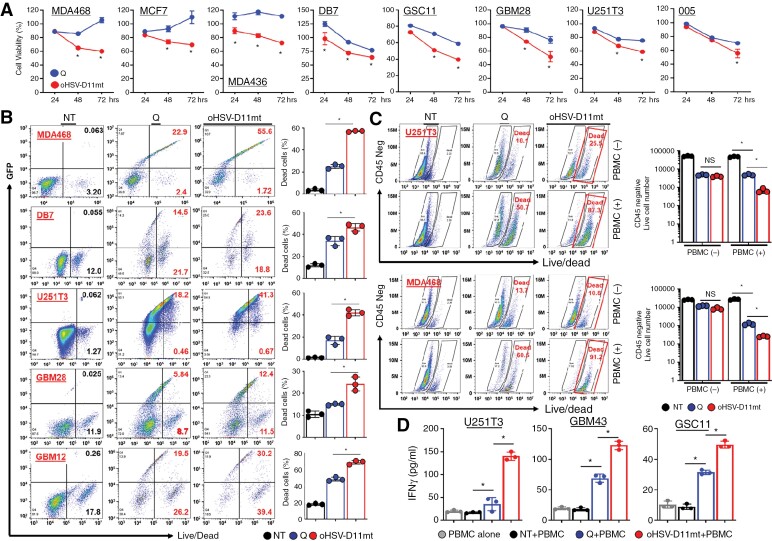
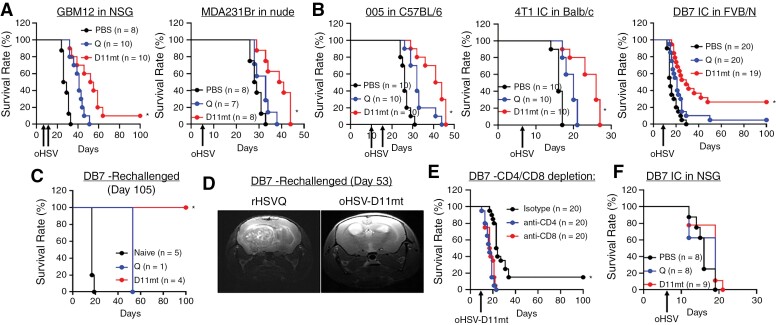
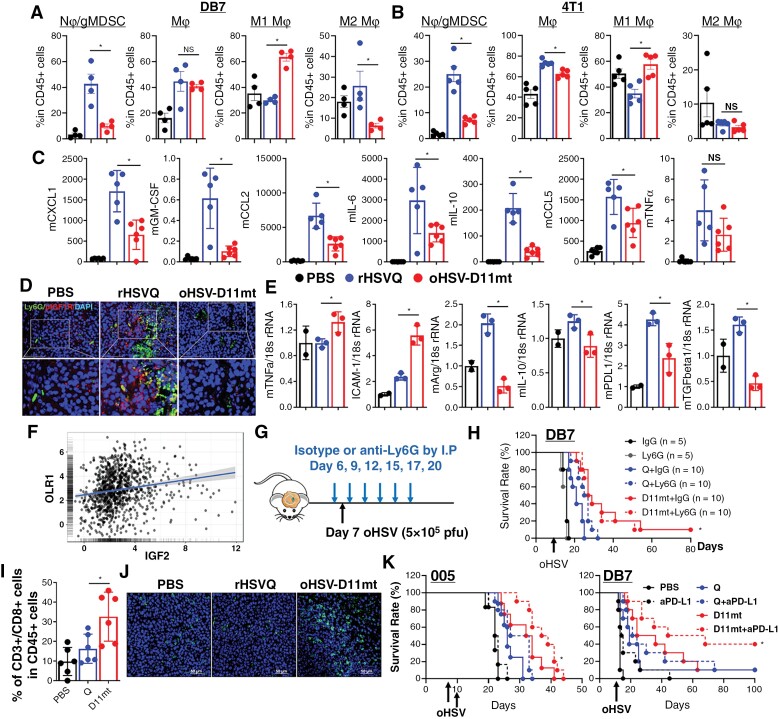
Results: Transcriptome analysis identified IGF2 as one of the top-secreted proteins following oHSV treatment. Moreover, IGF2 expression was significantly upregulated in 10 out of 14 recurrent GBM patients after treatment with oHSV, rQNestin34.5v.2 (71.4%; P = .0020) (ClinicalTrials.gov, NCT03152318). Depletion of IGF2 substantially enhanced oHSV-mediated tumor cell killing in vitro and improved survival of mice bearing BCBM tumors in vivo. To mitigate the oHSV-induced IGF2 in the TME, we constructed a novel oHSV, oHSV-D11mt, secreting a modified IGF2R domain 11 (IGF2RD11mt) that acts as IGF2 decoy receptor. Selective blocking of IGF2 by IGF2RD11mt significantly increased cytotoxicity, reduced oHSV-induced neutrophils/PMN-MDSCs infiltration, and reduced secretion of immune suppressive/proangiogenic cytokines, while increased CD8 + cytotoxic T lymphocytes (CTLs) infiltration, leading to enhanced survival in GBM or BCBM tumor-bearing mice.

Conclusions: This is the first study reporting that oHSV-induced secreted IGF2 exerts a critical role in resistance to oHSV therapy, which can be overcome by oHSV-D11mt as a promising therapeutic advance for enhanced viro-immunotherapy.

Keywords: Oncolytic herpes simplex virus-1 (oHSV); glioblastoma (GBM); insulin-like growth factor 2 (IGF2); insulin-like growth factor-1 receptor (IGF1R); tumor microenvironment (TME).


Conflict of interest statement

The authors have no potential conflicts of interest to disclose.

Figures

Graphical Abstract
Graphical Abstract
Figure 1.
Figure 1.
oHSV therapy induces IGF2 gene expression in virus-infected tumor cells. (A) mRNA-Seq of patient-derived primary GBM (GBM12) and MDA468 human BC cells (n = 4/group) treated with or without rHSVQ (MOI = 0.1) for 16 hours. The Venn diagram depicts the number of differentially expressed genes (DEGs) (top) and a list of top 10 most upregulated secretome genes following rHSVQ infection (bottom) in GBM12 and MDA468 cells. (B) IGF1 and IGF2 gene expression levels pre- and post-rQNestin34.5v2 treatment in 14 recurrent GBM patients (ClinicalTrials.gov, NCT03152318). (C-D) Validation of IGF2 and IGF1 gene expression and proten secretion by quantitative RT-PCR (qRT-PCR) and ELISA in vitro. Various human primary GBM and U251T3 glioma and breast cancer (BC) cell lines were infected with or without rHSVQ (MOI = 0.1 ~ 1 MOI). Twenty-four hours post-viral infection, cells and culture media (CM) were collected for qRT-PCR (C) and human IGF2 ELISA (D), respectively. (E) Quantification of secreted IGF2 levels in intracranial GBM tumors (GBM12 and GBM30) treated with PBS or oHSV in vivo. Ten days post-tumor implantation, tumor-bearing brain hemispheres were injected intratumorally with PBS or rHSVQ (5 × 105 pfu). Tumor-bearing brain hemispheres were collected 1 day post-treatment and homogenized in serum-free DMEM media (GBM30: PBS, n = 3; rHSVQ, n = 6 and GBM12: n = 8/group). Data shown are the mean ± SEM. *P < .05, NS = not significant. (F) qRT- PCR of IGF2 gene expression in GBM12 cells infected with various HSV-1 viruses (rQNestin34.5v.1 and wild-type F strain) (MOI = 0.5). GBM12 cells were infected with various HSV-1 for 24 hours. IGF1 and IGF2 gene expression was measured with qRT-PCR, using 18S rRNA as an expression normalization control. Data shown are mean fold-change in gene expression ± S.D., normalized to uninfected cells (n = 3/group). *P < .05. (G) Expression heatmap and (left) GSEA plots (right) of IGF1R signaling in GBM12 and MDA468 cells from (A). (H) Histological analysis of rHSVQ treatment-induced IGF2-IGF1R signaling activation in intracranial GBM12 tumor-bearing brain tissue sections from mice treated with PBS or rHSVQ. Representative fluorescent microscopy images staining for HSV-1 (red), IGF2 (green), DAPI (blue), and pIGF1R (DAB). (Magnification, 4X).
Figure 2.
Figure 2.
oHSV therapy induces IGF2 secretion in vitro and in vivo through direct binding of NFκB to IGF2 Promotor 3. (A) Schematic diagram of the four alternative IGF2 promoters, denoted P1-P4, and their exons and promoters. PCR primers for promoter-specific transcripts of IGF2 are described (top). GBM12, GBM43, and MDA468 cells were infected with or without rHSVQ (MOI = 0.1). Sixteen hours post viral infection, cells were harvested and the expression of IGF2 was tested by semi-quantitative RT-PCR. GAPDH expression was used for an internal control for gene expression. (B) Primary GBM12 cells stably expressing a firefly-luciferase reporter harboring either the IGF2 P3 (GBM12-IGF2P3-Luc) or the IGF2 P4 (GBM12-IGF2P4-Luc) reporter genes were infected with or without rHSVQ (MOI = 0.1) and luciferase activity was analyzed 24 hours later. The luciferase activity was normalized by protein concentration. Data shown are the mean ± S.D. of the relative change in IGF2 promoter-luciferase activity compared to unifected controls (n = 3/group). (C) The role of these promoters was examined in vivo by implanting GBM12-IGF2P3-Luc intracranially and then treating intratumorally with PBS or rHSVQ (5 × 105 pfu). IGF2 promoter activation was measured by in vivo bioluminescence imaging eight hours before and after virus injection. Representative bioluminescence images of mice (left) and quantification of IGF2 promoter activity (right) revealed preferential IGF2P3 activation upon viral injection. Data shown represent the changes in luciferase activity pre- and post-rHSVQ injection (n = 9/group). (D-E) GSEA plot for NFκB signaling pathway (D) and KEGG pathway analysis showing the top 10 upregulated pathways (E) in the mRNA-Seq data (GBM12) prepresented in Figure 1. (F) There was a significant positive correlation between IGF2 and NFκB gene expression in glioma patients (n = 983) sampled in the CGGA. Log2-transformed mRNA expression data were obtained. IGF2 gene expression is plotted on the x-axis, while expression of NFκB genes is plotted on the y-axis. Linear regression estimates are expressed as a trend line. (G) rHSVQ infection induces NFκB activation. The primary GBM cells were transfected with a firefly-luciferase reporter harboring NFκB Response Elements (NREs; pGL3-NRE-fLuc), pGL3-TK-Renila luciferase (pGL3-TK-rLuc), and with either control pGL4.32 or dnIκBα-expressing plasmid (pGL4.32-dnIκBα). Twenty-four hours post-transfection, cells were infected with or without rHSVQ (MOI = 0.1) and luciferase activity was measured 24 hours later. The luciferase activity were normalized as a ratio of Firefly/Renilla Luciferase activity. Data shown are the mean ± S.D. of the relative change in NFκB-luciferase activity (n = 3/group). (H) Schematic diagram (top) depicts the promoter constructs of NREs within the IGF2P3 generated for ChIP analysis of promoter activity, which demonstrated binding of NFκB to the putative NRE within the IGF2P3 (bottom). Dominant-negative mutant of IκBα (dnIκBα) expression and direct NFκB inhibititor (Bay11-7082) treatment reversed rHSVQ treatment-induced NFκB activation and IGF2 gene expression, demonstrating that NFκB is both necessary and sufficient for IGF2 expression. GBM12 and GBM28 cells were co-transfected with either a control or IGF2P3-fLuc-expressing plasmid and pGL3-TK-rLuc plasmids. For the ectopic expression of a dnIκBα, 24 hours post-transfection, cells were transfected with control pGL4.32 or pGL34.2-dnIκBα plasmids. Twenty-four hours post-transfection, cells were infected with rHSVQ (MOI = 0.01 for GBM12 and MOI = 0.05 for GBM28) for 24 hours. For pharmacologic NFκB inhibition (Bay11-7082), cells were infected with rHSVQ (MOI = 0.01 for GBM12 and MOI = 0.05 for GBM28) 24-hour post-transfection and treated with 5 µM of Bay11-7082, 1-hour post viral infection, and cultured for 24 hours. (I) Luciferase activity was measured using a dual luciferase assay kit, normalized as a ratio of Firefly/Renila Luciferase activity. Data shown represent the fold change compared to uninfected controls (J-K) IGF2 expression was measured by qRT-PCR with molecular (dnIκBα overexpression) (J) and pharmacologic (Bay11-7082) inhibition (K) of NFκB as described above. IGF2 expression levels were normalized using 18S rRNA expression and presented as the fold change compared to unifected controls (n = 3/group). Data shown are the mean ± S.D. *P < .05, **P < .01, NS = not significant unless otherwise specified.
Figure 3.
Figure 3.
The novel next-generation oHSV, oHSV-D11mt, secretes an IGF2R domain 11 decoy receptor with specificity for IGF2 without altering viral kinetics. (A) Various cancer cells were infected with or without rHSVQ at an MOI of 0.01 or 0.05, and then treated with 20 µg/mL of either IgG isotype control or an anti-IGF2 antibody 1 hour later. Seventy-two hours post-infection, cell viability was measured by a standard MTT assay. Data represent the mean % cell viability relative to uninfected cells ± S.D. (n = 3/group). *, P < 0.05.(B) Kaplan–Meier survival curve of mice bearing intracranial DB7 murine BCBM tumors and treated intratumorally with PBS or rHSVQ (Q) (5 × 105 pfu) 9 days post tumor implantation and then treated with 20 µg/mouse of IgG isotype control or an anti-IGF2 antibody 3 times a week. Animal numbers used are described inside of survival curve. (C) Illustration of IGF2R depicting binding specificity of domain 11 for IGF2. (D) The genomic structure of F-strain HSV-1 shows doubly deleted γ34.5 genes, a disrupted ICP6 gene, and an inserted eGFP transgene within the control rHSVQ (top, Q) and oHSV-D11mt (bottom, D11mt). Our next-generation oHSV, oHSV-D11mt, contains both an eGFP and an IGF2RD11mt-hIgGFc fusion transgene. (E) Using culture media (CM) collected from MDA468, U251T3, and GSC11 cells infected with either rHSVQ- and oHSV-D11mt for 16 hours, secreted IGF2RD11mt was probed by western blot analysis using human IgGFc antibody. (F) Using the CM from rHSVQ- and oHSV-D11mt-infected various BC and GBM cells for 16 hours, specific binding affinity of IGF2RD11mt to human IGF2 (top) and murine IGF2 (bottom) was quantified by ELISA using a secondary HRP-conjugated anti-human IgGFc antibody. (H) Comparison of viral spread/kinatics in cultures of the indicated BC and GBM cells infected with rHSVQ and oHSV-D11mt, showed no difference in viral replication. The indicated BC and GBM cells were infected with rHSVQ or oHSV-D11mt and viral GFP expression was monitored every 2 hours for 48 hours utilizing the Cytation 5 live imaging system. Viral GFP count was quantified and graphed as an average of 3 wells per treatment group. Data shown are average counts of GFP positive cells ± SD over time. *P < .05.
Figure 4.
Figure 4.
oHSV-D11mt enhances direct tumor cell killing and immune cell-mediated cytotoxicity in vitro. (A) Various BC and GBM cells were infected with control rHSVQ or oHSV-IGF2RDmt (MOI = 0.05 ~ 0.1) and cell viability was measured by MTT assay 24, 48, and 72 hours post-viral infection. Data represent the mean % cell viability relative to uninfected cells ± SD for each group (n = 3/group). (B) Human BC and GBM cells infected with rHSVQ or oHSV-D11mt (MOI = 0.05 ~ 0.1) for 48 hours were stained with live/dead fixable aqua cell stain and then analyzed by flow cytometry. The results are illustrated as a representative scatter plot (left) and the percentage of dead cells (right). (C-D) U251T3 or MDA468 cells were infected with rHSVQ or oHSV-D11mt and overlaid with PBMCs. Five days after co-culture, CM and cells were collected and cells were stained with a CD45 antibody and live/dead fixable aqua cell stain and then analyzed by flow cytometry (C). Data shown are a representative scatter plot. (D) Using CM collected from (C), human IFNγ secretion was quantified by ELISA. *, P < .05.
Figure 5.
Figure 5.
oHSV-D11mt treatment improves mice survival in GBM- and BCBM-bearing immunocompromised and immunocompetent mice. (A–B) Kaplan–Meier survival curve of orthotropic intracranial mouse models of human patient-derived primary GBM12 and MDA231Br human BC cells in immunocompromised mice (A) and 005 murine glioma, 4T1 and DB7 murine BC cells in immunocompetent mice (B) treated intra-tumorally with PBS, rHSVQ, or oHSV-D11mt (5 × 105 pfu). (C) Long-term survivors of DB7 BCBM tumors treated with rHSVQ (n = 1) and oHSV-D11mt (n = 4) in part A were re-challenged with a secondary tumor implantation in the opposing hemisphere without re-treatment. While all control age-matched naive mice died 19 days post-implantation, the rHSVQ-treated long-term survivor died 53 days post-tumor implantation and all oHSV-D11mt-treated long-term survivors fully rejected the tumors as seen in MRI (D). (E) Intracranial DB7 murine BCBM tumor-bearing FVB/N mice were treated with or without rHSVQ as described above. We then depleted either CD4 + or CD8 + T cells by intraperitoneal (IP) administration of depleting antibodies (IgG isotype control, anti-CD4, or anti-CD8) 2, 4, 7, and 10 days post viral injection (n = 20/each group). *P < .05 compared with CD4 or CD8 depletion. (F) Kaplan–Meier survival curves of immunodeficient NSG mice implanted with intracranial DB7 murine BCBM tumors and treated intra-tumorally with PBS, rHSVQ, or oHSV-D11mt (5 × 105 pfu) 7 days later, revealing a reversal of the survival benefit observed in syngenic immunocompetent models. Data are presented as means ± SD with *P < .05.
Figure 6.
Figure 6.
oHSV-D11mt significantly increases CD8 + Tumor-Infiltrating T lymphocyte recruitment without increased infiltration of neutrophils/PMN-MDSCs in orthotropic models of BCBM. (A–B) Intracranial DB7 (A) and 4T1 (B) BCBM tumor-bearing mice were injected with PBS, rHSVQ, or oHSV-D11mt (5 × 105 pfu) 10 days post-tumor implantation. Tumor-bearing brain hemispheres were collected two days post-virus injection and analyzed for CD11bhigh/CD45+/Ly6G + gMDSC and CD11bhigh/CD45 + monocyte-derived macrophage infiltration and activation by flow cytometry. (C) Bioplex Luminex assay using tumor lysates collected from DB7 BCBM tumor-bearing mice treated with PBS, rHSVQ, or oHSV-D11mt. Cytokine measurements (pg/mL) were normalized via Box-Cox transformations and Pearson’s correlation coefficient was calculated for each pair of the cytokines to generate a correlation matrix. (D) Immunofluorescence Staining of Ly6G + neutrophils/PMN-MDSC infiltration and activation of IGF1R in DB7 BCBM tumor-bearing mice treated as above revealed a marked reduction in infiltration of neutrophils/PMN-MDSCs (Ly6G+, green) and a concurrent activation/phosphorylation of IGF1R (p-IGF1R, red). (E) Ly6G + neutrophil/PMN-MDSCs were isolated from tumor-bearing hemispheres two days after viral treatment of DB7 BCBM tumors treated with PBS, rHSVQ, or oHSV-D11mt (5 × 105 pfu) ten days after implantation. Gene expression of markers associated with pro-inflammatory (N1) neutrophils (TNFα and ICAM-1) and anti-inflammatory (N2) neutrophils (Arg1, IL-10, PD-L1, and TGFβ) were measured by qRT-PCR. All gene expression levels were normalized using 18S expression and presented as the fold change compared to PBS controls. *P < .05 compared to rHSVQ. (F) There was a significant correlation between IGF2 and OLR1 gene expression in glioma patients (n = 983) sampled in the CGGA. Log2-transformed mRNA expression data were obtained. IGF2 gene expression is shown as x-axis, while expression of OLR1 genes is shown on y-axis. Linear regression estimates are shown as a trend line. (G-H) (G) Schematic diagram of treatment schedule. (H) Intracranial DB7 murine BCBM tumor-bearing FVB/N mice were treated intratumorally with PBS, rHSVQ, or oHSV-D11mt then with an isotype control IgG or anti-Ly6G gMDSC depleting antibody by IP injection as described in the experimental scheme (G). Data shown are Kaplan–Meier survival curves of animals in each group (PBS + Isotype, n = 5; PBS + anti-Ly6G, n = 5; rHSVQ + anti-Ly6G, n = 10; oHSV-D11mt + anti-Ly6G, n = 10). (I) Flow-cytometry analysis of CD4 + and CD8 + TILs collected from DB7 BCBM tumor-bearing hemispheres receiving PBS, rHSVQ, and oHSV-D11mt treatment revealed no change in CD4 + helper T cells and a significant increase in CD8 + cytotoxic T lymphocytes (CTLs, n = 6/group). Data shown are the mean ± SEM. (J) Brain tumor tissue from (D) were stained with a CD8 (green) antibody, revealing a marked increase in CD8 + CTLs in oHSV-D11mt-treated mice. (K) oHSV-D11mt synergized with adjuvant T cell activation through immune checkpoint blockade. We administered an adjuvant anti-PDL1 antibody as described in the experimental scheme in (G) in the 005 glioma and DB7 BCBM model (n = 10/group). All data are presented as means ± SEM with *P < .05.

References

    1. Arefian E, Bamdad T, Soleimanjahi H, et al. Evaluation of gamma-interferon kinetics in HSV-1 infected mice in different days post infection (in vivo) and post re-stimulation (in vitro). Comp Immunol Microbiol Infect Dis. 2007;30(1):1–9. - PubMed
    1. Lemos de Matos A, Franco LS, McFadden G.. Oncolytic viruses and the immune system: The dynamic duo. Mol Ther Methods Clin Dev. 2020;17:349–358. - PMC - PubMed
    1. Marchini A, Daeffler L, Pozdeev VI, Angelova A, Rommelaere J.. Immune conversion of tumor microenvironment by oncolytic viruses: The protoparvovirus H-1PV Case Study. Front Immunol. 2019;10:1848. - PMC - PubMed
    1. Wojtalla A, Salm F, Christiansen DG, et al. Novel agents targeting the IGF-1R/PI3K pathway impair cell proliferation and survival in subsets of medulloblastoma and neuroblastoma. PLoS One. 2012;7(10):e47109. - PMC - PubMed
    1. Farabaugh SM, Boone DN, Lee AV.. Role of IGF1R in breast cancer subtypes, stemness, and lineage differentiation. Front Endocrinol (Lausanne). 2015;6:59. - PMC - PubMed

Publication types

MeSH terms

Substances

Associated data