[Preprint]. 2024 Oct 14:2024.05.30.596451.
doi: 10.1101/2024.05.30.596451.

Structural dynamics of the intrinsically disordered linker region of cardiac troponin T

Affiliations

Structural dynamics of the intrinsically disordered linker region of cardiac troponin T

Jasmine Cubuk et al. bioRxiv. .

Abstract

The cardiac troponin complex, composed of troponins I, T, and C, plays a central role in regulating the calcium-dependent interactions between myosin and the thin filament. Mutations in troponin can cause cardiomyopathies; however, it is still a major challenge to connect how changes in sequence affect troponin's function. Recent high-resolution structures of the thin filament revealed critical insights into the structure-function relationship of troponin, but there remain large, unresolved segments of troponin, including the troponin-T linker region that is a hotspot for cardiomyopathy mutations. This linker region is predicted to be intrinsically disordered, with behaviors that are not well described by traditional structural approaches; however, this proposal has not been experimentally verified. Here, we used a combination of single-molecule Förster resonance energy transfer (FRET), molecular dynamics simulations, and functional reconstitution assays to investigate the troponin-T linker region. We show that in the context of both isolated troponin and the fully regulated troponin complex, the linker behaves as a dynamic, intrinsically disordered region. This region undergoes polyampholyte expansion in the presence of high salt and distinct conformational changes during the assembly of the troponin complex. We also examine the ΔE160 hypertrophic cardiomyopathy mutation in the linker and demonstrate that it does not affect the conformational dynamics of the linker, rather it allosterically affects interactions with other troponin complex subunits, leading to increased molecular contractility. Taken together, our data clearly demonstrate the importance of disorder within the troponin-T linker and provide new insights into the molecular mechanisms driving the pathogenesis of cardiomyopathies.

Keywords: Major Classification: Biological Sciences; Minor Classification: Biophysics and Computational Biology; sarcomere; single molecule; thin filament.


Conflict of interest statement

CONFLICT OF INTEREST STATEMENT All experiments were conducted in the absence of any commercial or financial relationships that could be construed as potential conflicts of interest. M.J.G. acknowledges research support from Edgewise Therapeutics unrelated to this project.

Figures

Figure 1:
Figure 1:. TnT sequence, linker.
A. Representation of the thin-filament, with actin (light orange), tropomyosin (light gray), and the troponin complex with troponin C (TnC, green), troponin I (TnI, light blue), and troponin T (TnT, purple), based on PBD 6KN7. The dashed region in troponin T represents the unresolved linker region. B. Troponin T cartoon representation with the linker sequence highlighted (positive residues colored red, negative residues colored blue). Plot of predicted disorder shows the N terminal domain, linker, and C terminal domain to contain disorder. Orange dots represent pathogenic and likely pathogenic mutations found in troponin T, as identified via ClinVar.
Figure 2:
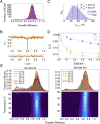
Figure 2:. smFRET, nsFCS, and simulations of the troponin T-linker in isolation:
A. Representative histogram of TnT153,213 shows a single narrow distribution close to the shot-noise limit (red fit). We attribute the extra-broadening to the permutation of labeling positions. B. Nanosecond FCS (ns-FCS) acceptor-donor cross-correlation shows an anticorrelated amplitude, consistent with a dynamic linker. C. Coarse-grained simulations of full-length TnT were performed with the inter-residue distance between residues 153 and 213 reported here. Root-mean-squared distance from smFRET experiments is overlaid. D. Plot of change in transfer efficiencies as a function of salt (blue: KCl, pink: MgCl2, green: CaCl2). Values are mean and standard deviation of multiple (at least two) measurements. E. Top: Normalized histograms of TnT153,213 FRET efficiency as a function of increasing temperature (10–63°C). Bottom: 2D plot of temperature and transfer efficiency in low salt (25 mM KCl, left) and high salt (300 mM KCl, right).
Figure 3:
Figure 3:. Troponin-T (TnT) linker conformations and dynamics within the troponin complex and thin filament.
A. Distribution of transfer efficiencies for TnT in isolation (magenta), when part of the troponin complex (blue), and when the troponin complex is bound to the fully regulated thin filament (purple). Vertical lines are guides for the eyes based on the mean transfer efficiencies of TnT in isolation and bound to the thin filament. Troponin I (TnI) and troponin C (TnC) are shown. Corresponding titrations confirming the reported histograms were collected under saturation conditions are shown in Fig. S3 and S6. B. Normalized lifetime vs. transfer efficiency plot for TnT in isolation (magenta), within the troponin complex (blue), and when the troponin complex is bound to the fully regulated thin filament (purple). Values are mean ± standard deviation from independent replicates (at least two measurements). Gray line represents the theoretical static limit of a rigid distance, while the green line describes the corresponding results for a dynamic chain sampling distances according to a Gaussian chain model (see Eq. 2). Data falls on the dynamic curve for all conditions. All experiments performed in 50 mM HEPES, 25 mM KCl, 4 mM MgCl2, 2 mM CaCl2.
Figure 4:
Figure 4:. The ΔE160 mutation in troponin T affects thin filament regulation and molecular contractility.
A-B. In vitro motility assays showing the speed of thin filament translocation over a bed of myosin as a function of calcium. Shown are the A. un-normalized and B. normalized speeds. Data are from N=3 separate days of experiments. The mean and standard deviations are shown. The maximal speed (WT: 360 ± 10 nm/s, ΔE160: 390 ± 10 nm/s, P < 0.01) and the pCa50 are increased for the mutant (WT: 5.7 ± 0.1, ΔE160: 6.0 ± 0.1, P < 0.05). The speed is increased for ΔE160 for pCa<6.25 (P < 0.05), except at pCa 5. C. The normalized ATPase rate as a function of calcium. Data are from N=5 WT and N=4 ΔE160 curves. The mean and standard deviations are shown. The pCa50 is increased for the mutant (WT: 7.2 ± 0.1, ΔE160: 7.4 ± 0.1, P < 0.05). D. The fraction of calcium bound to troponin C as a function of calcium measured using IAANS fluorescence. Data are from N=3 WT and N=5 ΔE160 curves. The mean and standard deviations are shown. The pCa50 is increased for the mutant (WT: 6.4 ± 0.1, ΔE160: 6.7 ± 0.2, P < 0.05).
Figure 5
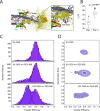
Figure 5. Troponin-T (TnT) linker conformations in the thin filament with crowders
A. Simulations highlighting flexibility and extension of the TnT linker (yellow) when in complex with the thin filament comprised of TnC (green), TnI (red), actin (grey), and tropomyosin (blue). B. Root mean square inter-dye distances computed from simulations with the single molecule experimental data plotted as an orange square. C. Distribution of transfer efficiencies for TnT when the troponin complex is bound to the fully regulated thin filament in buffer (top), with the addition of 5% w/v PEG 600 (middle) and 10% w/v PEG 600 (bottom). D. Representative 2D plot of Transfer Efficiency vs labeling stoichiometry ratio for each condition shown in C. The slight shift in the mean stoichiometry across the two populations in 10% PEG 600 is due to changes in brightness between the two states (possibly due to quenching) and is not assigned to changes in labeling stoichiometry, which should be 0.33 for 1 donor and 2 acceptor or 0.25 for 1 donor and 3 acceptors. We exclude the case of 2 donors and 2 acceptors because the total number of photons per burst remains similar between the two observed populations.
Figure 6:
Figure 6:. Effects of ΔE160 mutation on conformations, interactions, and salt response.
A. Comparison of distribution of transfer efficiencies in 50 mM HEPES, 25 mM KCl, 4 mM MgCl2, and 2 mM CaCl2 for TnT153,213 wild-type (purple) and ΔE160 (light pink). B. Mean transfer efficiency of TnT153,213 as a function of increasing concentration of salt (KCl in blue, CaCl2 in green, MgCl2 in pink), compared to WT (dashed lines). C-E. Comparison of binding curves of troponins T (TnT) and I (TnI) (C), TnT and troponin C (TnC) (D), and TnT and 1:1 TnI:TnC concentration (E) for wild-type (purple) and ΔE160 (light Pink) TnT153,213. All errors are standard deviations determined from independent replicates of the same sample (at least two measurements). Representative titrations in Fig. S3,S5–6.

Similar articles

References

    1. Burke M. A., Cook S. A., Seidman J. G., Seidman C. E., Clinical and Mechanistic Insights Into the Genetics of Cardiomyopathy. J. Am. Coll. Cardiol. 68, 2871–2886 (2016). - PMC - PubMed
    1. McNally E. M., Barefield D. Y., Puckelwartz M. J., The genetic landscape of cardiomyopathy and its role in heart failure. Cell Metab. 21, 174–182 (2015). - PMC - PubMed
    1. Willott R. H., et al., Mutations in Troponin that cause HCM, DCM AND RCM: what can we learn about thin filament function? J. Mol. Cell. Cardiol. 48, 882–892 (2010). - PubMed
    1. Greenberg M. J., Tardiff J. C., Complexity in genetic cardiomyopathies and new approaches for mechanism-based precision medicine. J. Gen. Physiol. 153 (2021). - PMC - PubMed
    1. McKillop D. F., Geeves M. A., Regulation of the interaction between actin and myosin subfragment 1: evidence for three states of the thin filament. Biophys. J. 65, 693–701 (1993). - PMC - PubMed

Publication types