

This is a preprint.
Is 70 the new 60? A longitudinal analysis of cohort trends inintrinsic capacity in England and China
- PMID: 38853854
- PMCID: PMC11160896
- DOI: 10.21203/rs.3.rs-4271576/v1
Is 70 the new 60? A longitudinal analysis of cohort trends inintrinsic capacity in England and China
Update in
-
Cohort trends in intrinsic capacity in England and China.Nat Aging. 2025 Jan;5(1):87-98. doi: 10.1038/s43587-024-00741-w. Epub 2024 Dec 19. Nat Aging. 2025. PMID: 39702725 Free PMC article.
Abstract
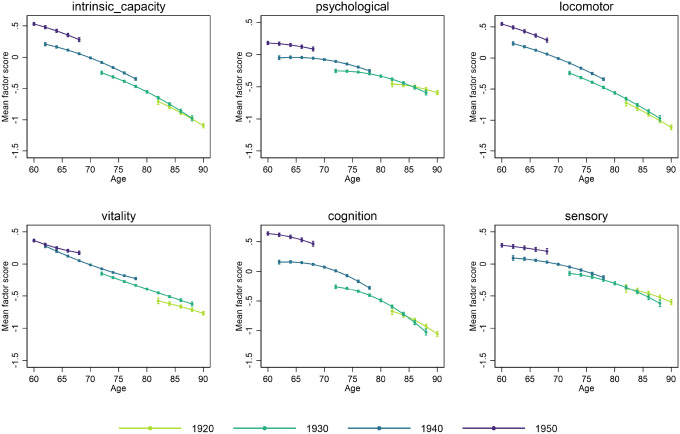
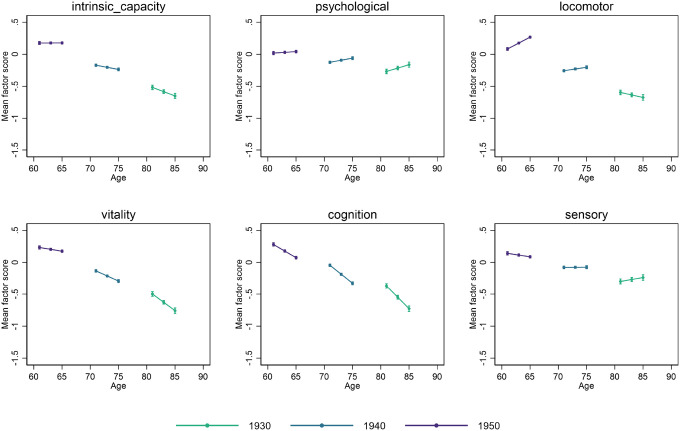
To understand how the health of older adults today compares to that of previous generations, we estimated intrinsic capacity and subdomains of cognitive, locomotor, sensory, psychological and vitality capacities in participants of the English Longitudinal Study on Ageing (ELSA) and the China Health and Retirement Longitudinal Study (CHARLS). We applied multilevel growth curve models to examine change over time and cohort trends. We found that more recent cohorts entered older ages with higher levels of capacity, and their subsequent age-related declines were somewhat compressed compared to earlier cohorts. These improvements in capacity were large, with the greatest gains being in the most recent cohorts. For example, a 68-year-old ELSA participant born in 1950 had higher capacity than a 62-year-old born just 10 years earlier. Trends were similar for men and women, and findings were generally consistent across English and Chinese cohorts.
Conflict of interest statement
Conflicts of Interest We declare that none of the authors has any potential conflicts of interest.
Figures
Similar articles
-
Cohort trends in intrinsic capacity in England and China.Nat Aging. 2025 Jan;5(1):87-98. doi: 10.1038/s43587-024-00741-w. Epub 2024 Dec 19. Nat Aging. 2025. PMID: 39702725 Free PMC article.
-
Associations of childhood socioeconomic position and health with trajectories of grip strength from middle to older ages in populations from China and England.Maturitas. 2025 Jan;191:108154. doi: 10.1016/j.maturitas.2024.108154. Epub 2024 Nov 10. Maturitas. 2025. PMID: 39566129
-
Association between internet exclusion and depressive symptoms among older adults: panel data analysis of five longitudinal cohort studies.EClinicalMedicine. 2024 Aug 2;75:102767. doi: 10.1016/j.eclinm.2024.102767. eCollection 2024 Sep. EClinicalMedicine. 2024. PMID: 39188711 Free PMC article.
-
Life-course inequalities in intrinsic capacity and healthy ageing, China.Bull World Health Organ. 2023 May 1;101(5):307-316C. doi: 10.2471/BLT.22.288888. Epub 2023 Mar 2. Bull World Health Organ. 2023. PMID: 37131938 Free PMC article.
-
Are younger cohorts in the USA and England ageing better?Int J Epidemiol. 2019 Dec 1;48(6):1906-1913. doi: 10.1093/ije/dyz126. Int J Epidemiol. 2019. PMID: 31873752 Free PMC article.
References
-
- Organization WH (2015) World report on ageing and health. World Health Organization
-
- Robine J-M, Jagger C, Crimmins EM, Saito Y, Oyen H (2020) V. Trends in health expectancies. Int Handb health expectancies, 19–34
Publication types
Grants and funding
LinkOut - more resources
Full Text Sources
