[Preprint]. 2024 Oct 13:2024.05.30.596652.
doi: 10.1101/2024.05.30.596652.

Malaria parasites require a divergent heme oxygenase for apicoplast gene expression and biogenesis

Affiliations

Malaria parasites require a divergent heme oxygenase for apicoplast gene expression and biogenesis

Amanda Mixon Blackwell et al. bioRxiv. .

Update in

Abstract

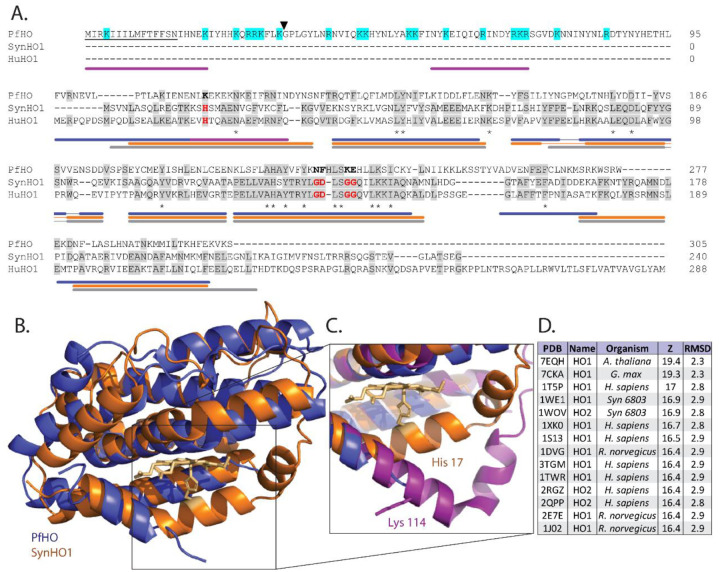
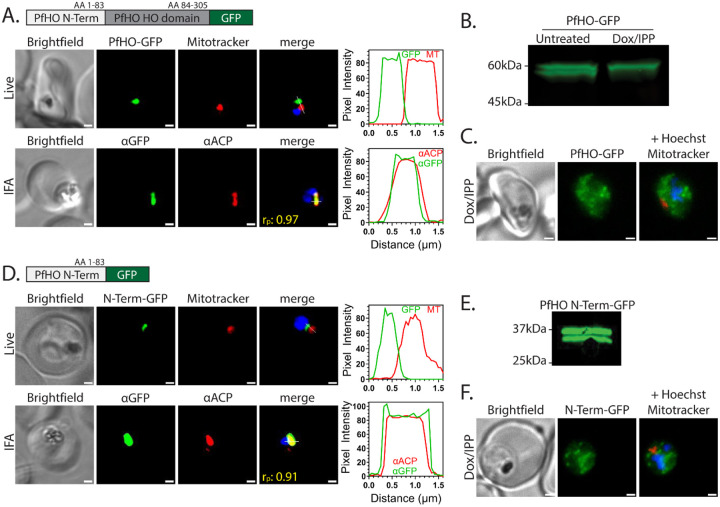
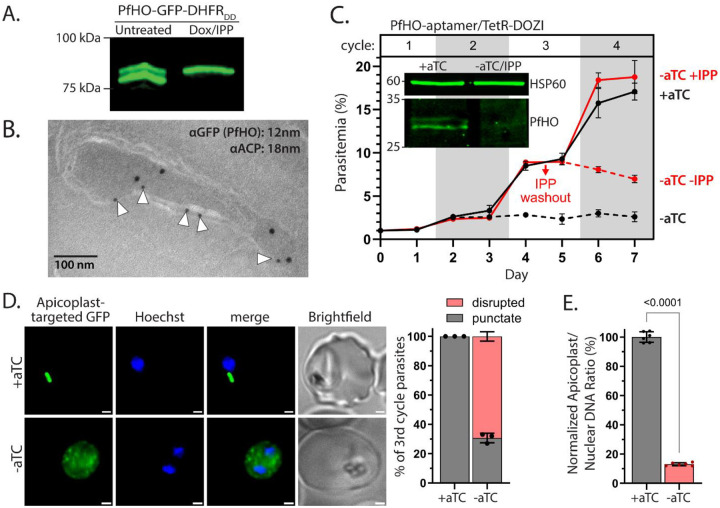
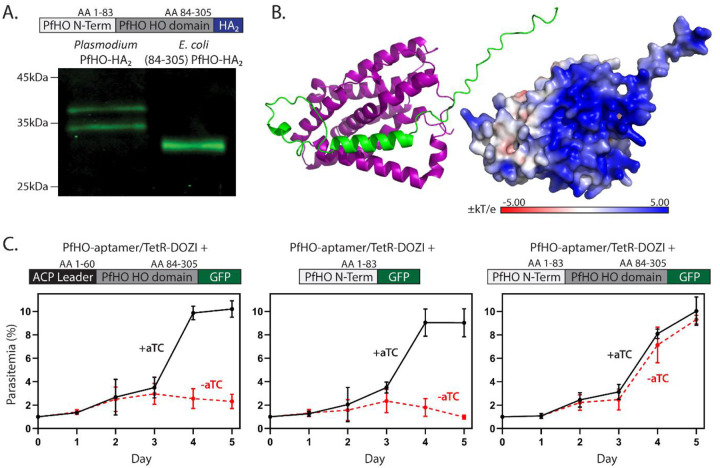
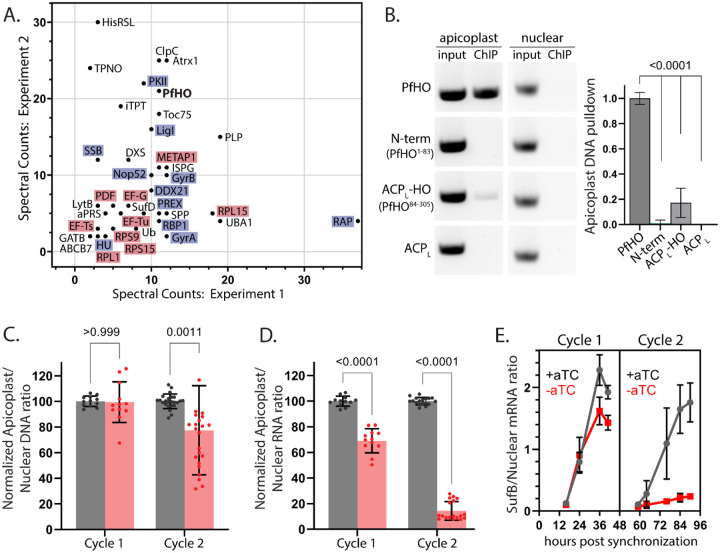
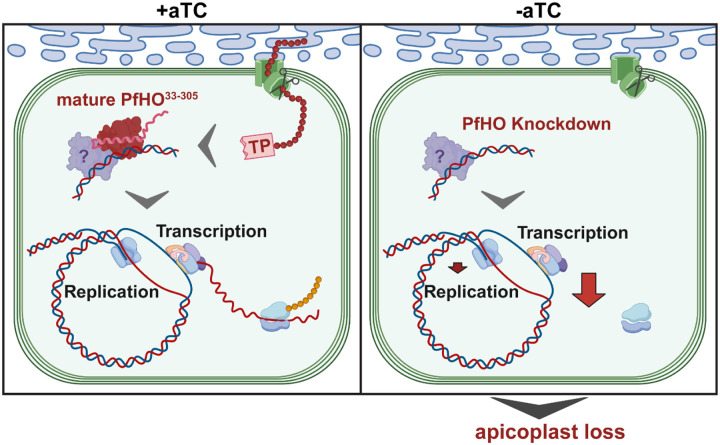
Malaria parasites have evolved unusual metabolic adaptations that specialize them for growth within heme-rich human erythrocytes. During blood-stage infection, Plasmodium falciparum parasites internalize and digest abundant host hemoglobin within the digestive vacuole. This massive catabolic process generates copious free heme, most of which is biomineralized into inert hemozoin. Parasites also express a divergent heme oxygenase (HO)-like protein (PfHO) that lacks key active-site residues and has lost canonical HO activity. The cellular role of this unusual protein that underpins its retention by parasites has been unknown. To unravel PfHO function, we first determined a 2.8 Å-resolution X-ray structure that revealed a highly α-helical fold indicative of distant HO homology. Localization studies unveiled PfHO targeting to the apicoplast organelle, where it is imported and undergoes N-terminal processing but retains most of the electropositive transit peptide. We observed that conditional knockdown of PfHO was lethal to parasites, which died from defective apicoplast biogenesis and impaired isoprenoid-precursor synthesis. Complementation and molecular-interaction studies revealed an essential role for the electropositive N-terminus of PfHO, which selectively associates with the apicoplast genome and enzymes involved in nucleic acid metabolism and gene expression. PfHO knockdown resulted in a specific deficiency in levels of apicoplast-encoded RNA but not DNA. These studies reveal an essential function for PfHO in apicoplast maintenance and suggest that Plasmodium repurposed the conserved HO scaffold from its canonical heme-degrading function in the ancestral chloroplast to fulfill a critical adaptive role in organelle gene expression.


Figures

Figure 1:
Figure 1:. Sequence and structural homology of PfHO.
A) Sequence alignment of P. falciparum (PfHO, Q8IJS6), cyanobacterial (SynHO1, P72849), and human (HuHO1, P09601) heme oxygenase homologs (Uniprot ID). Conserved histidine ligand and distal helix residues required for catalysis in SynHO1 and HuHO1 are marked in red, and identical residues in aligned sequences are in gray. Asterisks indicate identical residues in all three sequences. The predicted N-terminal signal peptide of PfHO is underlined, electropositive residues in the PfHO leader sequence are highlighted in cyan, and the black arrow marks the putative targeting peptide processing site. Colored bars below the sequence alignment mark locations of α helices observed in crystal structures of PfHO (blue), SynHO1 (orange), and HuHO1 (grey), and the AlphaFold structural prediction for PfHO (purple). B) Structural superposition of the 2.8 Å-resolution X-ray crystal structure of apo-PfHO84−305 (blue, PDB: 8ZLD) and the 2.5 Å-resolution X-ray structure of cyanobacterial, SynHO1 (orange, PDB: 1WE1). C) Structural superposition of the proximal helix for SynHO1 active site (orange), PfHO crystal structure (blue), and the AlphaFold structural prediction of PfHO (purple). D) Top-scoring protein structures in the PDB identified by the DALI server based on structural similarity to the X-ray crystal structure of PfHO84–305. RMSD is calculated in angstroms (Å), and Z-score is a unitless parameter describing similarity, where greater value indicates higher similarity. Figure supplement 1. Sequence homologs of PfHO based on BLAST and HMM searches. Figure supplement 2. Phylogenic tree of mammalian, plant, algal, and hematozoan HOs. Figure supplement 3. X-ray crystallographic data collection and structure refinement statistics for PfHO. Figure supplement 4. Sequence and structural alignments of PfHO to plant HOs (AtHO1, GmHO1). Figure supplement 5. HO surface charge features. Source data 1. PDB file for 2.8 Å-resolution structure of PfHO.
Figure 2:
Figure 2:. PfHO localization and processing.
A) Widefield fluorescence microscopy of Dd2 parasites episomally expressing PfHO-GFP. For live imaging, parasites were stained with 25 nM Mitotracker Red and 10 nM Hoechst. For IFA, parasites were fixed and stained with anti-GFP and anti-apicoplast ACP antibodies, as well as DAPI. For all images, the white scale bars indicate 1 μm. The average Pearson correlation coefficient (rp) of red and green channels based on all images is given. Pixel intensity plots as a function of distance along the white line in merged images are displayed graphically beside each parasite. B) Western blot of untreated or Dox/IPP-treated parasites episomally expressing PfHO-GFP and stained with anti-GFP antibody. C) Live microscopy of PfHO-GFP parasites cultured 7 days in 1 μM doxycycline (Dox) and 200 μM IPP and stained with 25 nM Mitotracker Red and 10 nM Hoechst. D) Widefield fluorescence microscopy of Dd2 parasites episomally expressing PfHO N-term-GFP and stained as in panel A. E) Western blot of parasites episomally expressing PfHO N-term-GFP and stained with anti-GFP antibody. F) Live microscopy of PfHO N-term-GFP parasites cultured 7 days in 1 μM Dox and 200 μM IPP, and stained as in panel C. For each parasite line and condition, ≥20 parasites were analyzed by live imaging and ≥10 parasites were analyzed by IFA. Figure supplement 1. Additional widefield fluorescence microscopy of live Dd2 parasites episomally expressing PfHO-GFP and PfHO N-Term-GFP. Figure supplement 2. Additional widefield IFA microscopy of fixed Dd2 parasites episomally expressing PfHO-GFP and PfHO N-Term-GFP. Source data 1. Uncropped western blots of untreated or Dox/IPP-treated parasites episomally expressing PfHO-GFP in figure 2B. Source data 2. Uncropped western blots of untreated parasites episomally expressing PfHO N-term-GFP in figure 2E.
Figure 3:
Figure 3:. PfHO is essential for parasite viability and apicoplast maintenance.
A) Western blot of untreated or Dox/IPP-treated parasites with endogenously tagged PfHO-GFP-DHFRDD. B) Immunogold TEM of a fixed 3D7 parasite endogenously expressing PfHO-GFP-DHFRDD and stained with anti-GFP (12 nm, white arrows) and anti-apicoplast ACP (18 nm) antibodies. C) Synchronized growth assay of Dd2 parasites tagged at the PfHO locus with the aptamer/TetR-DOZI system and grown ± 1 μM aTC and ± 200 μM IPP. Data points are the average ±SD of biological triplicates. Inset: western blot analysis of PfHO expression for 100 μg total lysates from parasites grown 3 days ±aTC, analyzed in duplicate samples run on the same gel, and stained with either custom anti-PfHO antibody or anti-heat shock protein 60 (HSP60) as loading control. Densitometry of western blot bands indicated >80% reduction in PfHO expression. D) Live microscopy of PfHO-aptamer/TetR-DOZI parasites episomally expressing apicoplast-localized GFP (PfHO N-Term-GFP) grown 5 days ±aTC with 200 μM IPP. White scale bars in bottom right corners are 1 μm. Right: Population analysis of apicoplast morphology scored for punctate versus dispersed GFP signal in 110 total parasites from biological triplicate experiments. Statistical significance was calculated by Student’s t-test. E) Quantitative PCR analysis of the apicoplast: nuclear genome ratio for PfHO-aptamer/TetR-DOZI parasites cultured 5 days ±aTC with 200 μM IPP, based on amplification of apicoplast (SufB: Pf3D7_API04700, ClpM: Pf3D7_API03600, TufA: Pf3D7_API02900) relative to nuclear (STL: Pf3D7_0717700, I5P: Pf3D7_0802500, ADSL: Pf3D7_0206700) genes. Indicated qPCR ratios were normalized to +aTC and are the average ±SD of biological triplicates. Significance of ±aTC difference was analyzed by Student’s t-test. Figure supplement 1. Schemes for modification of the PfHO genomic locus to integrate the C-terminal GFP-DHFRDD or HA2-glmS tags. Figure supplement 2. IFA microscopy of 3D7 parasites expressing PfHO-GFP-DHFRDD. Figure supplement 3. Additional immunogold TEM images of 3D7 parasites expressing PfHO-GFP-DHFRDD. Figure supplement 4. Scheme for modification of the PfHO genomic locus to integrate the aptamer/TetR-DOZI system. Figure supplement 5. Validation of custom PfHO antibody specificity. Figure supplement 6. Quantitative PCR and additional western blot analysis of PfHO expression ±aTC with 200 μM IPP. Figure supplement 7. Giemsa-stained smears of PfHO-aptamer/TetR-DOZI parasites grown in ±aTC. Figure supplement 8. Additional fluorescence microscopy images of PfHO-aptamer/TetR-DOZI parasites episomally expressing apicoplast-localized GFP grown 5 days ±aTC with 200 μM IPP. Source data 1. Uncropped western blots of parasites with endogenously tagged PfHO-GFP-DHFRDD. Source data 2. Uncropped western blots of PfHO expression. Source data 3. Uncropped Southern blot of parasite DNA from PfHO-GFP-DHFRDD cultures. Source data 4. Uncropped PCR gel of parasite DNA from PfHO- HA2-glmS cultures. Source data 5. Uncropped PCR gel of parasite DNA from PfHO-aptamer/TetR-DOZI cultures. Source data 6. Uncropped Southern blot of parasite DNA from PfHO-aptamer/TetR-DOZI cultures. Source Data 7. Uncropped western blot of 3D7 parasites stained with rabbit serum prior to inoculation with PfHO protein antigen. Source Data 8. Uncropped western blot of E. coli expressing PfHO84−305 and 3D7 parasites stained with crude serum from the final bleed of a rabbit inoculated with PfHO protein antigen.
Figure 4:
Figure 4:. Processing and essentiality of the PfHO N-terminus.
A) Western blot of lysates from Dd2 parasites endogenously expressing PfHO-HA2 and from E. coli recombinantly expressing PfHO84−305-HA2. B) AlphaFold structure and electrostatic surface charge predicted for PfHO33−305 corresponding to mature PfHO after apicoplast import. C) Synchronized growth assays of PfHO knockdown Dd2 parasites complemented by episomal expression of the indicated PfHO constructs in ±1 μM aTC. Growth assay data points are the average ±SD of biological triplicates. Figure supplement 1. Peptide coverage of PfHO sequence detected by mass spectrometry. Figure supplement 2. RT-qPCR analysis of endogenous PfHO transcript levels ±aTC in PfHO-aptamer/TetR-DOZI parasites complemented with PfHO episomes. Figure supplement 3. Western blot of episomal PfHO expression in PfHO-aptamer/TetR-DOZI parasites. Figure supplement 4. Sequence alignment of alveolate HO-like proteins indicating α-helical structure. Source data 1. Uncropped western blots of parasites endogenously expressing PfHO-HA2 and E.coli expressing PfHO HO-like domain (PfHO84−305-HA2). Source data 2. Uncropped western blot of episomal PfHO expression in PfHO-aptamer/TetR-DOZI parasites.
Figure 5:
Figure 5:. PfHO interactions with proteins and DNA and impacts of its knockdown on apicoplast DNA and RNA levels.
A) Spectral counts of functionally annotated, apicoplast-targeted proteins detected in two independent anti-HA IP/MS experiments on endogenously tagged PfHO-HA2. The names of proteins in DNA/RNA metabolism are highlighted blue and proteins in translation are highlighted in red. A list of all detected proteins can be found in Source Data 1. B) Representative image showing PCR amplification of nuclear-encoded (apicoplast ACP: Pf3D7_0208500) and apicoplast-encoded (SufB: Pf3D7_API04700) genes from DNA co-purified with full-length PfHO-GFP, PfHO1−83-GFP, ACPL-PfHO84−305-GFP, or ACPL-GFP by αGFP ChIP. “Input” is total parasite DNA collected after parasite lysis and sonication, and “ChIP” is DNA eluted after αGFP IP. Densitometry quantification of 3 biological replicates is plotted on right. Statistical significance of differences between PfHO and each other construct was calculated by Student’s t-tests. C) Quantitative PCR analysis of DNA isolated from tightly synchronized PfHO-aptamer/TetR-DOZI parasites grown ±1 μM aTC with 200 μM IPP and harvested at 36 and 84 hours in biological triplicates, with normalization of Ct values averaged from three apicoplast genes (SufB, TufA, ClpM) to Ct values averaged from three nuclear (STL, I5P, ADSL) genes. Grey bars represent +aTC and red bars represent −aTC, and observed ratios are displayed as percentages. D) Quantitative RT-PCR on RNA isolated from the same parasites as in panel C to determine the normalized ratio of apicoplast transcripts (SufB, TufA, ClpM) relative to nuclear (STL, I5P, ADSL) transcripts. Significance of ±aTC differences for C and D were analyzed by Student’s t-test. E) Representative time-course showing Ct values of SufB normalized to three nuclear (STL, I5P, ADSL) genes at indicated time in PfHO-aptamer/TetR-DOZI parasites grown ±1 μM aTC with 200 μM IPP. Data points are the average ±SD of biological triplicates. Figure supplement 1. Spectral counts for proteins co-purified with PfHO in IP/MS experiments. Figure supplement 2. List of apicoplast-localized proteins that co-purified with PfHO in IP/MS experiments. Figure supplement 3. Functional pathway predictions for apicoplast-localized proteins that co-purified with PfHO in IP/MS experiments. Figure supplement 4. Fragment analyzer quantification of parasite DNA fragment size after shearing. Figure supplement 5. Steady-state PCR amplification of additional nuclear and apicoplast genes from DNA co-purified with indicated PfHO constructs. Figure supplement 6. Additional ChIP experiments in parasites with GFP-tagged PfHO constructs. Figure supplement 7. RT-qPCR of additional apicoplast genes in PfHO-aptamer/TetR-DOZI parasites grown for 3 days ±1 μM aTC with 200 μM IPP. Figure supplement 8. Representative time-course of ClpM: nuclear transcript levels in synchronous PfHO-aptamer/TetR-DOZI parasites grown ±1 μM aTC with 200 μM IPP. Source data 1. Table of proteins identified in PfHO IP/MS experiments. Source data 2. Uncropped PCR gel of PfHO ChIP experiments in parasites with GFP-tagged PfHO constructs Source data 3. Uncropped PCR gel of PfHO ChIP experiments ±crosslinking
Figure 6:
Figure 6:. Model for essential PfHO function in apicoplast genome expression and organelle biogenesis.
TP = transit peptide. Scissors represent proteolytic processing of the PfHO N-terminal TP upon apicoplast import. Supplementary file 1. Table of PCR primers. Supplementary file 2. Table of reagents

Similar articles

References

    1. Naß J, Efferth T. Development of artemisinin resistance in malaria therapy. Pharmacol Res. 2019;146:104275. doi:10.1016/j.phrs.2019.104275 - DOI - PubMed
    1. Lubell Y, Dondorp A, Guérin PJ, et al. Artemisinin resistance – modelling the potential human and economic costs. Malar J. 2014;13(1):452. doi:10.1186/1475-2875-13-452 - DOI - PMC - PubMed
    1. Ball EG, McKee RW, Anfinsen CB, Cruz WO, Geiman QM. STUDIES ON MALARIAL PARASITES: IX. CHEMICAL AND METABOLIC CHANGES DURING GROWTH AND MULTIPLICATION IN VIVO AND IN VITRO. J Biol Chem. 1948;175(2):547–571. doi:10.1016/S0021-9258(18)57175-1 - DOI - PubMed
    1. Francis SE, Sullivan DJ, Goldberg DE. Hemoglobin metabolism in the malaria parasite Plasmodium falciparum. Annu Rev Microbiol. 1997;51:97–123. doi:10.1146/annurev.micro.51.1.97 - DOI - PubMed
    1. Elbirt KK, Bonkovsky HL. Heme Oxygenase: Recent Advances in Understanding Its Regulation and Role. Proc Assoc Am Physicians. 2018;111(5):438–447. doi:10.1111/paa.1999.111.5.438 - DOI - PubMed

Publication types