[Preprint]. 2024 Jun 2:2024.06.02.597025.
doi: 10.1101/2024.06.02.597025.

Generalized cue reactivity in dopamine neurons after opioids

Affiliations

Generalized cue reactivity in dopamine neurons after opioids

Collin M Lehmann et al. bioRxiv. .

Update in

Abstract

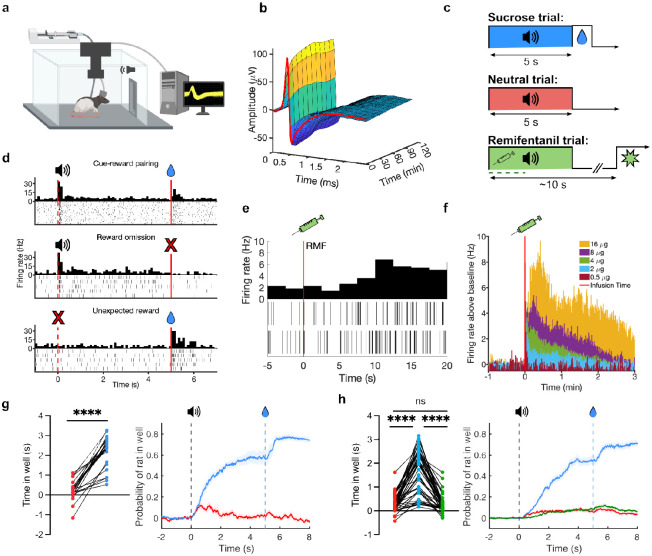
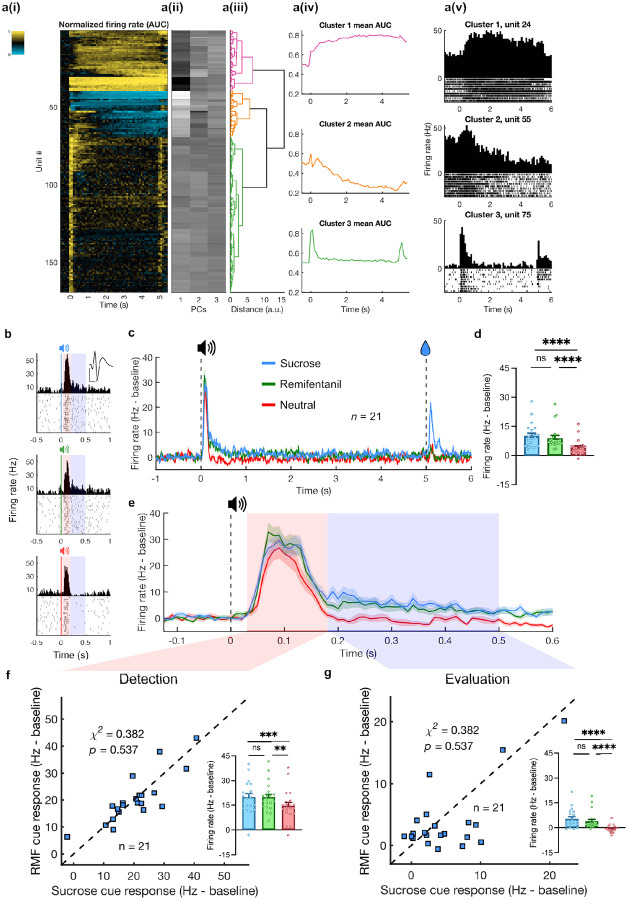
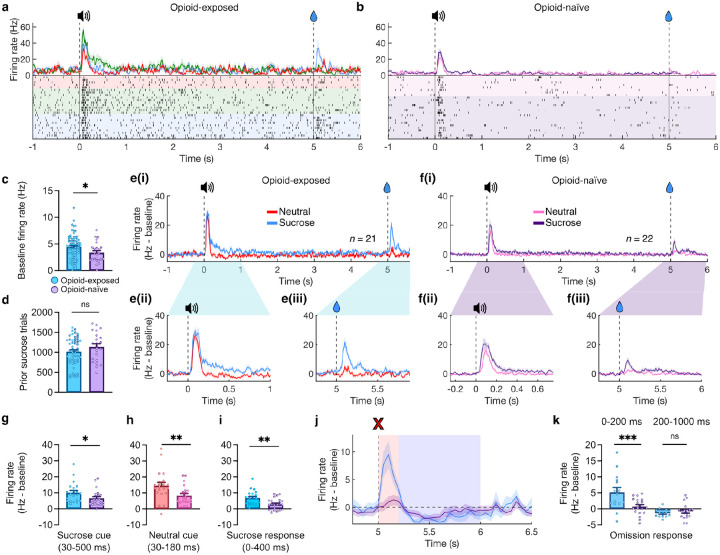
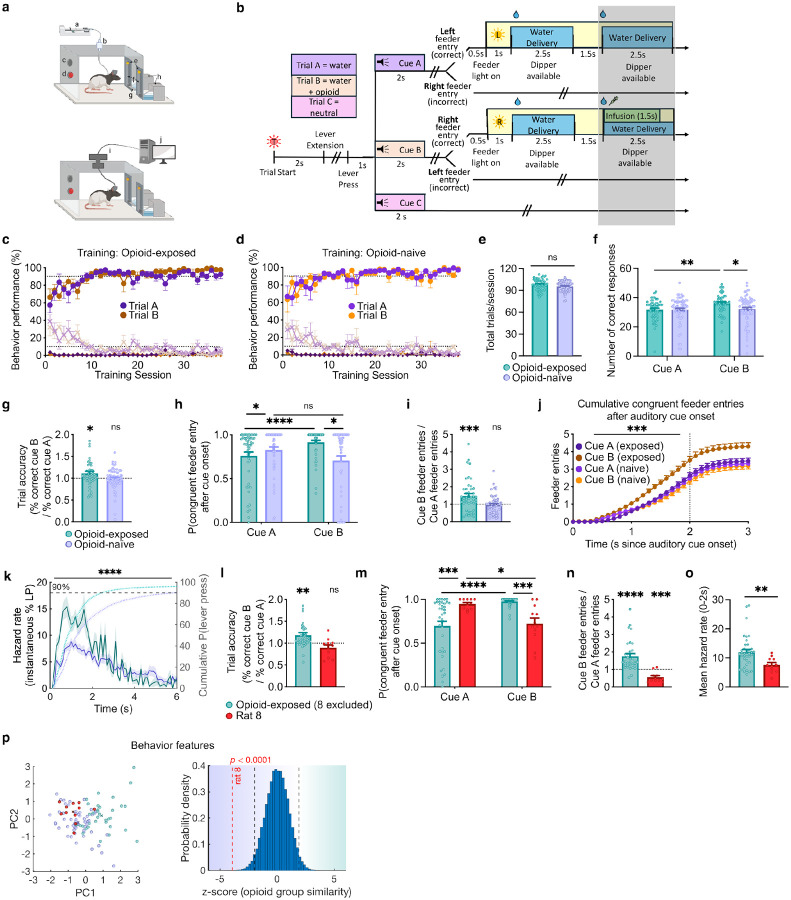
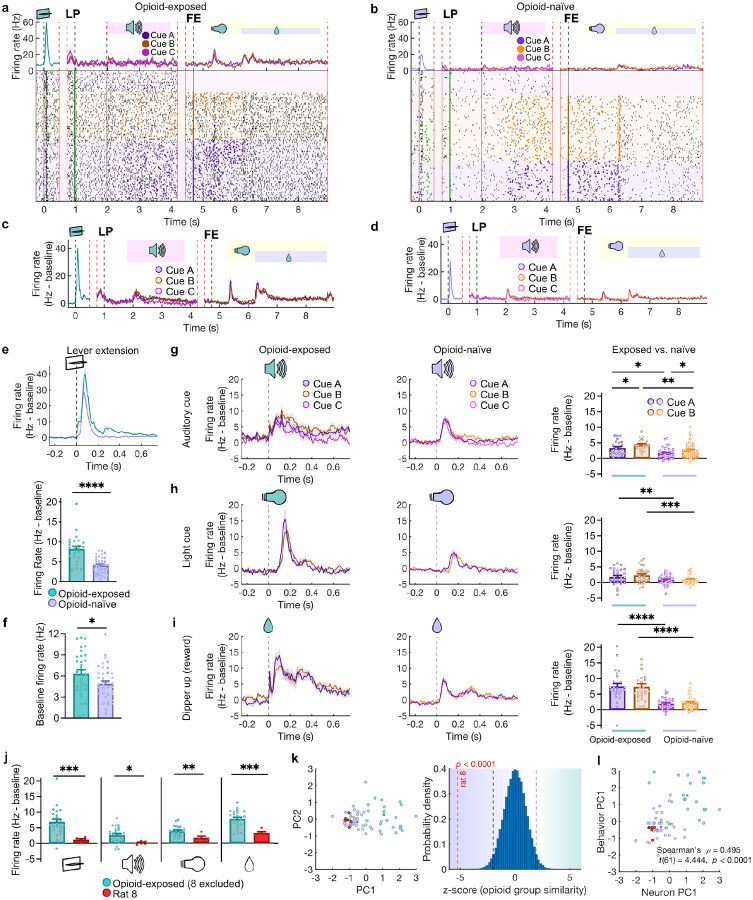
Cue reactivity is the maladaptive neurobiological and behavioral response upon exposure to drug cues and is a major driver of relapse. The leading hypothesis is that dopamine release by addictive drugs represents a persistently positive reward prediction error that causes runaway enhancement of dopamine responses to drug cues, leading to their pathological overvaluation compared to non-drug reward alternatives. However, this hypothesis has not been directly tested. Here we developed Pavlovian and operant procedures to measure firing responses, within the same dopamine neurons, to drug versus natural reward cues, which we found to be similarly enhanced compared to cues predicting natural rewards in drug-naïve controls. This enhancement was associated with increased behavioral reactivity to the drug cue, suggesting that dopamine release is still critical to cue reactivity, albeit not as previously hypothesized. These results challenge the prevailing hypothesis of cue reactivity, warranting new models of dopaminergic function in drug addiction, and provide critical insights into the neurobiology of cue reactivity with potential implications for relapse prevention.


Figures

Fig. 1.
Fig. 1.. Pavlovian experimental procedure.
(a) Schematic of operant chamber for training/recording in Experiment 1. (b) Example waveform showing stability over a two-hour recording session. Color corresponds to action potential amplitude. (c) Pavlovian conditioning of three 5-s tones predicting sucrose (blue), remifentanil (RMF, green), or nothing (neutral, red). (d) Example responses of putative dopamine responses to cued sucrose reward (top), reward omission (middle), and uncued reward (bottom). (e) Rasters and post-stimulus time histogram (PSTH) showing example dopamine neuron firing after RMF infusion (2 infusions of 4 μg/kg RMF) with onset of RMF effect at ~10 s post-infusion. (f) PSTH for neuronal data of onset and duration of effect of RMF at doses of 0.5 to16 μg/kg/infusion (activation terminates by ~2.5 min for 4 μg/kg). (g) Total time (left) and probability (right) of rat in sucrose reward well during sucrose and neutral cue presentations in opioid-naïve rats (n = 22, Wilcoxon test, z = −2.105, p < 0.0001). Lines and shades represent means ± SEM. (h) Same as h but in opioid-exposed animals after sucrose, RMF, and neutral cues (n = 50, Friedman test, F = 75.36, p < 0.0001).
Fig. 2.
Fig. 2.. Similar within-neuron dopamine firing responses to sucrose and RMF predictive cues.
(a) Dopamine neuron identification. (i) Heatmap showing functional activation of each unit (rows) aligned to sucrose cue onset (0 s). Activity normalized using area under receiver-operator curve (auROC) method, compared against baseline. Scales from 0 to 1. (ii) First three components extracted via PCA. (iii) Dendrogram showing results from hierarchical clustering. (iv) Mean auROC for units classified into each cluster. (v) PSTH and raster plots from example units for each cluster. (b) Example responses from a single unit to sucrose (blue, top), RMF (green, middle), and neutral (red, bottom) cues. Red and blue shaded regions indicate distinct phases of cue response reflecting detection (30 – 180 ms) and valuation (180 – 500 ms). Inset waveform represents mean of sorted unit. Scale bars: 50 μV and 500 ms. (c) PSTH traces showing average dopamine firing during sucrose (blue, 40 μL), RMF (green, 4 μg/kg), and neutral trials (red). (d) Mean baseline-subtracted firing rates during cue response to sucrose, RMF, and neutral cues (Friedman test, F = 31.71, p < 0.0001). (e) Close-up of cue period from Fig. 2c. (f) Scatter plot of individual units’ responses to sucrose (abscissa) and RMF (ordinate) cues during the detection phase. Inset: cue responses during the detection phase (F = 16.29, p = 0.0003). (g) Individual units’ responses during the evaluation phase presented as in Fig. 2f. Inset: cue responses during the evaluation phase (Friedman statistic = 28.67, p < 0.0001).
Fig. 3.
Fig. 3.. Sensitized dopamine neuron responses in opioid-exposed rats in the Pavlovian procedure.
(a) PSTH and raster plot examples from a single opioid-exposed unit. Vertical lines indicate cue onset (0 s) and cue offset/sucrose delivery (5 s). Red = neutral trials, green = RMF (4μg/kg), and blue = sucrose (40μL). (b) PSTH and raster plot examples from a single opioid-naïve unit. Display similar to a, with purple = sucrose and pink = neutral trials. (c) Mean firing rates prior to the start of session for each putative opioid-exposed (blue) vs. opioid-naïve (purple) units (t-test, t(97) = 2.060, p = 0.0421). (d) Comparison of previous training quantified as number of sucrose trials prior to the recording session (Mann-Whitney test, n = 75, U = 499, p = 0.2586). (e) (i) Average dopamine firing during sucrose and neutral (red) trials in opioid-exposed units (same data as Fig. 2). (ii) Close-up of cue response in opioid-exposed units. (iii) Close-up of reward delivery response in opioid-exposed units. (f) (i) Average dopamine firing during sucrose and neutral (red) trials in opioid-naïve units. (ii) Close-up of cue response in opioid-naive units. (iii) Close-up of reward delivery response in opioid-naïve units. (g), Comparison of mean cue response to sucrose cues in opioid-exposed (blue) vs. opioid-naïve (purple) units (n = 43, U = 131, p = 0.0145). (h) Comparison of mean cue response to neutral cues in opioid-exposed (red) vs. opioid-naïve (pink) units (n = 43, U = 120, p = 0.0064). (i) Comparison of mean response to sucrose delivery (0 – 400 ms after cue termination) (n = 43, U = 118, p = 0.0054). (j) Trace of dopamine responses at time of reward omission in opioid-exposed (blue) and opioid-naïve units (purple). Red and blue shaded regions reflect positive (0-200 ms) and negative (200-1000 ms) response periods 1 and 2, respectively. (k) Comparison of omission firing responses during period 1 and 2 between opioid-exposed and opioid-naïve units (2-way RM ANOVA, Period factor: F(1,33) = 25.05, p < 0.0001; Exposure factor: F(1,33) = 6.087, p = 0.0190; Period x Exposure interaction F(1,33) = 9.022, p = 0.0051).
Fig. 4.
Fig. 4.. Operant experimental procedure demonstrates behavioral drug-cue reactivity.
(a) Schematic of experimental setup during training (top) and recording (bottom) sessions in Experiment 2. Boxes equipped with infusion pump (a), swivel (b), speaker (c), trial light (d), feeder lights I, feeders (f), retractable lever (g), dippers (h), commutator (i), and recording computer (j). (b) Experimental design. Gray shading indicates omitted reward in block two of recording trials. (c) Behavior training results for opioid-exposed animals. Circles indicate % correct responses, Xs indicate % incorrect, and diamonds indicate % not responded to. (d) Similar to 4c for opioid-naïve rats. (e) Total number of trials completed per recording session for opioid-exposed and opioid-naïve rats (n = 106, U = 1135, p = 0.0975). (f) Number of correct responses per session to Cue A and Cue B (2-way RM ANOVA, Cue factor: F(1,114) = 4.786, p = 0.0307. (g) Trial accuracy response index for opioid-exposed and opioid-naïve animals (one-sample t tests, Ho: μ = 1. Opioid-exposed: t = 2.168, df = 47, p = 0.0353; Opioid-naïve: t = 0.8954, df = 63, p = 0.3740). (h) Probability that first feeder entry after cue onset is congruent with cue identity (2-way RM ANOVA, opioid exposure factor: F(1,101) = 5.032, p = 0.027; interaction F(1,101) = 8.621, p = 0.0041). (i) Ratio of total congruent feeder entries for Cue B/Cue A in both groups (one-sample t tests. Opioid-exposed: t = 3.343, df = 46, p = 0.0017; Opioid-naïve: t = 0.6371, df = 54, p = 0.5268). (j) Cumulative congruent feeder entries following auditory cue onset (F-test for difference of slopes, F(3,156) = 5.482, p = 0.0013). (k) Left axis: Session-mean of lever press hazard rate. 2-way Mixed effects model, Opioid-exposure factor: F(1,108) = 24.04, p < 0.0001). Right axis: cumulative % of sessions with lever press at time t is shifted to the left in opioid-exposed rats. (l-n) As in h-j respectively, but for rat 8 (red) and all other opioid-exposed animals: m (Opioid-exposed: t = 3.284, df = 36, p = 0.0023; rat 8: t = 1.730, df = 11, p = 0.1115); n (interaction F(1,47) = 22.4, p = <0.0001); o (Opioid-exposed: t = 5.352, df = 34, p < 0.0001; rat 8: t = 5.000, df = 10, p = 0.0005). (o) Mean hazard rate for lever press during 0-2 s after lever extension in rat 8 vs. other opioid-exposed rats (n = 49, U = 91, p = 0.0038). (p) Left: First two PCs extracted from composite behavior measures for opioid-naïve rats (purple), rat 8 (red filled), and all other opioid-exposed rats (teal). Crosses represent corresponding centroids. Right: Mean difference of rat 8 centroid under true labels (red dashed line) compared to bootstrapped distribution under shuffled labeling shows greater similarity of rat 8 to the opioid-naïve group. Black dashed lines indicate two-tailed 95% threshold of null distribution.
Fig. 5.
Fig. 5.. Sensitized dopamine responses to drug and non-drug cues in opioid-exposed rats with behavioral drug-cue reactivity.
(a) PSTH and raster plot examples from a single opioid-exposed unit. Vertical red lines indicate timeline discontinuity due to variable intervals within trials. Vertical black lines indicated discrete events: lever extension, lever press, and rewarded feeder entry. Purple trace includes all trials, which subsequently split based on trial identity to corresponding colors. Purple and orange dots indicate left and right feeder entries respectively. Green dots indicate lever presses. (b) Similar to a but for an opioid-naive unit. (c) Mean PSTH from opioid-exposed units displayed like in a. (d) Mean PSTH from opioid-naïve units. (e) Top: PSTH of baseline-subtracted firing rate around lever extension for opioid-exposed and opioid-naïve units. Bottom: mean firing rate for both groups (Mann-Whitney test, n = 62, U = 124, p < 0.0001). (f) Baseline firing rate for opioid-exposed (teal) and opioid-naïve (purple) units (t-test, df = 67, t = 2.117, p = 0.0379). (g) Responses of opioid-exposed and opioid-naïve units to the auditory cues. Right: mean firing rates (2-way RM mixed-effects analysis, Cue factor: F(1,64) = 10.79, p = 0.0017; Exposure factor: F(1,65) = 8.157, p = 0.0058). (h) Responses of opioid-exposed and opioid-naïve units to light cue. Right: mean firing rates (trial-type factor: F(1,60) = 2.110, p = 0.1515; Exposure factor: F(1,62) = 11.96, p = 0.0010). (i) Responses of opioid-exposed and opioid-naïve neurons to water reward delivery. Right: mean firing rates (trial-type factor: F(1,61) = 0.1357, p = 0.7139; Exposure factor: F(1,62) = 38.41, p < 0.0001). (j) Mean responses of neurons from rat 8 (red) vs. all other opioid-exposed units in response to lever extension (t(27) = 3.695, p = 0.0010), auditory cue (A and B; t(27) = 2.915, p = 0.0071), light cue (A and B; t(27) = 2.609, p = 0.0355) and reward delivery (A and B; U = 8, p = 0.0008). (k) Left: First two PCs extracted from composite firing measures for opioid-naïve rats (purple), rat 8 (red filled), and all other opioid-exposed rats (teal). Crosses represent corresponding centroids. Right: Mean difference of rat 8 centroid under true labels compared to bootstrapped distribution under shuffled labeling plotted like in Fig. 4p shows greater similarity of rat 8 to the opioid-naïve group. (l) Scatter plot of PC1 from neuron firing activity analysis in K vs. PC1 from behavior analysis from Fig. 4p shows moderate positive correlation between behavioral cue reactivity and and dopamine firing response.

Similar articles

References

    1. Ahmed S. H., Lenoir M. and Guillem K. (2013). "Neurobiology of addiction versus drug use driven by lack of choice." Curr Opin Neurobiol 23(4): 581–587. - PubMed
    1. Azcorra M., Gaertner Z., Davidson C., He Q., Kim H., Nagappan S., Hayes C. K., Ramakrishnan C., Fenno L., Kim Y. S., Deisseroth K., Longnecker R., Awatramani R. and Dombeck D. A. (2023). "Unique functional responses differentially map onto genetic subtypes of dopamine neurons." Nat Neurosci 26(10): 1762–1774. - PMC - PubMed
    1. Berke J. D. and Hyman S. E. (2000). "Addiction, dopamine, and the molecular mechanisms of memory." Neuron 25(3): 515–532. - PubMed
    1. Berridge K. C. and Robinson T. E. (2016). "Liking, wanting, and the incentive-sensitization theory of addiction." Am Psychol 71(8): 670–679. - PMC - PubMed
    1. Caprioli D., Zeric T., Thorndike E. B. and Venniro M. (2015). "Persistent palatable food preference in rats with a history of limited and extended access to methamphetamine self-administration." Addict Biol 20(5): 913–926. - PMC - PubMed

Methods references

    1. Moussawi K., Zhou W., Shen H., Reichel C. M., See R. E., Carr D. B. and Kalivas P. W. (2011). "Reversing cocaine-induced synaptic potentiation provides enduring protection from relapse." Proc Natl Acad Sci U S A 108(1): 385–390. - PMC - PubMed
    1. Paxinos G. and Watson C. (2007). The rat brain in stereotaxic coordinates. Oxford, Academic Press. - PubMed
    1. Richardson N. R. and Roberts D. C. (1996). "Progressive ratio schedules in drug self-administration studies in rats: a method to evaluate reinforcing efficacy." J Neurosci Methods 66(1): 1–11. - PubMed
    1. Roesch M. R., Calu D. J. and Schoenbaum G. (2007). "Dopamine neurons encode the better option in rats deciding between differently delayed or sized rewards." Nat Neurosci 10(12): 1615–1624. - PMC - PubMed
    1. Takahashi Y. K., Batchelor H. M., Liu B., Khanna A., Morales M. and Schoenbaum G. (2017). "Dopamine Neurons Respond to Errors in the Prediction of Sensory Features of Expected Rewards." Neuron 95(6): 1395–1405 e1393. - PMC - PubMed

Publication types