

This is a preprint.
Developmental maturation of millimeter-scale functional networks across brain areas
- PMID: 38853883
- PMCID: PMC11160666
- DOI: 10.1101/2024.05.28.595371
Developmental maturation of millimeter-scale functional networks across brain areas
Update in
-
Developmental maturation of millimeter-scale functional networks across brain areas.Cereb Cortex. 2025 Feb 5;35(2):bhaf007. doi: 10.1093/cercor/bhaf007. Cereb Cortex. 2025. PMID: 39866127 Free PMC article.
Abstract
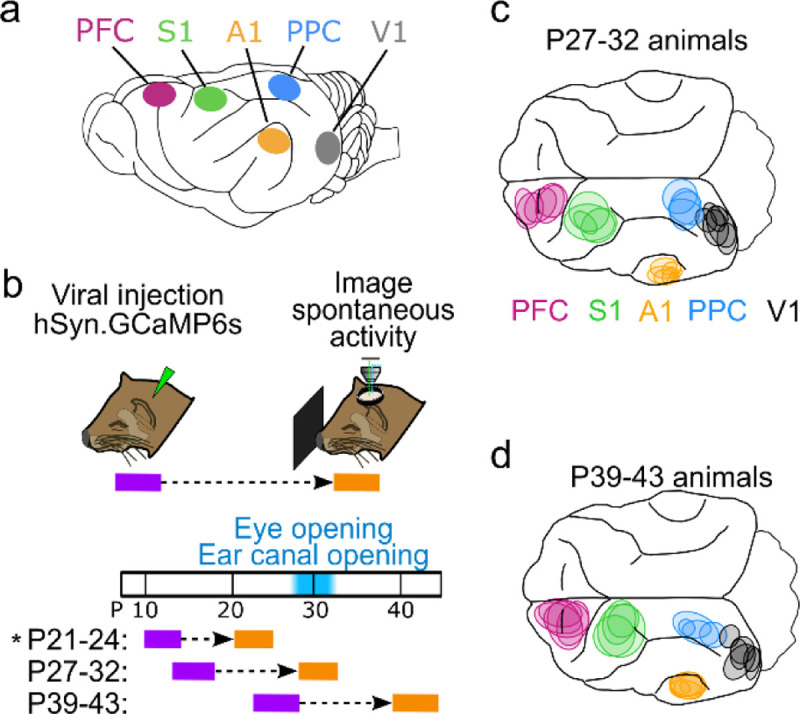
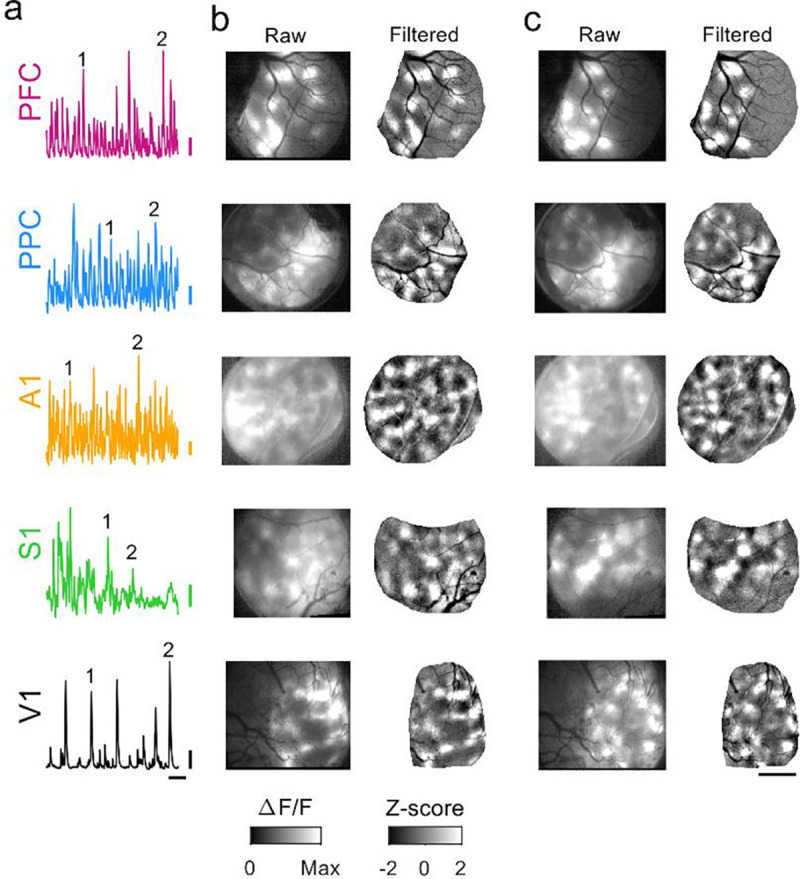
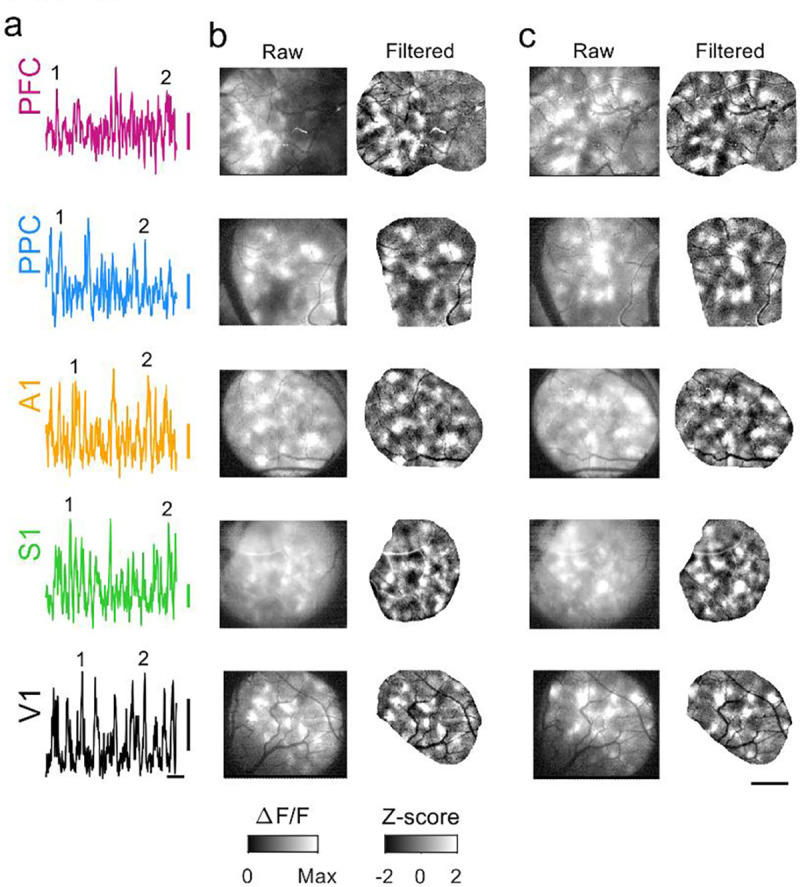
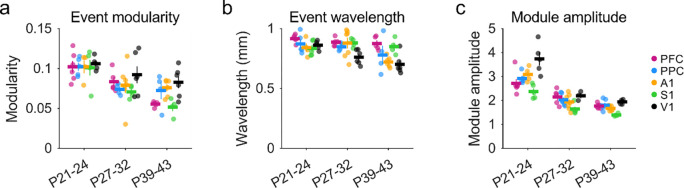
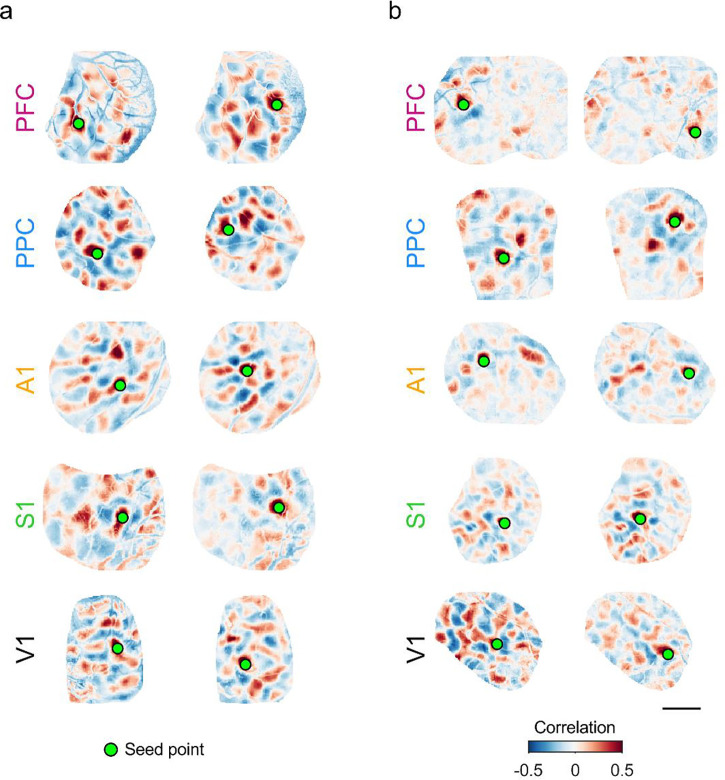
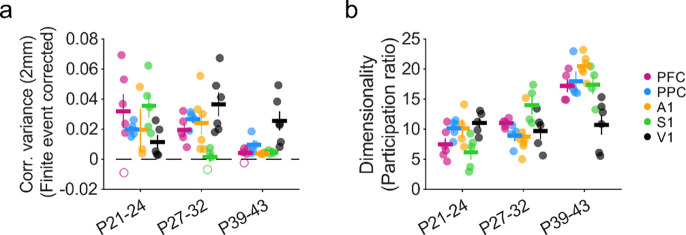
Interacting with the environment to process sensory information, generate perceptions, and shape behavior engages neural networks in brain areas with highly varied representations, ranging from unimodal sensory cortices to higher-order association areas. Recent work suggests a much greater degree of commonality across areas, with distributed and modular networks present in both sensory and non-sensory areas during early development. However, it is currently unknown whether this initially common modular structure undergoes an equally common developmental trajectory, or whether such a modular functional organization persists in some areas-such as primary visual cortex-but not others. Here we examine the development of network organization across diverse cortical regions in ferrets of both sexes using in vivo widefield calcium imaging of spontaneous activity. We find that all regions examined, including both primary sensory cortices (visual, auditory, and somatosensory-V1, A1, and S1, respectively) and higher order association areas (prefrontal and posterior parietal cortices) exhibit a largely similar pattern of changes over an approximately 3 week developmental period spanning eye opening and the transition to predominantly externally-driven sensory activity. We find that both a modular functional organization and millimeter-scale correlated networks remain present across all cortical areas examined. These networks weakened over development in most cortical areas, but strengthened in V1. Overall, the conserved maintenance of modular organization across different cortical areas suggests a common pathway of network refinement, and suggests that a modular organization-known to encode functional representations in visual areas-may be similarly engaged in highly diverse brain areas.
Conflict of interest statement
The authors declare no competing financial interests.
Figures
Similar articles
-
Developmental maturation of millimeter-scale functional networks across brain areas.Cereb Cortex. 2025 Feb 5;35(2):bhaf007. doi: 10.1093/cercor/bhaf007. Cereb Cortex. 2025. PMID: 39866127 Free PMC article.
-
Common modular architecture across diverse cortical areas in early development.Proc Natl Acad Sci U S A. 2024 Mar 12;121(11):e2313743121. doi: 10.1073/pnas.2313743121. Epub 2024 Mar 6. Proc Natl Acad Sci U S A. 2024. PMID: 38446851 Free PMC article.
-
The Role of Inhibitory Interneurons in Circuit Assembly and Refinement Across Sensory Cortices.Front Neural Circuits. 2022 Apr 7;16:866999. doi: 10.3389/fncir.2022.866999. eCollection 2022. Front Neural Circuits. 2022. PMID: 35463203 Free PMC article. Review.
-
From sensation to cognition.Brain. 1998 Jun;121 ( Pt 6):1013-52. doi: 10.1093/brain/121.6.1013. Brain. 1998. PMID: 9648540 Review.
-
Dissociable Changes of Frontal and Parietal Cortices in Inherent Functional Flexibility across the Human Life Span.J Neurosci. 2016 Sep 28;36(39):10060-74. doi: 10.1523/JNEUROSCI.1476-16.2016. Epub 2016 Sep 28. J Neurosci. 2016. PMID: 27683903 Free PMC article.
References
-
- Abbott LF, Rajan K, Sompolinsky H (2011) Interactions between Intrinsic and Stimulus-Evoked Activity in Recurrent Neural Networks. In: The Dynamic Brain: An Exploration of Neuronal Variability and Its Functional Significance (Glanzman MD and D, ed), pp 65–82. New York: Oxford University Press, Inc.
-
- Adi N (2021) Fast 2D peak finder. MATLAB Central File Exchange Available at: https://www.mathworks.com/matlabcentral/fileexchange/37388-fast-2d-peak-....
-
- Blasdel GG, Salama G (1986) Voltage-sensitive dyes reveal a modular organization in monkey striate cortex. Nature 321:579–585. - PubMed
Publication types
Grants and funding
LinkOut - more resources
Full Text Sources
Research Materials