[Preprint]. 2024 May 30:2024.05.28.24308027.
doi: 10.1101/2024.05.28.24308027.

Enhancing the Diagnostic Utility of ASL Imaging in Temporal Lobe Epilepsy through FlowGAN: An ASL to PET Image Translation Framework

Affiliations

Enhancing the Diagnostic Utility of ASL Imaging in Temporal Lobe Epilepsy through FlowGAN: An ASL to PET Image Translation Framework

Alfredo Lucas et al. medRxiv. .

Abstract

Background and significance: Positron Emission Tomography (PET) using fluorodeoxyglucose (FDG-PET) is a standard imaging modality for detecting areas of hypometabolism associated with the seizure onset zone (SOZ) in temporal lobe epilepsy (TLE). However, FDG-PET is costly and involves the use of a radioactive tracer. Arterial Spin Labeling (ASL) offers an MRI-based quantification of cerebral blood flow (CBF) that could also help localize the SOZ, but its performance in doing so, relative to FDG-PET, is limited. In this study, we seek to improve ASL's diagnostic performance by developing a deep learning framework for synthesizing FDG-PET-like images from ASL and structural MRI inputs.

Methods: We included 68 epilepsy patients, out of which 36 had well lateralized TLE. We compared the coupling between FDG-PET and ASL CBF values in different brain regions, as well as the asymmetry of these values across the brain. We additionally assessed each modality's ability to lateralize the SOZ across brain regions. Using our paired PET-ASL data, we developed FlowGAN, a generative adversarial neural network (GAN) that synthesizes PET-like images from ASL and T1-weighted MRI inputs. We tested our synthetic PET images against the actual PET images of subjects to assess their ability to reproduce clinically meaningful hypometabolism and asymmetries in TLE.

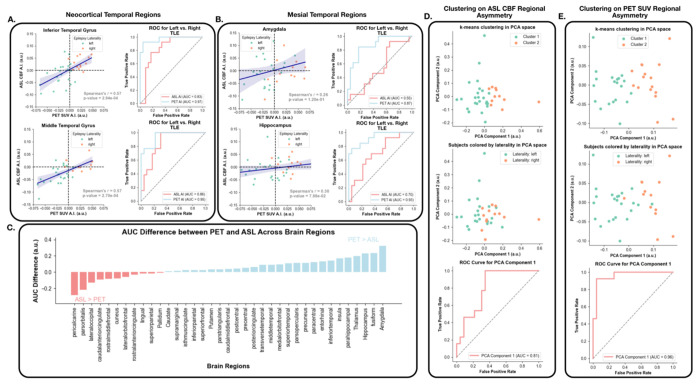
Results: We found variable coupling between PET and ASL CBF values across brain regions. PET and ASL had high coupling in neocortical temporal and frontal brain regions (Spearman's r > 0.30, p < 0.05) but low coupling in mesial temporal structures (Spearman's r < 0.30, p > 0.05). Both whole brain PET and ASL CBF asymmetry values provided good separability between left and right TLE subjects, but PET (AUC = 0.96, 95% CI: [0.88, 1.00]) outperformed ASL (AUC = 0.81; 95% CI: [0.65, 0.96]). FlowGAN-generated images demonstrated high structural similarity to actual PET images (SSIM = 0.85). Globally, asymmetry values were better correlated between synthetic PET and original PET than between ASL CBF and original PET, with a mean correlation increase of 0.15 (95% CI: [0.07, 0.24], p<0.001, Cohen's d = 0.91). Furthermore, regions that had poor ASL-PET correlation (e.g. mesial temporal structures) showed the greatest improvement with synthetic PET images.

Conclusions: FlowGAN improves ASL's diagnostic performance, generating synthetic PET images that closely mimic actual FDG-PET in depicting hypometabolism associated with TLE. This approach could improve non-invasive SOZ localization, offering a promising tool for epilepsy presurgical assessment. It potentially broadens the applicability of ASL in clinical practice and could reduce reliance on FDG-PET for epilepsy and other neurological disorders.


Conflict of interest statement

Competing Interests Thomas Campbell Arnold is an employee of Subtle Medical, but this work is unrelated to his work at the company. He contributed to this work during his time at the University of Pennsylvania. The rest of the authors report no competing or financial interests.

Figures

Figure 1 –
Figure 1 –. Image processing pipeline:
Panel A. demonstrates the imaging pipeline used to pre-process the PET and ASL data for each subject. ASL data was preprocessed with ASLprep which performed cerebral blood flow (CBF) estimation and T1w MRI co-registration of the resulting CBF map. FDG-PET images were co-registered to the T1w image of each subject as well. Using FreeSurfer, Desikan-Killiany-Tourville atlas parcellations were extracted from each subject’s T1w image, and the corresponding PET SUV and ASL CBF values within each of these parcels was estimated. Panel B. shows the PET SUV and ASL CBF (Gaussian smoothed with σ=3) maps for the same subject. Red arrow points to a region of congruent hypometabolism and hypoperfusion.
Figure 2 –
Figure 2 –. SUVR and CBF raw and asymmetry regional correlations:
Panel A. shows the Spearman rank correlation between PET SUVR and ASL CBF across subjects for each DKT brain region. Panel B. (left) shows the Spearman rank correlation between PET SUV and ASL CBF left-right asymmetry across subjects for each DKT brain region; (middle) shows the asymmetry scatterplot between PET and ASL asymmetry values for the inferior temporal gyrus parcel (high correlation between PET and ASL); (right) shows the asymmetry scatterplot between PET and ASL asymmetry values for the precuneus parcel (low correlation between PET and ASL). In the scatterplots, each dot represents a subject, and left TLE and right TLE subjects are shown in different colors. Dashed lines represent zero asymmetry.
Figure 3 –
Figure 3 –. Comparison of SOZ lateralization between PET and ASL:
Panel A. shows the asymmetry scatterplot between PET and ASL asymmetry values as well as the corresponding ROC for separating left TLE from right tLe using PET or ASL asymmetry in the (top) inferior temporal gyrus and (bottom) middle temporal gyrus. Panel B. shows the same but in the amygdala (top) and hippocampus (bottom). In the scatterplots, each dot represents a subject, and left TLe and right TLE subjects are shown in different colors. Dashed lines represent zero asymmetry. Panel C. shows the difference in the area under the ROC curve between PET and ASL asymmetry across brain regions. Panel D. shows a scatterplot of the first two principal components generated by the ASL CBF asymmetry values across all brain regions, with (top) each subject colored according to their cluster assignment after k-means clustering, and (middle) each subject colored according to their epilepsy laterality. The ROC curve at the bottom shows the separability between left and right TLE based on the values of the first principal component. Panel E. shows the same as D. but for the PET SUV asymmetry values. A.I. asymmetry index.
Figure 4 –
Figure 4 –. FlowGAN overview and representative test subject output:
Panel A. shows an overview of the FlowGAN architecture, with axial, sagittal, and coronal inputs into 3 parallel pix2pix networks that are eventually combined through averaging and diffusion smoothing. Panel B. shows the original PET as well as the corresponding synthetic PET across all three imaging planes for the same subject.
Figure 5 –
Figure 5 –. FlowGAN outputs for left and right TLE example test set subjects:
Three co-registered inputs to FlowGAN as well as the corresponding synthetic PET output, and the actual PET image for a left TLE (A.) and a right TLE (B.) subject. In both cases, there is a region of hypometabolism in the temporal lobe (red arrow) consistent with the lateralization of the SOZ in both the synthetic and actual PET images. Both subjects were left-out subjects not seen by the model during training.
Figure 6 –
Figure 6 –. Relationship between FlowGAN outputs and original PET images across brain regions:
Panel A. (left) shows a representative scatterplot between synthetic PET and original PET (green) values as well as original ASL CBF and original PET (orange) values for a single subject across brain regions. Each point represents one brain region, and the dashed line represents the unity line. The right side shows the boxplot comparing the correlations for all subjects across brain regions for original PET and synthetic PET for one boxplot, and original PET and original ASL for the other boxplot. The same subjects in each boxplot are connected by a line. Panel B. shows the same as A. but for asymmetry values across brain regions. Panel C. (left) shows the scatterplot between original PET - synthetic PET, and original PET – original ASL CBF asymmetry correlations across subjects for the different brain regions. Each dot represents a different brain region. Blue dots show an asymmetry correlation difference in favor of synthetic PET of more than 1 standard deviation, and red dots represent an asymmetry correlation difference in favor of ASL of more than 1 standard deviation. Gray dots are under the 1 standard deviation threshold. The right side of C. shows the asymmetry correlation difference between the two approaches across brain regions. Panel D. shows the scatterplot between (left) original ASL CBF and PET asymmetry values and (middle) synthetic PET and original PET asymmetry values across subjects in the hippocampus. In both cases, subjects that have the same direction of asymmetry (i.e. both positive, or both negative) between the two compared modalities (i.e. subjects with congruent measurements) are shown as blue Xs, whereas subjects with incongruent measurements are shown as red Xs. The right side shows the congruency difference between the two approaches across brain regions.

Similar articles

References

    1. Téllez-Zenteno JF, Hernández-Ronquillo L. A review of the epidemiology of temporal lobe epilepsy. Epilepsy Res Treat. 2012;2012:630853. doi:10.1155/2012/630853 - DOI - PMC - PubMed
    1. Wiebe S, Blume WT, Girvin JP, Eliasziw M, Effectiveness and Efficiency of Surgery for Temporal Lobe Epilepsy Study Group. A randomized, controlled trial of surgery for temporal-lobe epilepsy. N Engl J Med. 2001;345(5):311–318. doi:10.1056/NEJM200108023450501 - DOI - PubMed
    1. Engel J, McDermott MP, Wiebe S, et al. Early Surgical Therapy for Drug-Resistant Temporal Lobe Epilepsy: A Randomized Trial. JAMA. 2012;307(9):922–930. doi:10.1001/jama.2012.220 - DOI - PMC - PubMed
    1. Chassoux F, Artiges E, Semah F, et al. 18F-FDG-PET patterns of surgical success and failure in mesial temporal lobe epilepsy. Neurology. 2017;88(11):1045–1053. doi:10.1212/WNL.0000000000003714 - DOI - PubMed
    1. Sarikaya I. PET studies in epilepsy. Am J Nucl Med Mol Imaging. 2015;5(5):416–430. - PMC - PubMed

Publication types