[Preprint]. 2024 May 30:rs.3.rs-4415143.
doi: 10.21203/rs.3.rs-4415143/v1.

Oligomeric amyloid beta prevents myelination in a clusterin-dependent manner

Affiliations

Oligomeric amyloid beta prevents myelination in a clusterin-dependent manner

Rebecca M Beiter et al. Res Sq. .

Abstract

Background: White matter loss is a well-documented phenomenon in Alzheimer's disease (AD) patients that has been recognized for decades. However, the underlying reasons for the failure of oligodendrocyte progenitor cells (OPCs) to repair myelin deficits in these patients remain elusive. A single nucleotide polymorphism (SNP) in Clusterin has been identified as a risk factor for late-onset Alzheimer's disease and linked to a decrease in white matter integrity in healthy adults, but its specific role in oligodendrocyte function and myelin maintenance in Alzheimer's disease pathology remains unclear.

Methods: To investigate the impact of Clusterin on OPCs in the context of Alzheimer's disease, we employed a combination of immunofluorescence and transmission electron microscopy techniques, primary culture of OPCs, and an animal model of Alzheimer's disease.

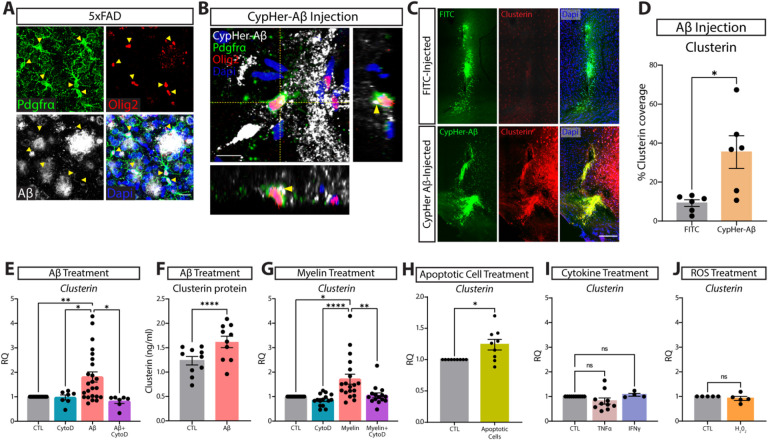
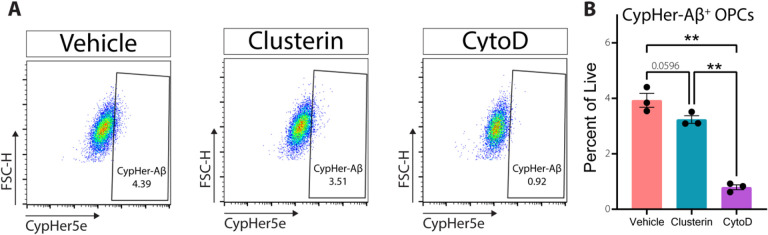
Results: Our findings demonstrate that Clusterin, a risk factor for late-onset AD, is produced by OPCs and inhibits their differentiation into oligodendrocytes. Specifically, we observed upregulation of Clusterin in OPCs in the 5xFAD mouse model of AD. We also found that the phagocytosis of debris, including amyloid beta (Aβ), myelin, and apoptotic cells leads to the upregulation of Clusterin in OPCs. In vivo experiments confirmed that Aβ oligomers stimulate Clusterin upregulation and that OPCs are capable of phagocytosing Aβ. Furthermore, we discovered that Clusterin significantly inhibits OPC differentiation and hinders the production of myelin proteins. Finally, we demonstrate that Clusterin inhibits OPC differentiation by reducing the production of IL-9 by OPCs.

Conclusion: Our data suggest that Clusterin may play a key role in the impaired myelin repair observed in AD and could serve as a promising therapeutic target for addressing AD-associated cognitive decline.

Keywords: Alzheimer’s Disease; IL-9; Oligodendrocyte progenitor cells; clusterin; myelin.


Conflict of interest statement

Competing interest The authors have no competing interests.

Figures

Figure 1
Figure 1. OPCs expresses the AD-risk factor clusterin.
A, Representative image of Clusterin expression (immunohistochemistry, brown) in the cortex from a normal aging patient and a late-stage AD patient B, Quantification of clusterin coverage in the cortex of normal aging (n=15) and AD patients (n=26, from two independent experiments, depicted in A). Data analyzed using an unpaired t-test; t(39)=3.767. C, Detection of clusterin RNA (in situ hybridization, red) and Aβ protein (immunohistochemistry, brown) in late-stage AD brain (late-stage AD n=2; from two independent experiment). Arrowheads indicate clusterin-expressing cells around plaques. D, Representative images of clusterin expression (white) in the cortex and hippocampus of WT and 5xFAD mice. Scale bar=30μm. E, Quantification of clusterin coverage in the cortex and hippocampus of WT and 5xFAD mice (depicted in C; WT n=6, 5xFAD n=6; from two independent experiments). Statistics calculated using an unpaired Student’s t-test. Cortex: t(10)=5.049; Hippocampus: t(10)=3.119. F, In situ hybridization for OPCs (PDGFRAin green, OLIG2in white) expressing Clusterin (CLU; red) in normal aging and late-stage AD brains (normal aging n=1, late-stage AD n=1; from one independent experiment). Scale bar=10μm. G, Representative images of clusterin expression (red) in OPCs (Pdgfra; green and Olig2; white) in the cortex and hippocampus of WT and 5xFAD mice. Colocalization of Pdgfra and clusterin depicted in purple. Scale bar=20μm. H, quantification of the percentage of Pdgfra that colocalizes with clusterin in the cortex and hippocampus of WT and 5xFAD mice (depicted in G; WT n=9, 5xFAD n=9; from two independent experiments). Statistics calculated using an unpaired Student’s t-test. Cortex: t(16)=2.761; Hippocampus: t(16)=3.765.
Figure 2
Figure 2. Phagocytosis of extracellular debris drives clusterin expression in OPCs.
A, Representative image of OPCs (PDGFRa in green, Olig2 in red) surrounding Aβ plaques (white). Yellow arrowheads indicate OPCs that are extending processes into areas of Aβ accumulation (n=4 mice; from one independent experiment). Scale bar=20μm. B, Representative orthogonal view of CyPher-labeled Aβ (white) inside an OPC (PDGFRa in green, Olig2 in red) following intra-parenchymal injection of Aβ (n=6 mice; from one independent experiment). Yellow arrowheads indicate Aβ that can be seen inside the cell body of an OPC. Scale bar=10μm. C, Representative images of clusterin expression (red) in the ipsilateral (CypHer-Aβ injected; green) and contralateral (FITC injected; green) hemispheres following intra-parenchymal injection. Scale bar=100μm. D, Quantification of clusterin expression in the ipsilateral (Aβ-injected) and contralateral (FITC-injected) hemispheres following intra-parenchymal injection. (n=6 mice). Statistics calculated using a paired Student’s t-test; t(5)=2.979. E, qPCR analysis of clusterin expression in OPCs following a 4-hour in vitro treatment with 3μm Aβ and the phagocytosis blocker CytoD (1μm) or vehicle control (CTL n=24, CytoD n=7, Aβ n=24, Aβ+CytoD n=7; from seven independent experiments). Statistics calculated using a mixed effects analysis with a Tukey’s post-hoc analysis; F(1.121, 13.08) = 8.544. F, Quantification of clusterin protein in OPCs following 72-hour treatment with 3μM Aβ or vehicle control (CTL n=10, Aβ n=10, from two independent experiments). Statistics calculated using a paired Student’s t-test; t(9)=7.596. G, qPCR analysis of clusterin expression in OPCs following a 4-hour in vitro treatment with 100μg/ml myelin and CytoD (1μm) or vehicle control (CTL n=19, CytoD n=15, Myelin n=19, Myelin+CytoD n=15; from five independent experiments). Statistics calculated using a mixed effects analysis with a Tukey’s post-hoc analysis; F (1.389, 21.29) = 10.75. H, qPCR analysis of clusterin expression in OPCs following a 6-hour in vitro treatment with apoptotic cells (CTL n=9, Apoptotic cells n=9; from two independent experiments). Statistics calculated using a paired Student’s t-test; t(8)=2.835. I, qPCR analysis of clusterin expression in OPCs following a 3-hour in vitro treatment with 10ng/ml TNFα or 10ng/ml IFNγ (CTL n=10, TNFα n=10, IFNγ n=4; from 2 independent TNFα experiments or 1 independent IFNγ experiment). Statistics calculated using a mixed effects analysis; F (1.106, 11.61) = 1.897. J, qPCR analysis of clusterin expression in OPCs following a 3-hour in vitro treatment with 10μm H202 (n=5; from one independent experiment). Statistics calculated using a paired Student’s t-test; t(8)=0.3417. *p<0.05, **p<0.01, ****p<0.0001, ns=not significant. All error bars represent SEM.
Figure 3
Figure 3. Clusterin does not alter OPC phagocytosis of oligomeric Aβ.
A, Representative flow gating (following singlets/singlets/live gates) of OPCs incubated for 90 minutes with 3μm CypHer5e-labeled Aβ oligomers (all conditions) with the addition of 8μg/ml clusterin or CytoD (Vehicle n=3, Clusterin n=3, CytoD n=3; from one independent experiment). CypHer+ gate was drawn so that less than 1% of cells in the CytoD samples fell within the positive gate. B, Quantification of OPCs staining positive for CypHer-Aβ as depicted in A. Statistics calculated using a repeated measures one-way ANOVA with a Tukey’s post-hoc analysis; F(2,4)= 293.3. **p<0.01. All error bars represent SEM.
Figure 4
Figure 4. Exogenous clusterin inhibits OPC differentiation.
Expression of Mbp (A), Plp1 (B), Cnp(C), and Myrf (D), measured by qPCR in OPCs cultured in proliferation media (OPC Vehicle), differentiation media (OLG Vehicle), or differentiation media supplemented with 8μg/ml of clusterin (OLG Clusterin) for 72 hours (n=7 for all conditions; from 3 independent experiments). Statistics calculated using a repeated measures one-way ANOVA with a Tukey’s post-hoc analysis; Mbp F(2,6)=27.41, Plp1 F(2,6)=25.72, CnpF(2,6)=9.776, Myf F(2,6)=16.41. E, Representative images of OPCs cultured in differentiation media with or without 8μg/ml of clusterin for 72 hours and stained for oligodendrocyte markers (MBP in green, Olig2 in red). Scale bar= 50μm. F, Quantification of the number of OPCs that differentiated in to oligodendrocytes following treatment with clusterin (depicted in E; n=5 for all conditions; from two independent experiments). Statistics calculated using a paired Student’s t-test; t(4)=2.780. G, Quantification of the number of OPCs present using a Cell Counting Kit-8 assay following a 72 hour incubation in proliferation media with or without 8μg/ml clusterin (n=11 for all conditions; from four independent experiments). *p<0.05, **p<0.01, ****p<0.0001, ns=not significant. All error bars represent SEM.
Figure 5
Figure 5. Clusterin inhibits differentiation by blocking IL-9 production.
A, Quantification of cytokines present in the supernatant from OPCs treated with 8μg/mL clusterin or vehicle control (n=6 biological replicates for each condition, from two independent experiments). Data analyzed using a two-way repeated measures ANOVA with a Sidak’s multiple comparison post-hoc analysis, F (6, 34) = 23.93. Expression of Mbp (B), Plp1 (C), and Myrf (D), measured by qPCR in OPCs cultured in proliferation media (OPC Vehicle), differentiation media (OLG Vehicle), differentiation media supplemented with 8μg/ml of clusterin (OLG CLU), differentiation media supplemented with 100ng/ml IL-9 (OLG IL-9), or differentiation media supplemented with 8μg/ml of clusterin and 100ng/ml IL-9 (OLG CLU+IL-9) for 72 hours (n=11 for all conditions; from 3 independent experiments). Statistics calculated using a repeated measures one-way ANOVA with a Tukey’s post-hoc analysis; Mbp F(10,40)=10.15, Plp1 F(10,40)=11.96, Myrf F(10,40)=10.32. *p<0.05, **p<0.01, ****p<0.0001, ns=not significant. All error bars represent SEM.
Figure 6
Figure 6. Deletion of clusterin improves myelination in WT and 5XFAD mice.
A, Representative electron microscopy images of myelinated axons from the corpus callosum of 9-month old WT and clusterin knockout (Clu−/−) mice. B, Quantification of the myelin g-ratio plotted against axon diameter in WT and Clu−/− mice. Lines represent linear regression of the plotted data and p-values represent comparison of slopes. C, Representative electron microscopy images of myelinated axons from the corpus callosum of 9-month old 5xFAD and 5xFAD; Clu−/− mice. B, Quantification of the myelin g-ratio plotted against axon diameter in 5xFAD and 5xFAD; Clu−/− mice. Lines represent linear regression of the plotted data and p-values represent comparison of slopes. *p<0.05, ****p<0.0001.

References

    1. Association As. 2021 Alzheimer’s disease facts and figures. Alzheimer’s Dement. 2021;17:327–406. - PubMed
    1. Roher AE, Weiss N, Kokjohn TA, Kuo Y-M, Kalback W, Anthony J, Watson D, Luehrs DC, Sue L, Walker D, et al. Increased Aβ Peptides and Reduced Cholesterol and Myelin Proteins Characterize White Matter Degeneration in Alzheimer’s Disease. Biochemistry. 2002;41:11080–90. - PubMed
    1. Pan S, Mayoral SR, Choi HS, Chan JR, Kheirbek MA. Preservation of a remote fear memory requires new myelin formation. Nat Neurosci. 2020;23:487–99. - PMC - PubMed
    1. Steadman PE, Xia F, Ahmed M, Mocle AJ, Penning ARA, Geraghty AC, Steenland HW, Monje M, Josselyn SA, Frankland PW. Disruption of Oligodendrogenesis Impairs Memory Consolidation in Adult Mice. Neuron. 2020;105:150–e164156. - PMC - PubMed
    1. Chen J-F, Liu K, Hu B, Li R-R, Xin W, Chen H, Wang F, Chen L, Li R-X, Ren S-Y, et al. Enhancing myelin renewal reverses cognitive dysfunction in a murine model of Alzheimer’s disease. Neuron. 2021;109:2292–e23072295. - PMC - PubMed

Publication types

LinkOut - more resources