[Preprint]. 2024 May 28:rs.3.rs-4427198.
doi: 10.21203/rs.3.rs-4427198/v1.

Longitudinal Network Changes and Phenoconversion Risk in Isolated REM Sleep Behavior Disorder

Affiliations

Longitudinal Network Changes and Phenoconversion Risk in Isolated REM Sleep Behavior Disorder

David Eidelberg et al. Res Sq. .

Update in

Abstract

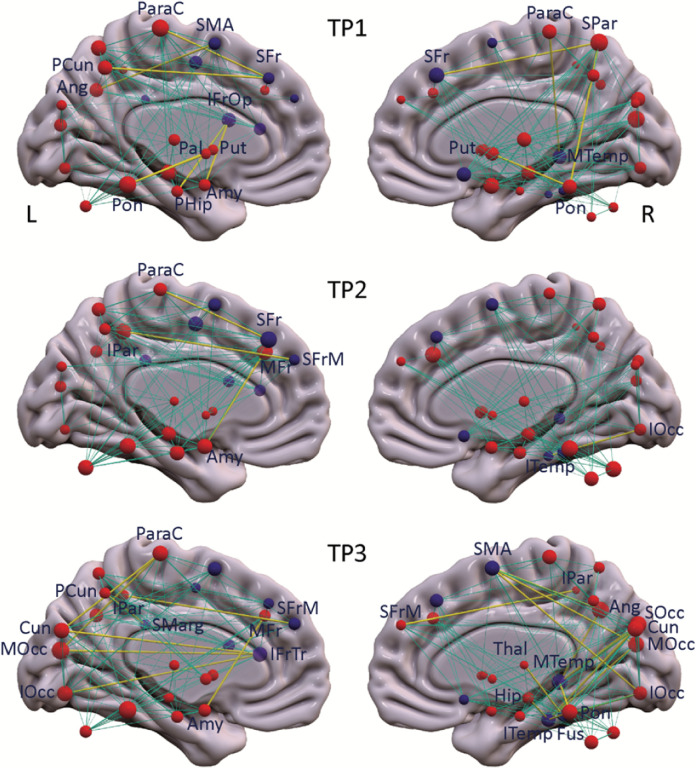
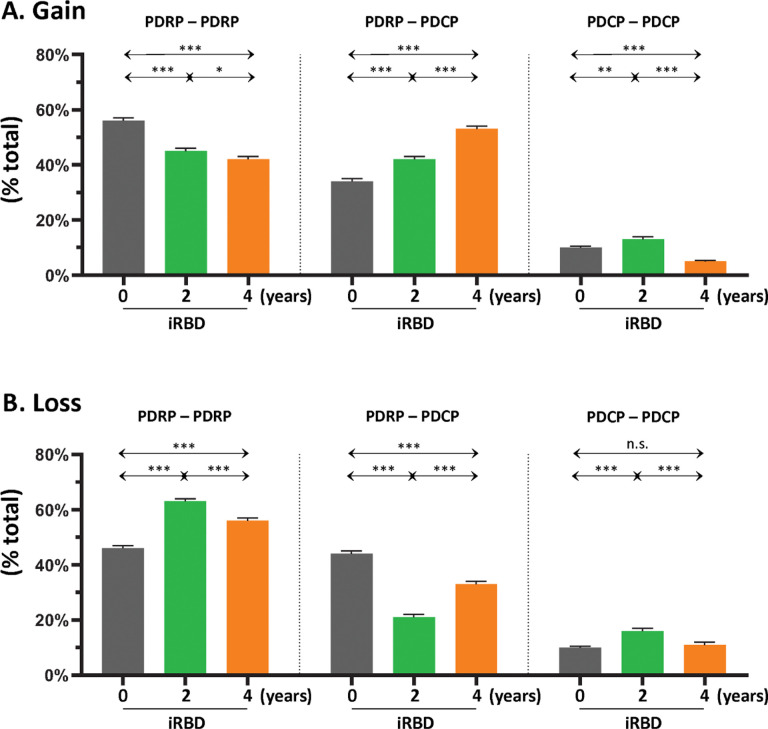
Isolated rapid eye movement sleep behavior disorder (iRBD) is a prodromal syndrome for Parkinson's disease (PD) and related α-synucleinopathies. We conducted a longitudinal imaging study of network changes in iRBD and their relationship to phenoconversion. Expression levels for the PD-related motor and cognitive networks (PDRP and PDCP) were measured at baseline, 2 and 4 years, along with dopamine transporter (DAT) binding. PDRP and PDCP expression increased over time, with higher values in the former network. While abnormal functional connections were identified initially within the PDRP, others bridging the two networks appeared later. A model based on the rates of PDRP progression and putamen dopamine loss predicted phenoconversion within 1.2 years in individuals with iRBD. In aggregate, the data suggest that maladaptive reorganization of brain networks takes place in iRBD years before phenoconversion. Network expression and DAT binding measures can be used together to assess phenoconversion risk in these individuals.


Conflict of interest statement

Additional Declarations: There is NO Competing Interest.

Figures

Figure 1
Figure 1. Longitudinal changes in metabolic network expression and dopamine transporter (DAT) binding.
(A) Expression values (mean±SE) for the PDRP (left) and PDCP (right) are displayed for the iRBD cohort at baseline, 2 years, and 4 years and compared with healthy control (HC1) values (see text). Significant increases are observed over time for both networks. [Network expression at each timepoint was z-scored with respect to corresponding HC1 values.] (B)DAT binding (mean±SE) in the putamen (left) and caudate (right) are displayed for the iRBD subjects at each timepoint and compared to healthy control (HC2) subjects (see text). Significant declines were observed over time in both regions. [DAT binding at each timepoint was expressed as the percentage of the healthy control (HC2) mean for each region. Changes over time are represented by horizontal arrows. Differences from healthy control values at each are represented by asterisks (*p<0.05, **p<0.01).]
Figure 2
Figure 2. Metabolic connections gained at each timepoint in the iRBD cohort.
PDRP and PDCP nodes (represented respectively by red and purple spheres) are displayed, with the radius of each node proportional to the degree centrality (number of connections) at each timepoint (TP). Significant connections gained at each timepoint compared to healthy subjects (Tables S1A-C) are represented by yellow lines, with thickness proportional to the strength of the connections (see Methods). Normal connections between network nodes are represented by cyan lines.
Figure 3
Figure 3. Gain and loss of functional connections within and between the PDRP and PDCP networks.
(A) Left: At baseline (gray), the majority of gained connections (see Methods) were between PDRP nodes, but the proportion (% total) of PDRP–PDRP connections declined incrementally at the 2-year (green) and 4-year (orange) timepoints. Middle: Over the same time period, stepwise increases in gained connections were observed between PDRP and PDCP nodes (PDRP–PDCP). Right: By contrast, proportionally fewer connections were gained between PDCP nodes (PDCP–PDCP), with declines in this category of connections over time. (B) The percentage of healthy connections that were lost at baseline (see Methods) was similar for PDRP–PDRP (left) and PDRP–PDCP (middle) categories. Over time, however, the proportion of lost connections increased in the former category and declined in the latter. Loss of healthy PDCP–PDCP connections over time (right) was less than for the other connection categories, with no Significant change over time.
Figure 4
Figure 4. PDRP and PDCP network metrics at each timepoint.
Relevant network metrics were plotted for (A)PDRP and (B) PDCP. For each network, degree centrality (left), small-worldness (middle), and assortativity (right) were plotted for the iRBD cohort at baseline (black), 2 years (green), and 4 years (orange); corresponding values in the healthy control (HC1) group are provided for reference (gray). [Group differences were evaluated using the general linear model across graph thresholds with Bonferroni corrections for multiple comparisons (see Methods). Post-hoc differences from HC1 are represented by asterisks (*p<0.05, **p<0.01, ***p<0.001); differences from baseline (timepoint 1) are represented by crosses (†p<0.05, ††p<0.01, †††p<0.001).]
Figure 5
Figure 5. Correlation with the time from imaging to phenoconversion.
(A) The time to phenoconversion (years) from the imaging study correlated inversely (r=−0.58, p<0.05; Pearson correlation) with PDRP expression measured at baseline in the 12 iRBD subjects from the cross-sectional cohort who subsequently phenoconverted to PD/DLB (see text). (B) Leverage plot analysis further illustrates the Significant inverse correlation of the time to phenoconversion with PDRP expression after controlling for age, sex, UPDRS motor ratings, and iRBD duration (r=−0.55, p<0.02; partial correlation). (C, D) Leverage plots show additional correlations of the time to phenoconversion with baseline UPDRS motor ratings (r=−0.41, p<0.03) and age (r=−0.58, p<0.02; partial correlations). Correlations with sex and iRBD duration were not Significant (p>0.5).
Figure 6
Figure 6. Phenoconversion risk in iRBD subjects.
PDRP expression values (y-axis) were plotted against putamen DAT binding measurements (x-axis) recorded at the final imaging timepoint for each of the longitudinal iRBD subjects. The four iRBD subjects who converted to PD (Subjects #1–3) or DLB (Subject #4) within 7 years after the final imaging timepoint are represented by black circles (see text). The remaining iRBD participants who did not phenoconvert during the observational phase of the study are represented by open circles. Shaded arrow bars indicate the hypothetical risk of phenoconversion ranging from low to high, associated with higher PDRP expression (left side vertical bar) and lower putamen DAT binding (top horizontal bar) in iRBD subjects (see text). [The “PD zone” (top left) was defined based on historical data of early-stage PD patients, for whom PDRP expression was typically greater than +1.5 and putamen DAT binding was below 40% of normal mean (solid black lines) (see text).]

References

    1. Berg D. et al. MDS research criteria for prodromal Parkinson’s disease. Mov. Disord. 30, 1600–1611 (2015). - PubMed
    1. Fernández-Arcos A., Iranzo A., Serradell M., Gaig C. & Santamaria J. The clinical phenotype of idiopathic rapid eye movement sleep behavior disorder at presentation: A study in 203 consecutive patients. Sleep 39, 121–132 (2016). - PMC - PubMed
    1. Galbiati A., Verga L., Giora E., Zucconi M. & Ferini-Strambi L. The risk of neurodegeneration in REM sleep behavior disorder: A systematic review and meta-analysis of longitudinal studies. Sleep Med. Rev. 43, 37–46 (2019). - PubMed
    1. Postuma R. B. et al. Risk and predictors of dementia and parkinsonism in idiopathic REM sleep behaviour disorder: A multicentre study. Brain 142, 744–759 (2019). - PMC - PubMed
    1. Schindlbeck K. A. & Eidelberg D. Network imaging biomarkers: insights and clinical applications in Parkinson’s disease. Lancet Neurol. 17, 629–640 (2018). - PubMed

Publication types

LinkOut - more resources