[Preprint]. 2024 May 29:2024.05.26.595818.
doi: 10.1101/2024.05.26.595818.

Ancient eukaryotic protein interactions illuminate modern genetic traits and disorders

Affiliations

Ancient eukaryotic protein interactions illuminate modern genetic traits and disorders

Rachael M Cox et al. bioRxiv. .

Abstract

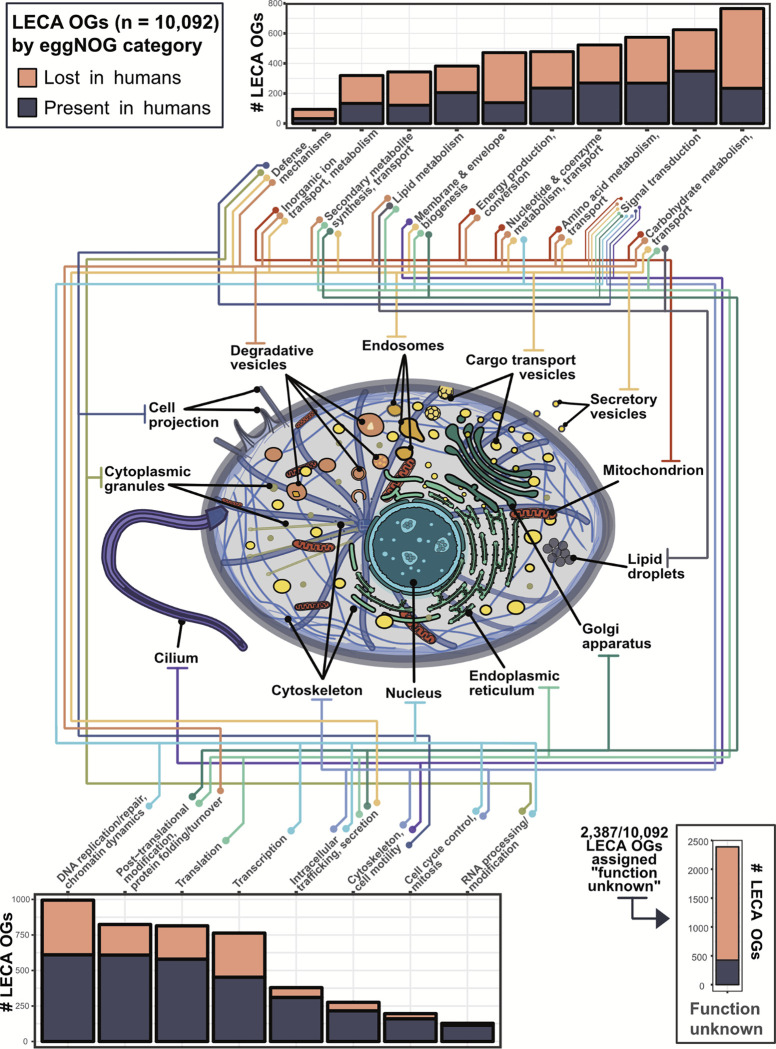
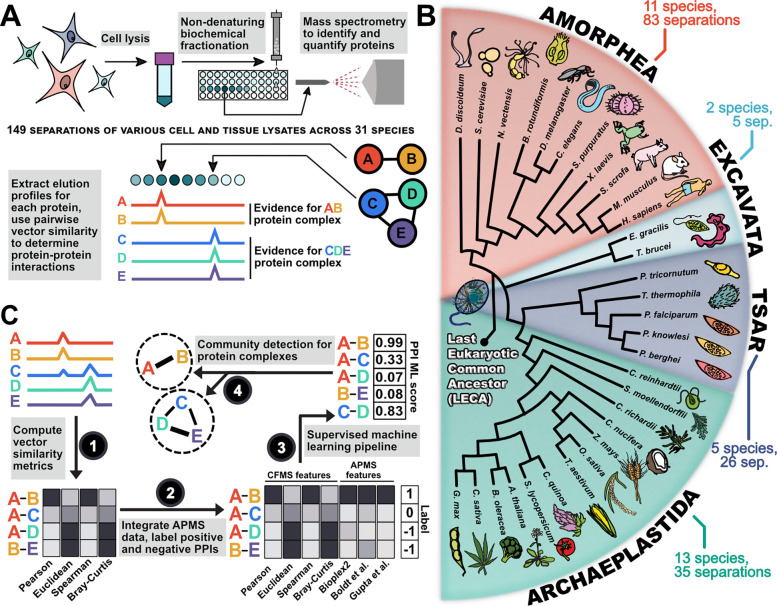
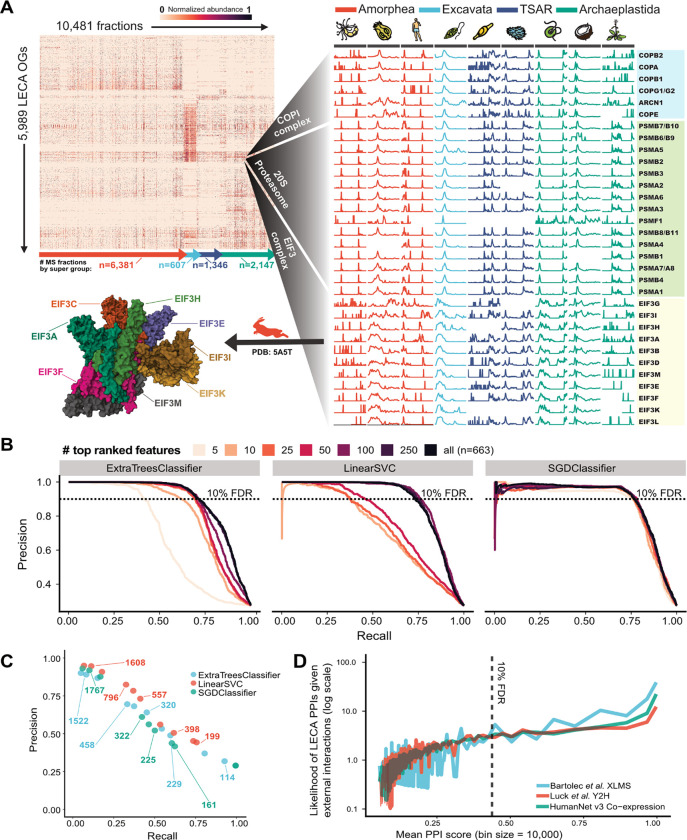
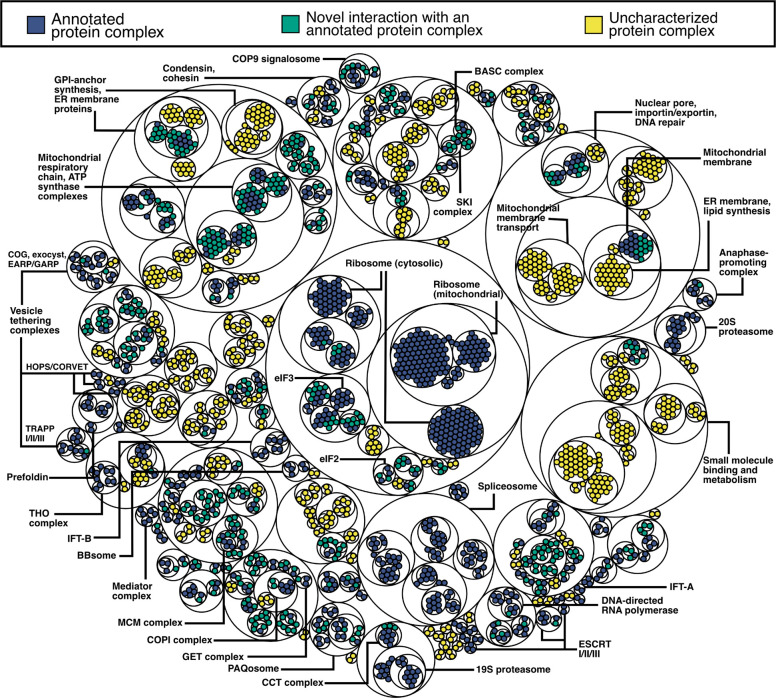
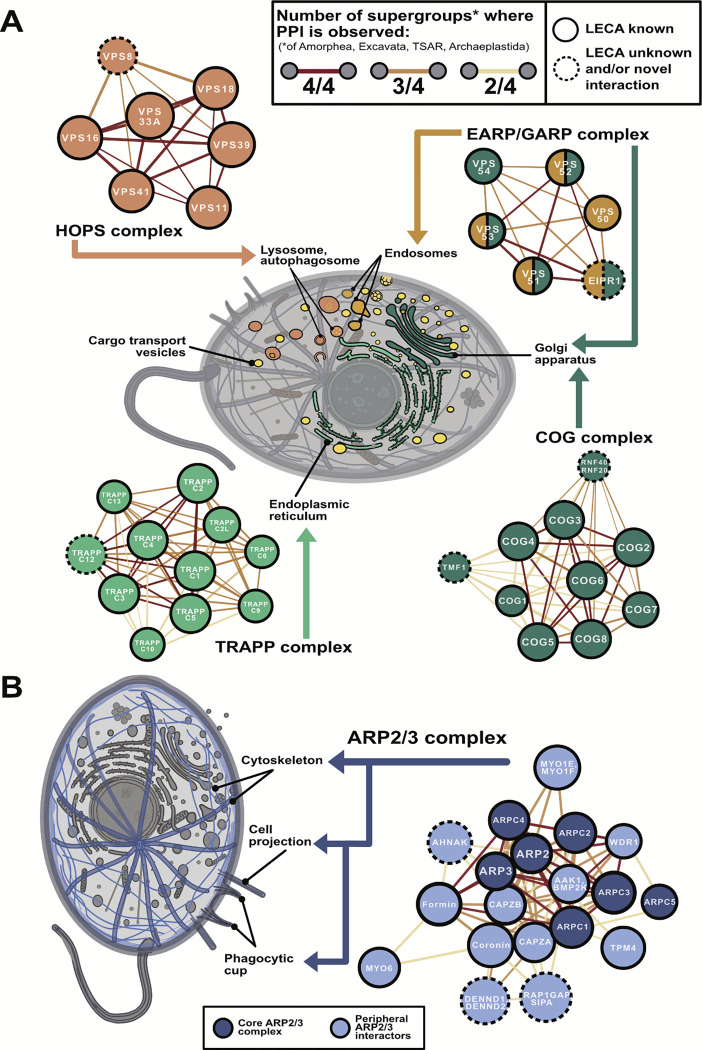
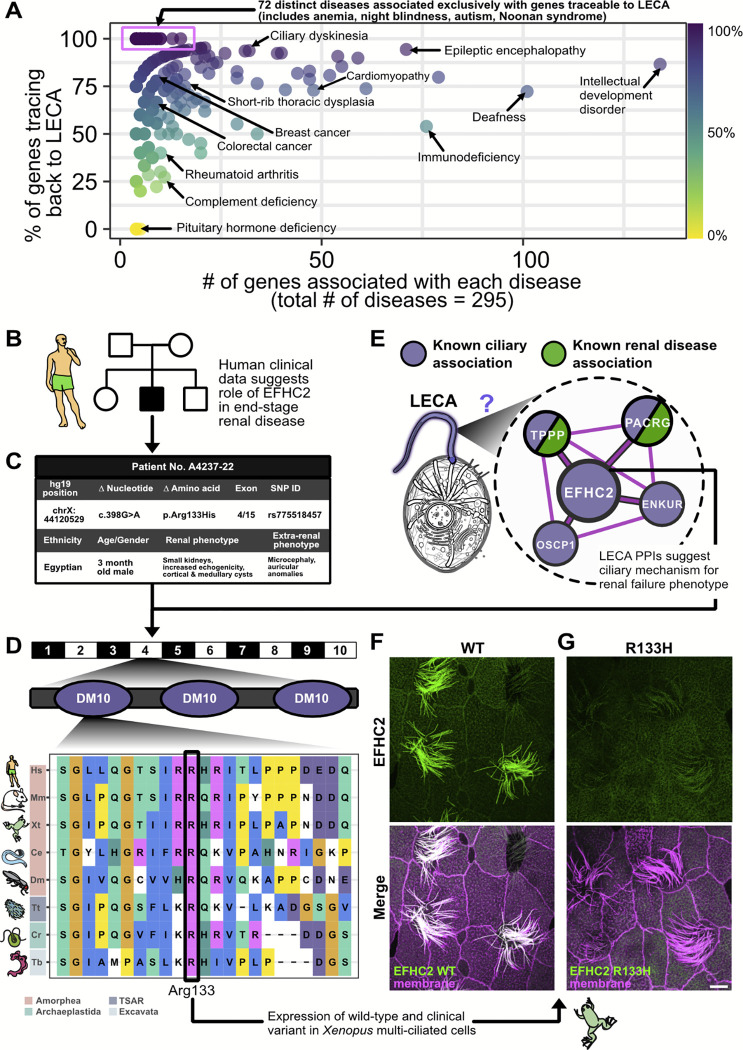
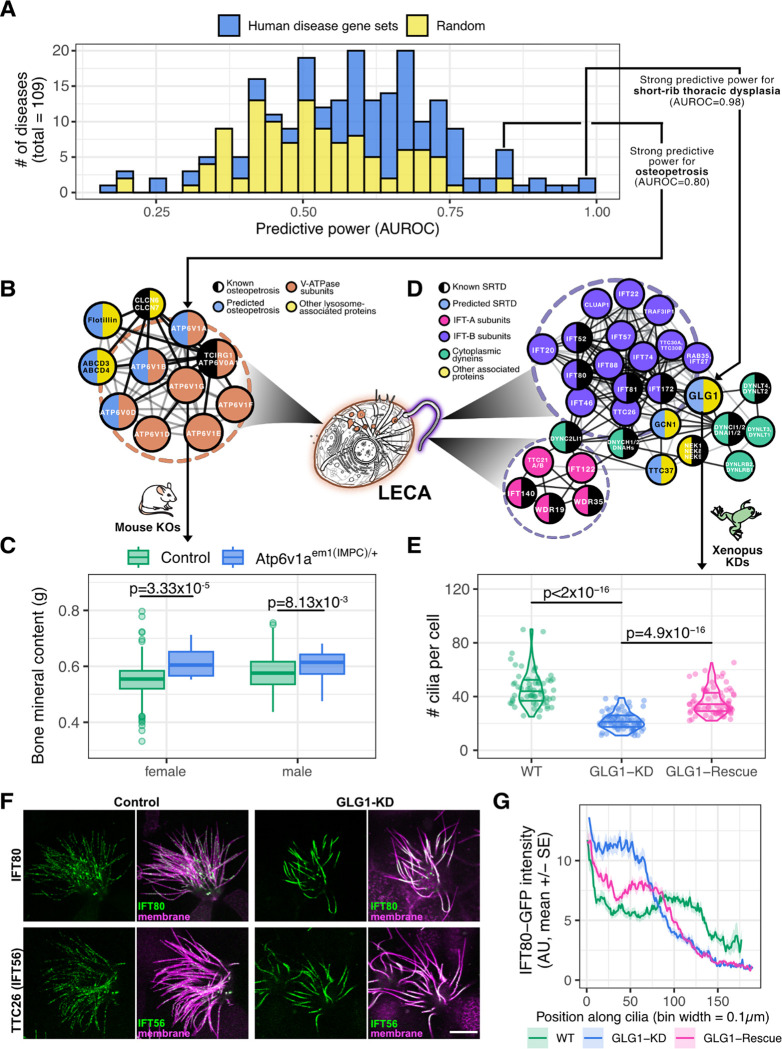
All eukaryotes share a common ancestor from roughly 1.5 - 1.8 billion years ago, a single-celled, swimming microbe known as LECA, the Last Eukaryotic Common Ancestor. Nearly half of the genes in modern eukaryotes were present in LECA, and many current genetic diseases and traits stem from these ancient molecular systems. To better understand these systems, we compared genes across modern organisms and identified a core set of 10,092 shared protein-coding gene families likely present in LECA, a quarter of which are uncharacterized. We then integrated >26,000 mass spectrometry proteomics analyses from 31 species to infer how these proteins interact in higher-order complexes. The resulting interactome describes the biochemical organization of LECA, revealing both known and new assemblies. We analyzed these ancient protein interactions to find new human gene-disease relationships for bone density and congenital birth defects, demonstrating the value of ancestral protein interactions for guiding functional genetics today.


Figures

Figure 1.
Figure 1.. Inferred subcellular organization in LECA, the last eukaryotic common ancestor, based on its estimated gene content.
Cell illustration adapted from multiple graphics sourced from SwissBioPics [41].
Figure 2.
Figure 2.. Overview of experimental and computational methods.
(A) Schematic representation of a co-fractionation mass spectrometry experiment. (B) Proteomics data used to construct the LECA interactome included eukaryotes spanning ~1.8 billion years of evolution. Tree structure is based on [26]. Branch lengths are not drawn to scale. (C) Schematic overview of the approach for computing protein-protein interaction (PPI) features based on CFMS (1) and APMS (2) datasets, scoring conserved PPIs based on these features (3), and clustering scored PPIs into complexes (4).
Figure 3.
Figure 3.. Determining the LECA protein interactome.
Co-elution matrix and results of the protein interaction machine learning pipeline. (A) Heat map of the filtered elution matrix for 5,989 strongly observed LECA OGs across 10,481 CFMS mass spectrometry fractions (left) and a blow-up of elution vectors for the COPI, 20S proteasome, and eukaryotic initiation factor 3 complexes for a select subset of species (right). (B) Precision-recall performance of three classifiers trained with increasingly larger sets of ranked features. (C) Precision-recall curves for the reconstruction of known protein complexes defined by a walktrap algorithm, where pairwise PPI scores from each classifier are used as input. Points are labeled with the total number of protein clusters (complexes) constructed at each point in the hierarchy. (D) The likelihood that PPIs in our network are present in externally defined protein-protein or mRNA coexpression networks as a function of our model’s PPI score. As PPI scores increase, our model becomes increasingly likely to agree with external studies.
Figure 4.
Figure 4.. Visualizing hierarchical clustering of protein complexes for a subset of the conserved eukaryotic interactome.
The circles of the smallest diameter correspond to individual proteins, where their colors correspond to whether the proteins within each cluster are characterized to interact with each other in the literature (red), whether a novel protein is interacting with a known complex (blue), or whether all the associations within a cluster are uncharacterized (yellow).
Figure 5.
Figure 5.. Notable LECA systems related to vesicle tethering and cell projection.
(A) Node colors for each vesicle tethering complex correspond to their primary subcellular localization: endoplasmic reticulum (light green), Golgi apparatus (dark green), digestive vesicles (orange), or endosomes (yellow). (B) Dark and light blue nodes depict core and peripheral cell projection components. In both (A) and (B), edges between proteins are colored by the number of eukaryotic supergroups in which the interaction is observed: red for interactions observed in all supergroups considered, orange for interactions observed in three of the four eukaryotic supergroups, and yellow for interactions only observed in half of the supergroups. The four supergroups considered are Amorphea, Excavata, TSAR and Archaeplastida (see Figure 2).
Figure 6.
Figure 6.. LECA protein interactions suggest mechanisms of genetic disease, as for end stage renal disease gene EFHC2, identified by whole exome sequencing and confirmed to have a ciliary etiology.
(A) Causal genes for human diseases are frequently ancient, as shown by plotting gene-disease relationships obtained from OMIM, with each point representing a unique disease group with an associated number of genes (x-axis) and age, determined as the percentage of genes in LECA OGs (y-axis). (B) Pedigree of the index family A4237. Squares represent males, circles females, black shading the affected proband individual A4237–22 included in whole-exome sequencing (WES), and white shading the unaffected parents and siblings. (C) Summary of the phenotype and recessive disease-causing R133H EFHC2 variant identified by WES. (D) Location of Arginine 133 in relation to EFHC2 exon/intron (black/white) structure and DM10 protein domains (purple), and its deep evolutionary conservation. (E) EFHC2-containing ciliary complex uncovered in the LECA interactome. (F) Localization of GFP-EFHC2 to axonemes in Xenopus motile cilia. (G) Introduction of the R133H mutation results in loss of ciliary localization of GFP-EFHC2, confirmed by co-labeling with membrane-RFP. Scale bar = 10 μm
Figure 7.
Figure 7.. Guilt-by-association in the LECA interactome identifies ATP6V1A as causative for osteopetrosis and GLG1 for short-rib thoracic dysplasia (SRTD).
(A) Guilt-by-association in the LECA PPI network correctly associates genes to human diseases for roughly a third of the 109 diseases tested, measured as the areas under receiver operating characteristic curves (AUROCs) of leave-one-out cross-validated predictions of known disease genes (light blue) versus random associations (yellow). (B) PPI network of genes clinically linked to osteopetrosis (black half-discs; 3 additional genes lie outside this cluster), the highest-ranking new candidates (purple), and their interactions with other V-ATPase subunits that were not indicated for osteopetrosis (orange). (C) For the top-scoring gene ATP6V1A, the bone mineral content is plotted for knockout (KO) mice with a heterozygous exon deletion in ATP6V1A (n=8 for each sex, n=16 total) compared to healthy control mice (female n=834, male n=780). Null mice show significantly increased bone density, consistent with the clinical manifestation of osteopetrosis. (D) The PPI network of genes clinically linked to SRTD (black half-discs) implicates GLG1 (yellow) and suggests a ciliary role, based on interactions with intraflagellar trafficking IFT-A (blue) and IFT-B (purple) complexes, cytoplasmic dyneins and dynactins (green), and other interactors (gray). (E) Morpholino knockdown (KD) of GLG1 significantly reduced the number of cilia in X. laevis multi-ciliated cells (Bonferroni adjusted t-test p < 10−16, n = 60 control cells, 79 knockdown cells, and 76 rescue cells, 9 embryos per condition over 3 injection replicates) compared to uninjected control animals; rescue by co-injection with a non-targeted GLG1 allele confirmed specificity. (F) In control Xenopus multi-ciliated cells, IFT56-GFP and IFT80-GFP, two subunits of IFT-B, are distributed as particles along the ciliary axonemes. However, MO knockdown of GLG1 leads to the accumulation of IFT-B proteins in the proximal region of axonemes. Scale bar = 10 μm. (G) This effect is quantified for IFT80-GFP for 3 cilia per cell for all cells analyzed in panel (E).

Similar articles

References

    1. Betts HC, Puttick MN, Clark JW, Williams TA, Donoghue PCJ, Pisani D. Integrated genomic and fossil evidence illuminates life’s early evolution and eukaryote origin. Nat Ecol Evol 2018;2:1556–62. 10.1038/s41559-018-0644-x. - DOI - PMC - PubMed
    1. Brocks JJ, Nettersheim BJ, Adam P, Schaeffer P, Jarrett AJM, Güneli N, et al. Lost world of complex life and the late rise of the eukaryotic crown. Nature 2023;618:767–73. 10.1038/s41586-023-06170-w. - DOI - PubMed
    1. Skejo J, Garg SG, Gould SB, Hendriksen M, Tria FDK, Bremer N, et al. Evidence for a Syncytial Origin of Eukaryotes from Ancestral State Reconstruction. Genome Biol Evol 2021;13:evab096. 10.1093/gbe/evab096. - DOI - PMC - PubMed
    1. Bremer N, Tria FDK, Skejo J, Martin WF. The Ancestral Mitotic State: Closed Orthomitosis With Intranuclear Spindles in the Syncytial Last Eukaryotic Common Ancestor. Genome Biol Evol 2023;15:evad016. 10.1093/gbe/evad016. - DOI - PMC - PubMed
    1. Tromer EC, van Hooff JJE, Kops GJPL, Snel B. Mosaic origin of the eukaryotic kinetochore. Proc Natl Acad Sci 2019;116:12873–82. 10.1073/pnas.1821945116. - DOI - PMC - PubMed

Publication types