[Preprint]. 2025 Jan 7:rs.3.rs-4390765.
doi: 10.21203/rs.3.rs-4390765/v4.

The context-dependent epigenetic and organogenesis programs determine 3D vs. 2D cellular fitness of MYC-driven murine liver cancer cells

Affiliations

The context-dependent epigenetic and organogenesis programs determine 3D vs. 2D cellular fitness of MYC-driven murine liver cancer cells

Jun Yang et al. Res Sq. .

Update in

Abstract

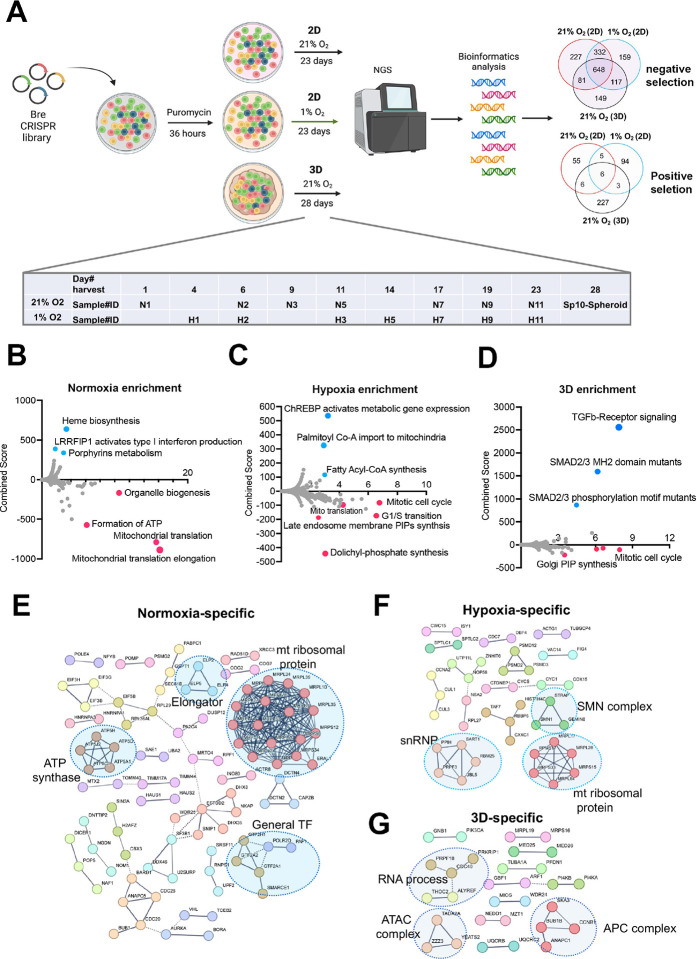
3D cellular-specific epigenetic and transcriptomic reprogramming is critical to organogenesis and tumorigenesis. Here we dissect the distinct cell fitness in 2D (normoxia vs. chronic hypoxia) vs 3D (normoxia) culture conditions for a MYC-driven murine liver cancer model. We identify over 600 shared essential genes and additional context-specific fitness genes and pathways. Knockout of the VHL-HIF1 pathway results in incompatible fitness defects under normoxia vs. 1% oxygen or 3D culture conditions. Moreover, deletion of each of the mitochondrial respiratory electron transport chain complex has distinct fitness outcomes. Notably, multicellular organogenesis signaling pathways including TGFb-SMAD, which is upregulated in 3D culture, specifically constrict the uncontrolled cell proliferation in 3D while inactivation of epigenetic modifiers (Bcor, Kmt2d, METTL3 and METTL14) has opposite outcomes in 2D vs. 3D. We further identify a 3D-dependent synthetic lethality with partial loss of Prmt5 due to a reduction of Mtap expression resulting from 3D-specific epigenetic reprogramming. Our study highlights unique epigenetic, metabolic and organogenesis signaling dependencies under different cellular settings.


Figures

Figure 1.
Figure 1.. Transcriptomic and epigenetic reprogramming in hypoxic 2D and normoxic 3D conditions.
(A) The ABC-Myc driven hepatoblastoma organoids serve as a good model for genome wide fitness screening. The ABC-Myc lineage was validated through expression of TdTomato. (B) RNA- sequencing data from cells cultured in our conditions of interest are represented in Venn Diagrams of genes in 3D vs 2D normoxia and 2D-Hypoxia vs 2D-Normoxia (n =3 per group). The leftmost Venn diagram represents a total count of all genes identified, followed by the Up and down labeled diagrams reporting the upregulated and downregulated genes, respectively. The numbers in the Venn diagrams represent the number of significant genes expressed in the respective conditions. (C) The volcano plots, generated using Enrichr, show significant REACTOME pathways shared by cells in normoxic 3D and hypoxic 2D (left), specific to hypoxic 2D (middle) and normoxic 3D conditions (right) (n = 3 per group). The X- axis represents the signi cance of expression change for a gene in –log10 (adjusted P- value). The Y- axis represents the combined score for enrichment of a given pathway with positive values indicating enrichment and negative values indicating a decrease in the pathway. (D) ATAC-seq analysis for cells under normoxic 2D, hypoxic 2D and normoxic 3D conditions (n=2 per group). The left cartoon indicates the changes of ATAC-seq signals under different culture conditions and predicted transcription factor binding motif. Right Venn diagram showing the common and unique ATAC-seq signals (numbers and percentages) under three conditions. (E) Protein-protein interaction network (STRING confidence threshold = 0.7) formed by transcription factors that are predicted to be highly active under normoxic 2D, hypoxic 2D and normoxic 3D, respectively. (F) SMAD4 motif densities around ATAC-seq open chromatin regions (±1000 bp) by categories. Motif density was determined by HOMER (Hypergeometric Optimization of Motif EnRichment) program and normalized to that in a background sequence of equal length. X-axis indicates the distance to peak center (bp). (G) IGV snapshot shows the ATAC-seq signals and RNA-seq reads under normoxic 2D, hypoxic 2D and normoxic 3D conditions. The “CTGTCTCA” SMAD4 binding motif lies within the ATAC-seq peak specifically appears in normoxic 3D conditions.
Figure 2.
Figure 2.. Identification of cell fitness genes in 2D hypoxia, 2D normoxia, and 3D normoxia.
(A) Scheme showing the procedure of genome- wide CRISPR screen of the ABC-Myc NEJF10 cell line treated with different growth environments. Venn analysis of essential genes (negative selection) and anti-proliferative genes (positive selection) reveals gene essentiality for cellular fitness identified in 2D normoxia, 2D hypoxia, and 3D Normoxia. The table is a report of when samples were harvested with N representing 2D normoxia, H representing 2D hypoxia, and Sp10- Spheroid representing 3D normoxia grown cells. (B, C, D) Pathway enrichment analysis reported as an enrichment score with negative values indicating negative selection, positive values indicating positive selection, and values of zero indicating no relationship of the respective condition. The colored points highlight significant upregulation (blue) or down regulation (red), whereas grey colored points were not significantly enriched. (E, F, G) Pathways within a protein-protein interaction network of genes essential in cellular fitness are selectively enriched in normoxic, hypoxic, and 3D specific environments. Related genes are clustered by color with some circled to indicate functional complexes.
Figure 3.
Figure 3.. Fitness incompatibility of VHL-HIF2a pathway in normoxia vs hypoxia or 3D.
(A) Scheme representing the VHL-HIF pathway. The HIF-1 and HIF-2a family of transcription factors are degraded by VHL, an E3 ubiquitin ligase, in normoxia. In the presence of hypoxia or loss function of VHL, HIFa is present and dimerizes with nuclear HIF1b or ARNT to drive gene transcription. (B-E) The gRNA reads for Vhl(B), Hif-1a (C), Hif-2a or Epas1 (D), Hif-1b or Arnt(E) at different time points in 2D normoxia and 2D hypoxia. Data = mean+/−SD (n =4 for each time point) (F) The gRNA reads for VHL, Hif-1a, Hif-2a or Epas1, Hif-1b or Arnt at the beginning and end time points in 3D normoxia. (G) CRISPR KO effect of VHL, HIF-1A, HIF-2A (EPAS1), HIF-1B (ARNT) in 1078 human cell lines. Data were extracted from DepMAP database (www.depmap.org). (H) Spearman correlation of VHL CRISPR KO effect vs HIF-1Agene expression in 1078 human cell lines. (I) Western blot analysis of VHL CRISPR knockout in HepG2 cells using two gRNAs with indicated antibodies. (J) Cell growth of wild-type and VHL KO HepG2 over time monitored by Incucyte live cell microscopy in real-time in 2D normoxic condition. ****P<0.0001. p value is calculated by student t test for the last time point data. Data = mean+/−SD. (K) Cell growth of wild-type and VHL KO HepG2 over time monitored by Incucyte in real-time in 3D normoxic condition. Data = mean+/−SD.
Figure 4.
Figure 4.. The effect of mitochondrial compartments on cell tness.
(A) Heatmap showing the gRNA reads for mitochondrial ribosomal genes at different time points in 2D normoxia, 2D hypoxia and 3D normoxia. Scale bar indicates Z score. (B) Comparison of gRNA reads for mitochondrial ribosomal genes at different time points in 2D normoxia, 2D hypoxia and 3D normoxia. ****P<0.0001. p value is calculated by student t test for the last time point data. Data = mean+/−SD. (C) Spearman correlation of MRPS22 CRISPR KO effect vs HIF-1Agene expression in 1078 human cell lines. (D) Heatmap showing the gRNA reads for mitochondrial electron transport genes at different time points in 2D normoxia, 2D hypoxia and 3D normoxia. Scale bar indicates Z socre. (E) The gRNA reads for Atp5c1 at different time points in 2D normoxia and 2D hypoxia. Data = mean+/− SD (F) CRIPSR KO effect of ATP5C1 in 1078 human cell lines. Data were extracted from DepMAP database (www.depmap.org). (G) Spearman correlation of ATP5C1 CRISPR KO effect vs HIF-1Agene expression in 1078 human cell lines.
Figure 5.
Figure 5.. Organogenesis signaling and epigenetic modifiers constrain 3D cell proliferation
(A-C) Positive selection of pathways within protein-protein interaction networks enriched specifically in 2D normoxia, 2D hypoxia, and 3D normoxia. (D) The graphic illustrates organogenesis signaling pathways positively selected in 3D. Please note that we included hits from normoxia (Sox9, Ep300) and hypoxia (Maml1 and Gsk-3b) in the related pathways. (E) The heatmap for the normalized gRNA reads for epigenetic genes in 2D hypoxia and normoxia and 3D normoxia. Red color indicates positive selection. Scale bar indicates Z score. (F) The heatmap for the normalized gRNA reads for WMM complex of NEJF6 cells in 2D hypoxia and normoxia and 3D normoxia. Scale bar indicates Z score. (G) Spearman correlation of METTL3 CRISPR KO effect vs TP53 mutations in human cancer cells lines by analyzing DepMAP data (www.depmap.org).
Figure 6.
Figure 6.. Selective fitness of lipid metabolisms.
(A) Venn diagram showing 13 and 20 genes with negative dependency in specifically hypoxia and 3D induced conditions, respectively, are selectively induced in hypoxia or 3D. (B) Venn diagram showing 14 and 20 genes with positive dependency in specifically hypoxia and 3D induced conditions, respectively, are selectively induced in hypoxia or 3D. (C) A diagram showing lipid biosynthesis pathway of unsaturated fatty acids and cholesterol. (D) The heatmap showing the gene expression involved in lipid biosynthesis. Scale bar indicates Z score. (E) The heatmap showing the normalized gRNA reads for genes involved in lipid biosynthesis in 2D normoxia and hypoxia, 3D normoxia. Scale bar indicates Z score.
Figure 7.
Figure 7.. Synthetic lethality of partial Prtm5 loss with 3D.
(A) The heatmap showing the normalized gRNA reads for Prtm5 in 2D normoxia and hypoxia, 3D normoxia. Arrows indicate the first samples harvested for analysis. (B) Western blot analysis with indicated antibodies after Prtm5 knockdown in NEJF10 cells. (C) Colony formation of NEJF10 cells after 5 days of Prmt5 knockdown in 2D normoxia and hypoxia. Cells were stained with crystal violet. (D) Incucyte monitoring of cell proliferation grown in 3D after Prtm5 knockdown in NEJF10 cells. ***p<0.001 for comparison of shCtrl with each of shPrmt5. p value is calculated by student t test by comparing the last reading. N =3 per group. Data = mean+/− SD. (E) Snapshot of NEJF10 cell with or without Prmt5 knockdown in 3D. (F) Kaplan-Meier survival for mice of ABC-Myc::Prmt5+/+, ABC-Myc::Prmt5+/−, and ABC-Myc::Prmt5−/−. P values are calculated by log-rank test. (G) Hematoxylin and eosin stain for tumor tissues obtained from mice of Prtm5−/−, ABC-Myc::Prmt5+/+, ABC-Myc::Prmt5+/−, and ABC-Myc::Prmt5−/−. Arrows indicate necrosis in tumor areas. Scale bar = 500mM. (H) Quantification of normalized Mtap mRNA under 2D normoxia, 2D hypoxia and 3D normoxia from RNA-seq results. n=2 for each group. (I) Real-time quantitative PCR to determine the expression of Mtap in NEJF10 cells cultured under 3D normoxia, 2D normoxia and hypoxia for 3 days. Blue and orange indicate results obtained from two different pairs of PCR primers against Mtap. n=3 for each group.****p<0.0001 student t test. (J) Western blot analysis with indicated antibodies of NEJF10 whole cell lysates cultured from 3D normoxia, 2D normoxia and hypoxia for 3 days. (K) IGV snapshot showing the ATAC-seq result for Mtap gene. The black arrow indicates the enhancers in Mtap gene are selectively lost in 3D.

Similar articles

References

    1. Kaelin WG Jr. (2005) The concept of synthetic lethality in the context of anticancer therapy. Nat Rev Cancer 5:689–698. 10.1038/nrc1691 - DOI - PubMed
    1. Tsherniak A, Vazquez F, Montgomery PG, Weir BA, Kryukov G, Cowley GS, Gill S, Harrington WF, Pantel S, Krill-Burger JM et al. (2017) Defining a Cancer Dependency Map. Cell 170:564–576e516. 10.1016/j.cell.2017.06.010 - DOI - PMC - PubMed
    1. McDonald ER 3rd, de Weck A, Schlabach MR, Billy E, Mavrakis KJ, Hoffman GR, Belur D, Castelletti D, Frias E, Gampa K et al. (2017) Project DRIVE: A Compendium of Cancer Dependencies and Synthetic Lethal Relationships Uncovered by Large-Scale. Deep RNAi Screen Cell 170:577–592e510. 10.1016/j.cell.2017.07.005 - DOI - PubMed
    1. Dharia NV, Kugener G, Guenther LM, Malone CF, Durbin AD, Hong AL, Howard TP, Bandopadhayay P, Wechsler CS, Fung I et al. (2021) A first-generation pediatric cancer dependency map. Nat Genet 53:529–538. 10.1038/s41588-021-00819-w - DOI - PMC - PubMed
    1. Sun CX, Daniel P, Bradshaw G, Shi H, Loi M, Chew N, Parackal S, Tsui V, Liang Y, Koptyra M et al. (2023) Generation and multi-dimensional profiling of a childhood cancer cell line atlas defines new therapeutic opportunities. Cancer Cell 41:660–677e667. 10.1016/j.ccell.2023.03.007. - DOI - PubMed

Publication types