[Preprint]. 2024 May 30:rs.3.rs-4414468.
doi: 10.21203/rs.3.rs-4414468/v1.

Single-nucleus multi-omic profiling of polyploid heart nuclei identifies fusion-derived cardiomyocytes in the human heart

Affiliations

Single-nucleus multi-omic profiling of polyploid heart nuclei identifies fusion-derived cardiomyocytes in the human heart

Sangita Choudhury et al. Res Sq. .

Abstract

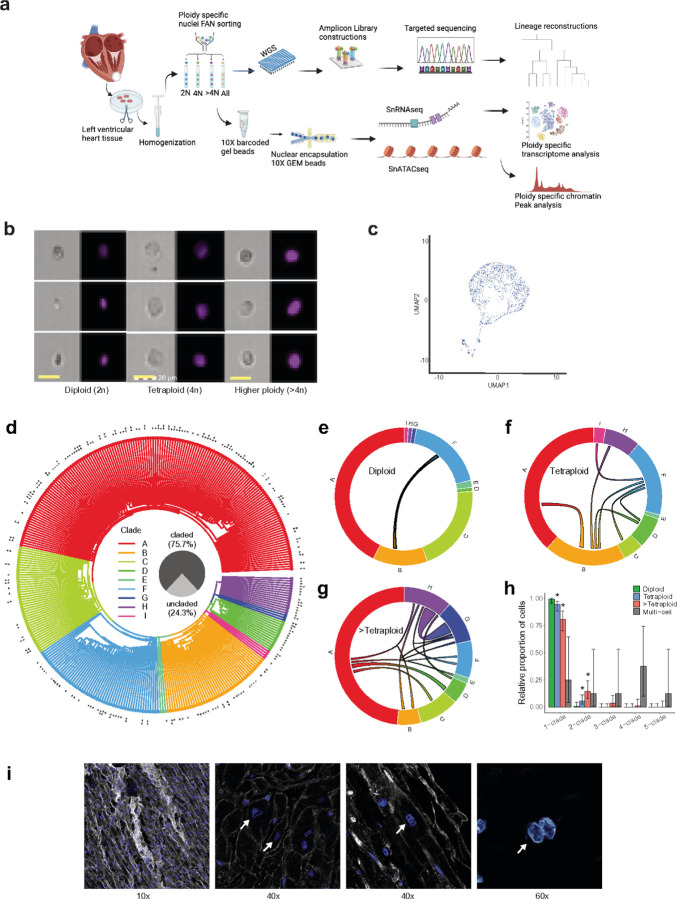
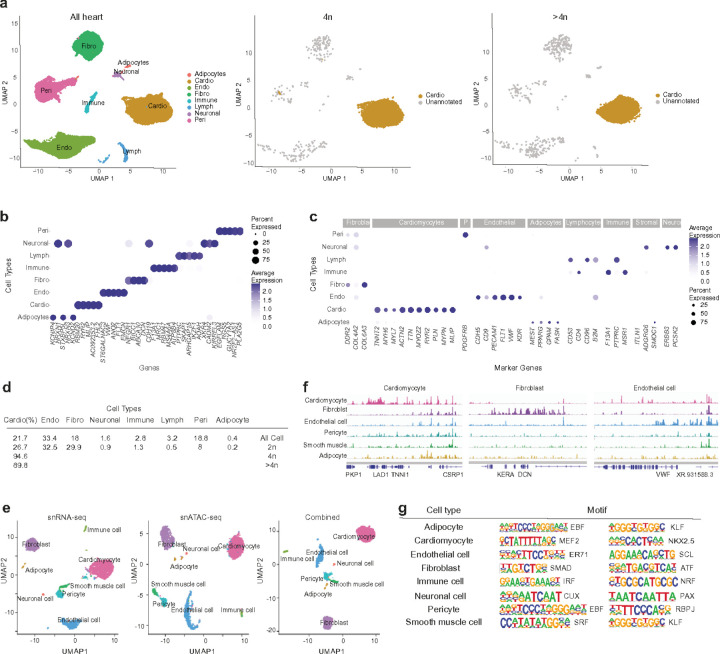
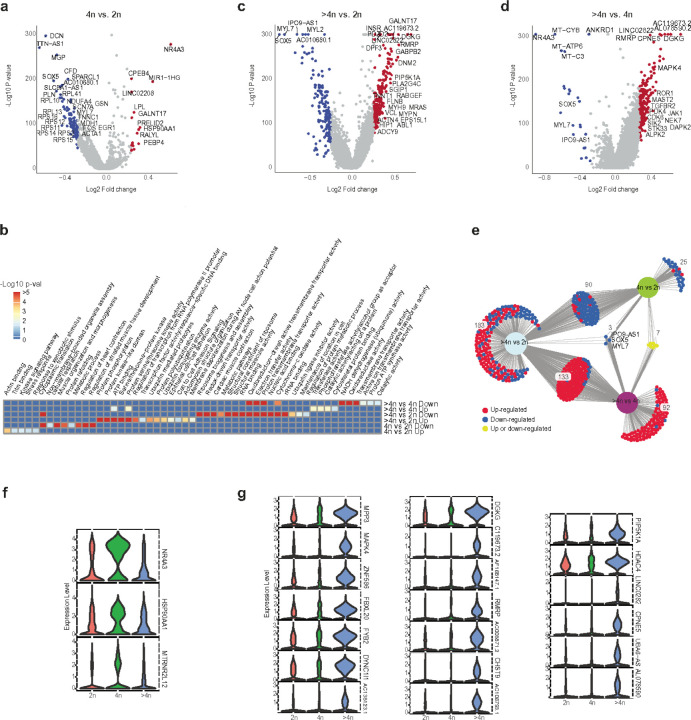
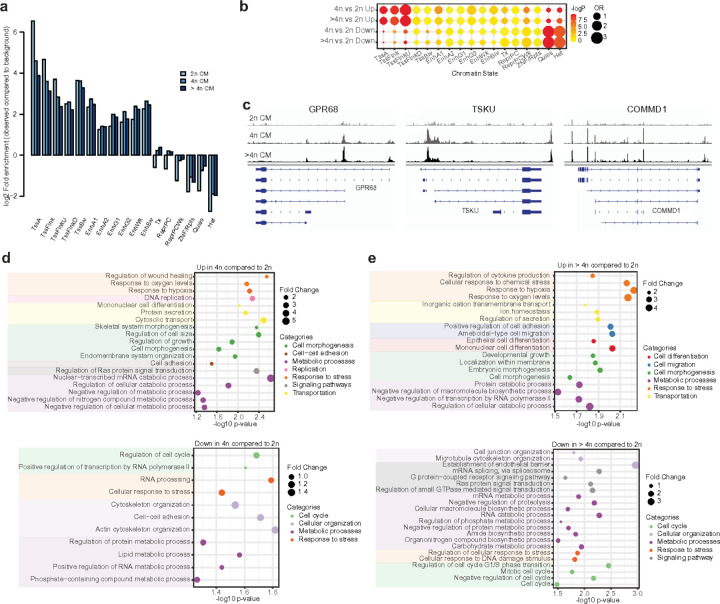
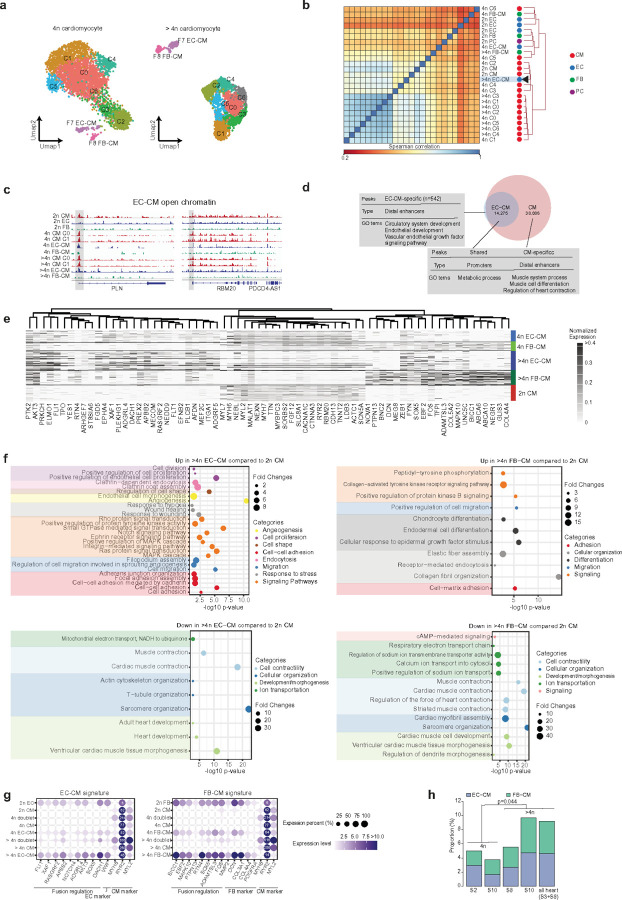
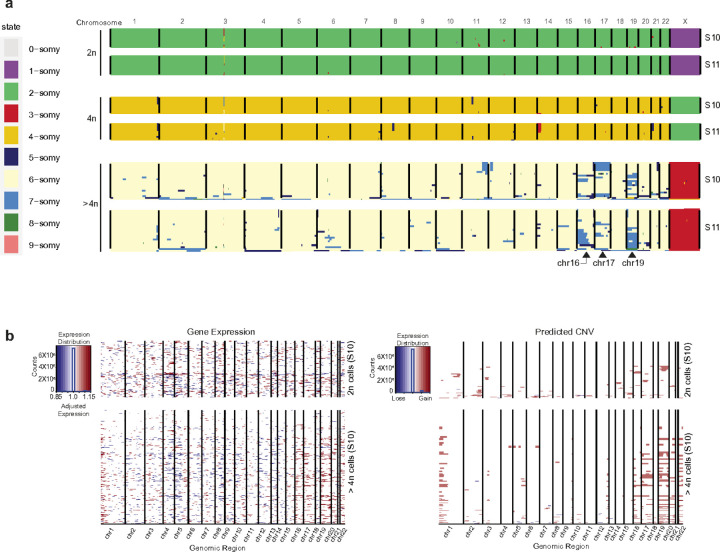
Understanding the mechanisms of polyploidization in cardiomyocytes is crucial for advancing strategies to stimulate myocardial regeneration. Although endoreplication has long been considered the primary source of polyploid human cardiomyocytes, recent animal work suggests the potential for cardiomyocyte fusion. Moreover, the effects of polyploidization on the genomic-transcriptomic repertoire of human cardiomyocytes have not been studied previously. We applied single-nuclei whole genome sequencing, single nuclei RNA sequencing, and multiome ATAC + gene expression (from the same nuclei) techniques to nuclei isolated from 11 healthy hearts. Utilizing post-zygotic non-inherited somatic mutations occurring during development as "endogenous barcodes," to reconstruct lineage relationships of polyploid cardiomyocytes. Of 482 cardiomyocytes from multiple healthy donor hearts 75.7% can be sorted into several developmental clades marked by one or more somatic single-nucleotide variants (SNVs). At least ~10% of tetraploid cardiomyocytes contain cells from distinct clades, indicating fusion of lineally distinct cells, whereas 60% of higher-ploidy cardiomyocytes contain fused cells from distinct clades. Combined snRNA-seq and snATAC-seq revealed transcriptome and chromatin landscapes of polyploid cardiomyocytes distinct from diploid cardiomyocytes, and show some higher-ploidy cardiomyocytes with transcriptional signatures suggesting fusion between cardiomyocytes and endothelial and fibroblast cells. These observations provide the first evidence for cell and nuclear fusion of human cardiomyocytes, raising the possibility that cell fusion may contribute to developing or maintaining polyploid cardiomyocytes in the human heart.

Keywords: Cardiomyocytes; Cell fusion; Copy number variation; Heart; Polyploid cardiomyocyte transcriptome and chromatin landscapes; Polyploidization; Somatic single nucleotide variants.


Conflict of interest statement

Competing interest declaration: The authors declare that they have no competing interests.

Figures

Figure 1
Figure 1. Lineage reconstruction of human cardiomyocytes via single-cell sequencing based on ploidy.
(a) Schematic of approach. Nuclei are isolated from frozen postmortem heart tissues and sorted based on ploidy content by FANS. Sorted nuclei are amplified by Φ29 polymerase-mediated MDA for targeted sequencing for cell lineage analysis. (b) Representative photomicrographs from FlowSight Imaging Flow of isolated cardiomyocyte nuclei confirming DNA content of a single tetraploid and multiploid cardiomyocyte nuclei. Scale bar 20μm. (c) Purity of sorted diploid cardiomyocyte nuclei based on single nuclei RNAseq. (d) Lineage map of 340 single-clade human cardiomyocytes based on panel sequencing of 253 clonal sSNVs. Cardiomyocytes are placed into nine distinct clades defined by one or more clade-specific sSNVs. Tetraploid nuclei and >tetraploid (higher than tetraploid) nuclei are labeled by + and ++, respectively. (e-h) Cardiomyocytes generated by fusion between cells from multiple clades. The connecting arch between clades indicates nuclei containing sSNVs from more than one clade, and the thickness of arch indicates the number of nuclei. All but one diploid nuclei (e) belong to a single clade, suggesting the low double-sorting rate, whereas tetraploid (f) and >tetraploid nuclei (g) have much larger fractions of multi-clade cells generated by fusion. (h) Proportion of cardiomyocytes with different clade numbers. Tetraploid and >tetraploid cardiomyocytes show higher proportion of multi-clade cells than diploid cells (two-tailed proportion test, asterisk, p < 0.05), suggesting fusion as a mechanism for polyploidization of human cardiomyocytes. Error bar: 95% confidence interval. (i) Representative confocal images (10X, 40X, 60X) of polyploid and higher ploidy cardiomyocyte nuclei.
Figure 2
Figure 2. Heart cell type characterization through snRNA-seq and snATAC-seq.
(a) Uniform Manifold Approximation and Projection (UMAP) clustering of 59,000 nuclei from all heart nucleic type nuclei, after QC, and Harmony integration (left panel), Tetraploid nucleus cluster middle panel, and higher-ploidy nuclei cluster (right panel). (b) Dot plots generated from the integrated dataset display five highly expressed genes in each identified population based on fold-change. (c) Dot plots showing the average expression of characteristic marker genes of each identified cell types. (d) Percent proportion of nuclei integrated into the dataset. (e) UMAP clustering of a representative Multiome dataset. Left, snRNA, Middle, snATAC, Right, combined (f) Example of cell-type-specific ATAC peaks, (g) Enriched motifs in cell-type-specific peaks.
Figure 3
Figure 3. Transcriptional landscape of polyploid human heart nuclei.
(a) Differential gene expression analysis between tetraploid (4n) vs. diploid (2n) cardiomyocyte nuclei. (b) upregulated and downregulated pathways in 2n, 4n and higher-ploidy (>4n) cardiomyocytes. (c) Differential gene expression analysis between >4n vs 2n cardiomyocyte nuclei. (d) Differential gene expression analysis between >4n vs. 4n cardiomyocyte nuclei. (e) DiVenn diagram indicating shared up and downregulated genes between 2n, 4n, and >4n cardiomyocytes. (f) Highly expressed genes in tetraploid and (j) higher-ploidy cardiomyocytes.
Figure 4
Figure 4. Chromatin landscape of polyploid cardiomyocytes in the human heart.
(a) Chromatin state annotated based on histone modification profiles using ChromHMM Chromatin states for ATAC peaks with ploidy states. (b) Enrichment of differential chromatin accessibility with ploidy state changes in chromatin states. Enrichment for increased or decreased ATAC-seq peaks in 4n or >4n compared to 2n was calculated for each chromatin state. Odd ratios: differential peak enrichment compared to the background, Color: p-value by Fisher’s exact test. (c) Example of an increased chromatin peak for GPR68, TSKU, and COMMD1 in higher-ploidy cardiomyocytes (4n and >4n) compared to diploid cardiomyocytes. (d, e) Gene Ontology (GO) terms for genes with changes in chromatin accessibility in (d) tetraploid (4n) and (e) higher-ploidy (>4n) cell population in comparison to the diploid (2n) cell population.
Figure 5
Figure 5. Characterizing fusion cells.
(a) Unique clusters of endothelial cell (EC)-CM (purple, F7) and fibroblast (FB)-CM (pink, F8). (b) Heatmap clustering of ATAC-seq profiling of diploid and polyploid cells in the human heart. >4n EC-CM cells, pointed by an arrow, were clustered with CM-like populations. Color dots indicate cell type annotation based on expression. Red, CM-like; blue, EC-like; green, FB-like; purple, pericyte (PC)-like. (c) Examples of ATAC-seq profiles of EC-CM cells. Open chromatin of EC-CM showing promoter peaks similar to typical cardiomyocytes cells for PLN and RBM20. (d) Venn diagram showing peak comparison between EC-CM and CM (upper) and peak comparison between EC-CM and cardiomyocyte (lower) >4n cells. (e) Differentially expressed genes in EC-CM and FB-CM cells in 4n and >4n cells compared to 2n cardiomyocyte cells. Each raw represents a single cell. Expression levels are normalized to each column. (f) Pathway analysis for >4n EC-CM and FB-CM compared to 2n CM. (g) Gene expression signature for genes playing important roles in fusion, markers of endothelial, fibroblast and cardiomyocytes. Expression states for fusion cells were compared with other cell populations. (h) Quantification of EC-CM and FB-CM populations in human hearts identifying 4–10% of polyploid cardiomyocytes as either EC-CM or FB-CM.
Figure 6
Figure 6. Evaluation of copy number heterogeneity for individual chromosomes in diploid (2n), tetraploid (4n), and higher-ploidy (>4n) cardiomyocyte nuclei.
(a) Example of a genome-wide copy number profile of 2n, 4n, and higher-ploidy (>4n) nuclei for two individuals. Each row represents a single cell with chromosomes plotted as columns. Copy number states are depicted in different colors. Cells are clustered based on the similarity of their copy number profile. Only in higher-ploidy nuclei chromosomes 16,17,19, and 22 indicated a gain in copy number. (b) From ploidy-specific single nuclei RNAseq expression data, we evaluated changes in chromosome copy number by utilizing inferCNV. Left: The expression values for 2n are plotted in the top heatmap, and the polyploid cells are plotted in the bottom heatmap, with genes ordered from left to right across the chromosomes. The color intensities of the heatmap correspond to the residual expression values after performing a series of data transformations and effectively subtracting the 2n expression data from the higher-ploidy expression data. Right: the cells are partitioned into groups having consistent CNV patterns. CNV prediction (via HMM) is performed at the level of the subclusters and shown in the heat maps, where chromosomal region amplification shows up as red blocks and chromosomal region deletions show up as blue blocks. InferCNV analysis on the higher-ploidy cardiomyocyte also indicated a gain in copy number in chromosomes 1, 16,17,19, and 22.

Similar articles

References

    1. Ahuja P., Sdek P. & MacLellan W. R. Cardiac myocyte cell cycle control in development, disease, and regeneration. Physiological reviews 87, 521–544 (2007). 10.1152/physrev.00032.2006 - DOI - PMC - PubMed
    1. Ahuja P. et al. Re-expression of proteins involved in cytokinesis during cardiac hypertrophy. Exp Cell Res 313, 1270–1283 (2007). 10.1016/j.yexcr.2007.01.009 - DOI - PubMed
    1. Soonpaa M. H., Rubart M. & Field L. J. Challenges measuring cardiomyocyte renewal. Biochim Biophys Acta 1833, 799–803 (2013). 10.1016/j.bbamcr.2012.10.029 - DOI - PMC - PubMed
    1. Oparil S., Bishop S. P. & Clubb F. J. Jr. Myocardial cell hypertrophy or hyperplasia. Hypertension 6, III38–43 (1984). 10.1161/01.hyp.6.6_pt_2.iii38 - DOI - PubMed
    1. Swynghedauw B. Are adult cardiocytes still able to proliferate? Arch Mal Coeur Vaiss 96, 1225–1230 (2003). - PubMed

Publication types

LinkOut - more resources