[Preprint]. 2024 May 30:2024.05.30.596691.
doi: 10.1101/2024.05.30.596691.

Cortical determinants of loudness perception and auditory hypersensitivity

Affiliations

Cortical determinants of loudness perception and auditory hypersensitivity

Kameron K Clayton et al. bioRxiv. .

Abstract

Parvalbumin-expressing inhibitory neurons (PVNs) stabilize cortical network activity, generate gamma rhythms, and regulate experience-dependent plasticity. Here, we observed that activation or inactivation of PVNs functioned like a volume knob in the mouse auditory cortex (ACtx), turning neural and behavioral classification of sound level up or down over a 20dB range. PVN loudness adjustments were "sticky", such that a single bout of 40Hz PVN stimulation sustainably suppressed ACtx sound responsiveness, potentiated feedforward inhibition, and behaviorally desensitized mice to loudness. Sensory sensitivity is a cardinal feature of autism, aging, and peripheral neuropathy, prompting us to ask whether PVN stimulation can persistently desensitize mice with ACtx hyperactivity, PVN hypofunction, and loudness hypersensitivity triggered by cochlear sensorineural damage. We found that a single 16-minute bout of 40Hz PVN stimulation session restored normal loudness perception for one week, showing that perceptual deficits triggered by irreversible peripheral injuries can be reversed through targeted cortical circuit interventions.

Keywords: Autism; aging; gamma stimulation; hallucination; hearing loss; hyperacusis; inhibition stabilized network; parvalbumin; schizophrenia; tinnitus.


Conflict of interest statement

Declaration of interests The authors have no competing interests to declare.

Figures

Figure 1 –
Figure 1 –. A low-dimensional population rate code for sound level in the primary auditory cortex.
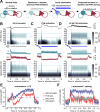
A) Cartoon data schematizes the spiking activity of 8 neurons in response to four stimuli. Stimulus representations can be high-dimensional, reflecting the location, timing, and rate of active neurons (left), the location and rate of active neurons (right), or a low-dimensional population rate code, reflecting only the summed rate of all neurons (bottom-right). B) A cartoon illustrates approach for extracellular recordings from A1 of unanesthetized, head-fixed mice with 64-channel silicon probes. Single unit waveforms were classified as fast-spiking (FS, teal) or regular spiking (RS, maroon) based on a bimodal distribution of peak to trough delays. C) Neurograms depict normalized, baseline-corrected spike rates for 721 sound-responsive RS units from 8 mice in response to broadband noise bursts of varying level. K-means clustering identified four distinct RS response profiles that can be described as saturating (n = 264), high-threshold (n = 252), suppressed (n = 74) and non-monotonic (n = 131). D) Percentage of significantly responsive RS units (top) and summed spike rate (bottom) for a random sample of 250 RS units as a function of increasing sound level. Thin lines represent each selection of 250 units. Thick line represents mean of 1000 selections. E) Confusion matrices depict decoding accuracy for sound level based solely on the population activity rate (left) versus a higher-dimensional neural representation (middle). Absolute value of sound level classification error based on summed activity rate or the higher-dimensional representation relative to the classification error that occurs by chance, with shuffled sound level labels. Decoding is performed on 1000 randomly drawn samples of 250 RS units (bar = mean). Asterisk indicates the conjunction of a p value < 0.05 after Bonferroni-Holm correction for multiple comparisons and an effect size (Hedge’s G) > 2. F) As per E, but applied to A1 RS unit decoding of tone pip frequency. G) Cartoon illustrates approach for documenting sound level processing in A1 RS units while PVNs are activated or inactivated with, ChR2 or Arch, respectively. Raster plots from four example units show a pair of directly activated and inactivated FS units (top and bottom, respectively) alongside synaptically suppressed (top) or activated (bottom) neighboring RS units. Laser pulses are 25ms in duration presented at 20Hz over a 0.5s period that subsequently tapered in amplitude to avoid rebound excitation. Mean RS PSTHs show sound-evoked spike rates with laser on and off. Scale bar = 2 sp/s. H) Top: Mean ±SEM spike rate-level functions are significantly suppressed by PVN activation (N/n = 4/401 mice/RS units). A 2×2 factorial linear mixed effects model ANOVA identified a significant main effect for PVN activation and a significant level x PVN activation interaction (F > 35, p < 3× 10⁻⁹ for each). Bottom: Steeper sound level growth with PVN inactivation (N/n = 4/320 RS units). A 2×2 factorial linear mixed effects model ANOVA identified a trend for PVN inactivation (F = 3.67, p = 0.06) but a significant level x PVN inactivation interaction term (F > 35, p < 2 × 10⁻⁹ ). I) Confusion matrices depict the change in classification probability between the laser off and laser on conditions based on the summed population activity rate. Other plotting conventions as per E and F. J) Classified sound level from summed population rate was nearly 20dB lower than actual sound level during PVN activation but nearly 10dB higher than the actual sound level during PVN inactivation. Decoding is performed on 1000 randomly drawn samples of 250 RS units for each condition (bar = mean). Asterisks indicate significant differences between laser on and off conditions based on a permutation test (p = 0.0001 for both).
Figure 2 –
Figure 2 –. PVN activation – not sensory stimulation – entrains endogenous spiking at gamma frequencies.
A) Cartoon illustrates prominent gamma rhythms associated with recurrently connected inhibitory PVNs and excitatory pyramidal neurons (PyrN). Diminished PVN activity is associated with reduced gamma rhythms, which could be reinvigorated and sustained through PVN activation at gamma frequencies. B) A1 local field potential (LFP) (top) and spiking activity (bottom) across layers during 40 Hz acoustic stimulation, Middle subpanel shows mean ±SEM FS and RS rates for 3 mice (58 FS units, 318 RS units). C) As per B, but with sustained PVN optogenetic activation D) As per B, but with 40 Hz PVN stimulation. E) LFP gamma entrainment was calculated as the PSD amplitude in the 35–45Hz range during the 1s stimulation period relative to other frequencies. LFP gamma entrainment with 40Hz acoustic and 40Hz PVN activation were significantly greater than PVN activation and not different from one another (N = 3 mice, 14 columnar recording sites; 2×2 repeated measures ANOVA main effect for time [F = 119.49, p = 7 × 10⁻⁸]; main effect for stimulus type [F = 30.63, p = 2 × 10⁻⁷]; time x stimulus type interaction [F = 21.9, p = 3 × 10⁻⁶]. Post-hoc pairwise contrasts: 40 Hz acoustic vs PVN (p = 5 × 10⁻⁶), 40Hz PVN vs PVN (p = 6 × 10⁻⁵), 40 Hz acoustic vs 40 Hz PVN (p = 0.44). F) As per E but measured from A1 spiking activity. Gamma entrainment to 40Hz PVN activation was significantly greater than PVN activation and 40 Hz acoustic activation, which were not different from each other (N = 3 mice, 14 penetrations, n = RS 376 units; 2×2 repeated measures ANOVA main effect for time [F = 35.43, p = 5 × 10⁻⁵]; main effect for stimulus type [F = 10.66, p = 5 × 10⁻⁴]; time x stimulus type interaction [F = 11.73, p = 3 × 10⁻⁴]. Post-hoc pairwise contrasts: 40 Hz acoustic vs PVN (p = 0.43), 40Hz PVN vs PVN (p = 0.002), 40 Hz acoustic vs 40 Hz PVN (p = 6 × 10⁻⁴).
Figure 3 –
Figure 3 –. Potentiated PVN-mediated inhibition, gamma rhythms, and sustained reductions in sound-evoked activity after direct activation of PVNs at 40Hz.
A) Schematic for PVN γ and PVN control stimulation and recording protocols. B) Steady-state (non-evoked) LFP power in the delta (2–4Hz) and gamma (30–80Hz) range was measured before and after PVN stimulation and expressed as a difference (post-pre). The change in spontaneous gamma power was significantly increased following a single bout of PVN γ stimulation (unpaired t-tests against a population mean of zero, t > 4.5 and p < 1 × 10⁻⁵ for 30 and 60 minutes) whereas delta oscillations were not significantly changed (t < 0.12, p < 0.17 for 30 and 60 minutes). N = 4 mice / 42 recording sites. C) Example frequency response areas (top) and raster plots (bottom) present changes in frequency tuning and sound-evoked spiking at the best frequency (BF) for a single RS unit. D) Mean reduced sound-evoked firing rates (+60 minutes – baseline) relative to the baseline BF. E) Mean ±SEM Evoked firing rates as a function of sound level normalized to the maximum response during the baseline period. F) As per D, but for ChR2+ FS units that were activated during PVN γ stimulation (FSentrained, top) or less activated during the period of PVN γ stimulation (FSnon-entrained, bottom). G) Fold change in evoked firing rate (+30m or +60m / baseline) was calculated for each single unit from a fixed range of effective baseline tone frequencies (BF ± 0.5 octaves, 50–80 dB SPL). Sound-evoked firing rates were persistently increased in FSentrained units and decreased in RS units after PVN γ stimulation but not control stimulation (3-way mixed design ANOVA, main effect for time [F = 380.45, p = 4 × 10−57]; main effect for cell type [F = 8.89, p = 2 × 10⁻⁴]; main effect for stimulation type [F = 2.54, p = 0.11]; cell type x stimulation type interaction [F = 9.77, p = 8 × 10⁻⁵]; time x cell type x stimulation type [F = 10.17, p = 6 × 10⁻⁵]; N = 4 PVN γ stimulation mice (n = 91/21/22 units that were significantly sound-evoked at baseline, RS/FSentrained (upward triangles)/FSnon-entrained (downward triangles) and 6 PVN control stimulation (n = 163/23/23)). Asterisks indicate significant pairwise differences 60min after PVN γ vs control stimulation for RS units (p = 0.01) and for FSentrained (p = 0.03). Gray lines indicate a non-significant difference (p > 0.07 for both). Upward and downward arrows indicate the occurrence of an outlying value above (upward) or below (downward) the plotted range. Diagonal arrow identifies the unit shown in C. H) Top: Confusion matrices depict the change in sound level classification probability between the baseline and 60min after PVN γ stimulation. Classification is based on the population activity rate from 100 RS units. Dashed gray line represents veridical classification. Bottom: Decoding was performed on 1000 random samples of 100 RS units from a total pool of n = 311/167 (PVN control/ γ stimulation). Bar = mean. Sound level was significantly biased towards lower, desensitized sound level classification after PVN γ stimulation compared to PVN control stimulation (Mixed design ANOVA, main effect for stimulation type [F = 2205, p < 1 × 10−60]; main effect for time [F = 4040.3, p < 1 × 10−60]; stimulation type x time interaction [F = 2074.7, p < 1 × 10−60]; Asterisk indicates the conjunction of a corrected p value < 0.05 and a large effect size (Hedge’s G) > 2. I) Raster plots show PVN-mediated inhibition from a RS unit measured at baseline and 60 minutes after PVN γ stimulation. PVN-mediated inhibition of spontaneous RS spiking was calculated as an asymmetry index for each eligible RS unit as (Laserpost − Laserpre / Laserpost + Laserpre), where a negative value indicates increased inhibition and a value of zero indicates no difference. Line plots plot the asymmetry indices for the same RS unit shown above at baseline, +30min, and +60min. Diagonal arrow identifies the unit shown in I. J) Change in PVN-mediated inhibition after PVN control/ PVN γ stimulation (N = 6/4 mice, 254/147 RS units) measured as the mean asymmetry index after stimulation – mean asymmetry index pre-stimulation, such that negative values represent enhanced inhibition. Gray area represents the 95% confidence interval of PVN-mediated inhibition measured at 0mW, which provides an estimate of measurement noise. PVN-mediated inhibition of RS units is significantly greater 60 minutes after PVN γ stimulation compared to PVN control stimulation (unpaired t-test, t = 3.27, p = 0.001) but is only marginally increased at 30 minutes (t = 1.92, p = 0.06).
Figure 4 –
Figure 4 –. A two-alternative forced choice task to measure loudness perception.
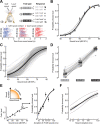
A) Top, Mice were trained to categorize 11.3 kHz tones as either ‘soft’ or ‘loud’. On approximately 50% of trials, mice were conditionally reinforced for accurate categorization of soft (40–45 dB SPL) and loud (75–80 dB SPL) tones. Mice received water reward regardless of their choice for moderate levels (50–70 dB SPL). Bottom, Lick rasters from one example behavioral session for trials at three different intensities. Color represents spout choice. Each row represents a single trial. B) Psychometric functions were fit to raw left/right choice data using binary logistic regression. Fits were applied to the concatenated data (thick black line) drawn from three behavioral sessions (thin gray lines). Error bars = SEM. C) All behavioral choice functions (n = 165 sessions from 47 mice). Thick line represents the grand average of individual sessions. D) Choice probability for all mice in the conditionally reinforced levels (40–45 and 75–80 dB SPL) and moderate unconditionally reinforced probe levels (50–70 dB SPL). Thick lines = sample mean. Each mouse is represented as an individual thin line. E) Schematic illustrates loudness increasing as a function of sound level or sound duration. Bottom: Loudness classification for a representative mouse with 150ms tones. Right: Loudness classification in the same mouse for a 70 dB SPL tone across a range of shorter durations. Error bars represents the bootstrapped SEM of choice probability at each intensity. F) The probability of reporting a fixed sound level as loud significantly decreased with decreasing sound duration (one-way repeated measures ANOVA, N = 5 mice, F = 46.41, p = 3 × 10⁻¹⁰). Solid black line and thin gray lines represent mean and individual mice, respectively.
Figure 5 –
Figure 5 –. ACtx PVNs regulate loudness perception.
A) Cartoon and schematic depict the organization of optogenetic stimulation, sound presentation, lick contact registration, and reward delivery for behavioral studies that combine loudness categorization with bilateral manipulation of PVN activity. B) Cortical silencing via PVN activation did not significantly change the probability of tone detection (N = 14 mice, paired t-test, t = 1.11, p = 0.29). Light gray circles and lines denote individual mice. Bars indicate sample means. C) Lick rasters for a fixed sound level demonstrate a switch in loudness categorization from loud to soft when tones were presented during PVN activation. Each row represents a single trial. D) Top: Sound level classification during interleaved laser on and off trials in an example mouse that expressed ChR2 in PVNs. Error bars = SEM. Bottom: Choice probability for all mice (N = 14, thin lines) and means (thick horizontal lines) for interleaved laser on and off trials. PVN activation significantly reduced the probability of reporting sound levels as loud (2-way repeated measures ANOVA; main effect for PVN activation [F = 29.9, p = 6 × 10⁻⁵], level x PVN activation interaction [F = 28.88, p = 7 × 10⁻⁵]. E) At a fixed sound level reliably perceived as loud, titrating the degree of PVN activation progressively reduced the probability of loud classification in an example mouse (top) and across all mice (thin lines = individual mice; thick line = mean of 5 mice; 1-way repeated measures ANOVA, [F = 9.63, p = 9 × 10⁻⁵]. F) Top: Sound level classification during interleaved laser on and off trials in an example mouse that expressed the control fluorophore GFP in ACtx neurons. Error bars = SEM. Bottom: Choice probability for all mice (N = 4, thin lines) and means (thick horizontal lines) for interleaved laser on and off trials. Exciting GFP with blue light had no impact on loudness reporting (2-way repeated measures ANOVA; main effect for PVN activation [F = 1.85, p = 0.27], level x PVN activation interaction [F = 1.35, p = 0.33]. G) Top: Sound level classification during interleaved laser on and off trials in an example mouse that expressed Arch in PVNs. Error bars = SEM. Bottom: Choice probability for all mice (N = 5, thin lines) and means (thick horizontal lines) for interleaved laser on and off trials. PVN inactivation significantly increased the probability of reporting sound levels as loud (2-way repeated measures ANOVA; main effect for PVN activation [F = 17.4, p = 0.01], level x PVN activation interaction [F = 25.69, p = 0.007]. H) Timeline for experiments that studied persistent changes in loudness classification over several days following 1000 trials of PVN activation concentrated into a 16-minute period. As a positive control for each mouse, we first confirmed that PVN activation during sound presentation reduced the probability of reporting sounds as loud (acute PVN testing) before investigating whether sound level reporting could be stably shifted following control or γ stimulation paradigms. I) Choice probability for each mouse (N = 5, thin lines) and means (thick horizontal lines) from the baseline testing period (gray lines) and post PVN control stimulation (blue lines). A single bout of PVN control stimulation had no impact on loudness reporting (2-way repeated measures ANOVA; main effect for PVN activation [F = 1.19, p = 0.34], level x PVN activation interaction [F = 1.41, p = 0.3]. J) As per I, but for PVN γ stimulation. A single bout of PVN γ stimulation significantly reduced the probability of reporting sounds as loud for several days after stimulation (2-way repeated measures ANOVA; main effect for PVN activation [F = 13.57, p = 0.03], level x PVN activation interaction [F = 11.86, p = 0.04]. K) Inset: The loudness transition point was defined as the sound level associated with a 0.5 probability of reporting sounds as loud. Individual mice are represented as thin lines and the sample mean as a thick line. Circles denote wildtype mice in which GFP was expressed in ACtx neurons with AAV2/5-hSyn-EGFP or ChR2 was selectively expressed in PVNs with AAV2/5-S5E2-mCherry. Triangles denote transgenic PV-Cre x Ai32 mice that express ChR2 in PVNs. Squares denote PV-Cre mice that express Arch or ChR2 in PVNs with AAV-DIO-ChR2 or AAV-FLEX-Arch. Paired t-tests: GFP (t = 3.02, p = 0.06); PVN inactivation via Arch (t = 4.22, p = 0.01); PVN activation via ChR2 (t = −7.17, p = 2 × 10⁻⁵); following PVN control activation (t = 0.11; p = 0.92), following PVN γ stimulation (t = −4.0, p = 0.03). Asterisk denotes p value < 0.05. Gray lines = not significant.
Figure 6 –
Figure 6 –. Cortical hyperresponsivity and loudness hypersensitivity to spared sound frequencies following noise-induced sensorineural hearing loss
A) Cartoon illustrates SNHL and sham noise exposure protocols, region of outer hair cell damage and inner hair cell (IHC) synaptic loss in the organ of Corti, and ABR waveforms from an example SNHL and sham mouse elicited by 32kHz tones. Scale bars = 1ms and 1μV. B) Mean ±SEM ABR thresholds were significantly elevated several weeks after SNHL compared to sham exposure, particularly at high frequencies (one-way ANOVA, N = 5/6 sham/SNHL; main effect for group [F = 25.88, p = 0.0007]) Asterisks indicate significant differences with post-hoc pairwise contrasts (p < 0.006). C) Left, cochlea immunostained for anti-CtBP2 and anti-GluR2a reveal presynaptic ribbon and post-synaptic glutamate receptor patches on inner hair cells (IHC’s). Right, SNHL exposure caused a permanent reduction of IHC synapses in the high frequency region compared to sham-exposed cochleae (Mixed model ANOVA with Group as a factor and Frequency as a repeated measure: Frequency x Group interaction, F = 22.0, p = 5 × 10⁻¹¹). Asterisks denote significant differences between sham and noise exposure with post hoc pairwise comparisons (p < 0.005). Scale bar is 10 µm. D) Experimental timeline for A1 electrophysiology recordings in noise-exposed mice. Lateral view of the mouse brain depicts tonotopic gradients of various fields within the mouse ACtx, highlighting the deafferented high-frequency region of A1, where recordings were made in SNHL mice. E) Top: Frequency response areas from two RS units recorded in the high-frequency region of the A1 tonotopic map before and after SNHL. Bottom: Rasters from the same units display sound-evoked spiking elicited by 11.3kHz tones of varying levels. Gray bars denote tone duration. F) Mean ±SEM spike rate-level functions in SNHL RS (top, N/n = 6/376) and FS (bottom, n = 172) units are both significantly greater than sham RS (N/n = 5/339) and FS (n = 155) units (Two-way mixed design ANOVA, level x group interaction, F > 4.75, p < 2 × 10⁻⁹ for both). G) Sound-evoked A1 responses to 11.3kHz spared frequency tones from the same units in F are significantly increased in SNHL mice compared to sham (Mixed design ANOVA, main effect for exposure group [F = 12.17, p = 4 × 10⁻⁴]). Asterisks denote significant pairwise contrasts for RS and FS, respectively (p = 4 × 10⁻⁵ and 4 × 10⁻⁴, respectively). Each single unit is depicted as a circle. Horizontal bar = mean. Diagonal arrow illustrates the RS unit shown in E. H) Sound-evoked ABR wave 1 responses to 11.3kHz spared frequency tones were not different between SNHL/Sham (N = 6/5) (Mixed design ANOVA, main effect for exposure group [F = 0.05, p = 0.83]). I) Experimental timeline for the 2AFC behavioral studies that tracked sound level categorization before and after exposure to sham, synaptopathic, and SNHL noise levels. Lick rasters display single trial categorization for behavioral sessions from the same mouse before and after SNHL at a moderate, unconditionally reinforced sound level. J) Top: Sound level classification before and after sham exposure in an example mouse. Error bars = SEM. Bottom: Choice probability for all sham mice (N = 6, thin lines) and means (thick horizontal lines) from the baseline and post-exposure period. Sham exposure had no impact on loudness reporting (2-way repeated measures ANOVA; main effect for Time [F = 2.85, p = 0.15], Level x Time interaction [F = 1.65, p = 0.26]. K) As per J, Top: an example SNHL mouse. Bottom: Choice probability for all SNHL mice (N = 12, thin lines). SNHL exposure significantly increased the probability of reporting sounds as loud, particularly at low and moderate sound intensities (2-way repeated measures ANOVA; main effect for Time [F = 107.3, p = 6 × 10⁻⁷], Level x Time interaction [F = 99.15, p = 8 × 10⁻⁷]. Pairwise contrasts identified significant differences at 40–45 and 50–70 level ranges (p < 2 × 10⁻⁵ for both). L) Loudness transition points for individual mice (thin lines) and sample means (thick line). PVI inactivation data with Arch are replotted to facilitate direct comparison to noise exposure. Paired t-tests: Sham (t = 3.02, p = 0.06); SNHL (t = 11.33, p = 3 × 10⁻⁷); synaptopathic noise exposure (N = 6; t = 5.47, p = 0.003). M) Scatterplot depicts the change in loudness transition point against the change in reaction time for individual mice (circles) and means (open circles, bi-directional error bars = SEM). Reaction time was not significantly changed after noise exposure (One-way ANOVA [F = 1.77, p = 0.2) and no significant correlation was observed between loudness hypersensitivity and reaction time (Pearson r = −0.14, p = 0.52).
Figure 7 –
Figure 7 –. ACtx PVN activation is sufficient to rescue loudness hypersensitivity after SNHL
A) Cartoon illustrates LFP waveforms from electrodes in the upper, middle, and deep layers of A1 as well as subcortical white matter. Recordings of LFP and single unit spiking were performed with and without optogenetic activation of PVNs transduced with ChR2. B) Steady-state (non-evoked) LFP power in the gamma (30–80Hz) and delta (2–4Hz) range was measured after SNHL or sham exposure. The change in spontaneous gamma power in A1 was significantly reduced in SNHL mice (unpaired t-test [t = 6.27, p = 2 × 10⁻⁹) but no significant changes were observed in the subcortical white matter or in the delta band (t < 0.76 and p > 0.19 for all comparisons). N = 6/5 mice and 26/19 recording sites for SNHL/sham. C) Rasters present spontaneous spike events for single RS units recorded in the high-frequency region of the A1 tonotopic map the day before and day after SNHL. PVN activation was titrated by varying the laser power across a 0–40 mW range. D) Mean ±SEM PVN-mediated inhibition of RS units was calculated with an asymmetry index where the spike rate within the 0.5s laser period were compared to the 0mW control. Negative values reflect reduced spiking relative to the no-laser 0mW condition. PVN-mediated inhibition of RS units across laser powers was significantly reduced in SNHL mice compared to sham controls (two-way mixed design ANOVA on 471/343 RS units in 6/5 SNHL/sham mice, laser power x exposure group interaction [F = 5.14, p = 3 × 10⁻¹⁰]). E) Area under the laser power x asymmetry index curve shown in D calculated for each RS unit. Horizontal line = mean. Asterisk indicated that SNHL units were significantly less inhibited by PVN activation (unpaired t-test [t = 5.47, p = 0.02]). Circles denote each RS unit. Diagonal arrow identifies RS unit shown in C. F) As per C, but for two ChR2+ FS units directly activated by the laser. G) As per D, but for FS unit directly activated by the laser in SNHL (N/n = 6/74) and Sham (N/n = 5/88) mice, where positive values identify direct optogenetically elicited spiking. The increase in laser-evoked spike rate in ChR2+ PVNs did not differ between SNHL and Sham mice (two-way mixed design ANOVA, Power x Exposure interaction [F = 0.36, p = 0.98]). H) As per E, area under the asymmetry index curve for the FS units in G were not different between SNHL and sham units (unpaired t-test [t = 4 × 10⁻⁹, p = 1.0]). Diagonal arrow identified example unit in F. I) Experimental timeline for 2AFC behavioral studies tracking sound level categorization before and after SNHL with and without bilateral PVN activation. J) Left: Sound level categorization in an example hypersensitive SNHL mouse was restored to baseline during PVN activation. Error bars = SEM. Bottom: Choice probability for SNHL mice (N = 7) were measured at pre-exposure baseline, after SNHL, and in a third phase in SNHL mice with interleaved PVN activation and laser off trials. Thick horizontal lines = mean; individual mice are shown as thin lines. from the baseline and post-exposure period. SNHL exposure significantly increased the probability of reporting sounds as loud, particularly at low and moderate sound intensities (2-way repeated measures ANOVA; main effect for Time [F = 107.3, p = 6 × 10⁻⁷], Level x Time interaction [F = 99.15, p = 8 × 10⁻⁷]). Asterisks and black lines indicate significant pairwise differences with Bonferroni-Holm correction for multiple comparisons (p < 0.02 for all); gray lines indicate a non-significant difference (p > 0.06 for all). K) Loudness transition points for individual mice (thin lines) and sample means (thick line) in SNHL mice (N=7). Asterisks and black lines indicate significant pairwise differences (paired t-tests with Bonferroni-Holm correction for multiple comparisons, p < 0.002 for all); gray line indicates a non-significant difference (p = 0.56).
Figure 8 –
Figure 8 –. A single bout of PVN γ stimulation reverses loudness hyperacusis for one week
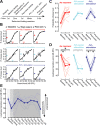
A) Timeline for experiments that seek to induce a sustained reduction in loudness hyperacusis after noise-induced hearing loss with a single bout of PVN activation. B) Sound level categorization in three example mice measured at baseline, after noise exposure, and after a stimulation period. Error bars = SEM. Arrow indicates the mean probability of selecting the loud spout across the range of unconditionally reinforced moderate sound levels (50–70 dB SPL). Downward triangle = loudness transition point. C) Mean choice probability within the unconditionally reinforced range of moderate sound levels for mice that received no stimulation after the post-exposure test session (N = 5/6, SNHL/synaptopathic exposure level, red/orange), PVI control stimulation (N = 3 SNHL), or PVI γ stimulation (N=5 SNHL). The change in choice probability across sessions was significantly dependent on stimulation group (mixed design ANOVA, main effect for session [F = 29.5, p = 6 × 10⁻⁸]; session x group interaction [F = 5.99, p = 0.001]). Thick line = sample mean. D) As per C, but for the loudness transition point. The change in choice probability across sessions was significantly dependent on stimulation group (mixed design ANOVA, main effect for session [F = 39.6, p = 3× 10⁻⁹]; session x group interaction [F = 5.15, p = 0.003]). Thick line = sample mean. Asterisks and black lines indicate significant pairwise differences (paired t-tests with Bonferroni-Holm correction for multiple comparisons, p < 0.04 for all); gray lines indicate a non-significant difference (p > 0.06 for all). E) Loudness transition point across an extended period of testing in five SNHL mice that received PVN γ stimulation. Thin lines represent individual mice. Thick line = sample mean.

References

    1. Sachs M.B., and Abbas P.J. (1974). Rate versus level functions for auditory-nerve fibers in cats: tone-burst stimuli. 1847, 1835–1847. - PubMed
    1. Moser T., Karagulyan N., Neef J., and Jaime Tobón L.M. (2023). Diversity matters — extending sound intensity coding by inner hair cells via heterogeneous synapses. EMBO J 42, 1–17. 10.15252/embj.2023114587. - DOI - PMC - PubMed
    1. Sadagopan S., and Wang X. (2010). Contribution of inhibition to stimulus selectivity in primary auditory cortex of awake primates. Journal of Neuroscience 30, 7314–7325. 10.1523/JNEUROSCI.5072-09.2010. - DOI - PMC - PubMed
    1. Tan A.Y.Y., Atencio C.A., Polley D.B., Merzenich M.M., and Schreiner C.E. (2007). Unbalanced synaptic inhibition can create intensity-tuned auditory cortex neurons. Neuroscience 146, 449–462. 10.1016/j.neuroscience.2007.01.019. - DOI - PubMed
    1. Tobin M., Sheth J., Wood K.C., Michel E.K., and Geffen M.N. (2024). Differential modulation of cortical codes for sounds of varying intensity by distinct inhibitory neurons. bioRxiv. - PubMed

Publication types