[Preprint]. 2024 May 31:rs.3.rs-4438240.
doi: 10.21203/rs.3.rs-4438240/v1.

Transfer with microbiota from lean donors prevents excessive weight gain and restores gut-brain vagal signaling in obese rats maintained on a high fat diet

Affiliations

Transfer with microbiota from lean donors prevents excessive weight gain and restores gut-brain vagal signaling in obese rats maintained on a high fat diet

Dulce M Minaya et al. Res Sq. .

Update in

Abstract

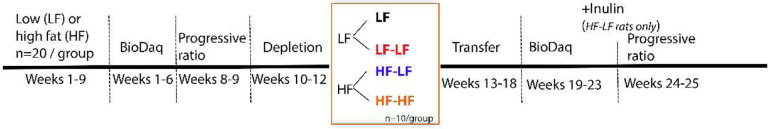
Background: The collection of microorganisms, mainly bacteria, which live in the gastrointestinal (GI) tract are collectible known as the gut microbiota. GI bacteria play an active role in regulation of the host's immune system and metabolism, as well as certain pathophysiological processes. Diet is the main factor modulating GI microbiota composition and recent studies have shown that high fat (HF) diets induce detrimental changes, known as dysbiosis, in the GI bacterial makeup. HF diet induced microbiota dysbiosis has been associated with structural and functional changes in gut-brain vagally mediated signaling system, associated with overeating and obesity. Although HF-driven changes in microbiota composition are sufficient to alter vagal signaling, it is unknown if restoring normal microbiota in obesity can improve gut-brain signaling and metabolic outcomes. In this study, we evaluated the effect of lean gut microbiota transfer in obese, vagally compromised, rats on gut-brain communication, food intake, and body weight. Male Sprague-Dawley rats were maintained on regular chow, or 45% HF diet for nine weeks followed by three weeks of microbiota depletion using an antibiotic cocktail. The animals were then divided into four groups (n=10 each): LF - control group on regular chow, LF-LF - chow fed animals that received antibiotics and microbiota from chow fed animals, HF-LF - HF fed animals that received microbiota from chow fed animals, and HF-HF - HF fed animals that received microbiota from HF fed animals. Animals were gavaged with donor microbiota for three consecutive days on week one and once a week thereafter for three more weeks. HF-LF animals received inulin as a prebiotic to aid the establishment of the lean microbiome.

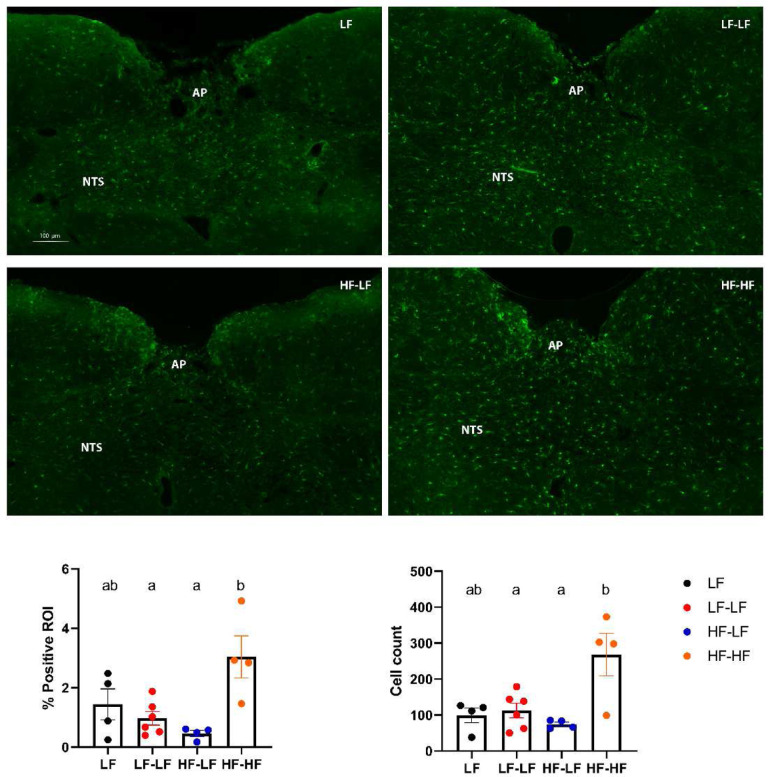
Results: We found that transferring a LF microbiota to HF fed animals (HF-LF) reduced caloric intake during the light phase when compared with HF-HF rats and prevented additional excessive weight gain. We did not observe significant changes in the density of vagal afferents terminating in the brainstem among the groups, however, HF-LF animals displayed an increase in postprandial activation of both primary sensory neurons innervating the GI tract and brainstem secondary neurons.

Conclusions: We concluded from these data that normalizing microbiota composition in obese rats improves gut-brain communication and restores normal feeding patterns which was associated with a reduction in weight gain.

Keywords: Dysbiosis; Gut microbiota; Gut-brain axis; Microbiota Transfer; Obesity.


Conflict of interest statement

Competing interests The authors declare that they have no competing interests.

Figures

Figure 1.
Figure 1.. Experimental Timeline
Alpha value for statistical significance was set at 0.05.
Figure 2.
Figure 2.. LF microbiota transfer prevented excessive weight gain in HF fed rats.
Pre-inoculation caloric intake (A, n = 12 per group), pre-inoculation body weight gain (C, n = 10 per group), post-inoculation caloric intake (B, n = 6 per group), and post-inoculation body weight gain (D, n = 10 per group). Pre-inoculation, HF fed rats ate significantly more (p<0.01) and gained significantly more body weight than LF fed animals (p<0.0001). Post-inoculation, HF-HF rats ate significantly more than all other groups (ps<0.05). LF and HF-LF rats gained significantly less body weight than HF-HF rats (ps<0.05). Bars denoted with the same letter are not statistically different. In graphs C and D, a denotes statistical significance between LF and HF rats, b denotes statistical significance between LF vs HF-HF and HF-LF vs HF-HF, and c denotes statistical significance between LF and LF-LF. LF: Low fat fed control; LF-LF: Low fat rats that received microbiota from low fat fed donors; HF-LF; High fat fed rats that received microbiota from low fat fed donors; HF-HF: High fat fed rats that received microbiota from high fat fed donors.
Figure 3.
Figure 3.. LF microbiota transfer improved microbiota profile in HF fed rats.
A. Shannon index shown as mean ± SEM for each group. HF fed rats had significantly lower species diversity than LF fed rats (F (3, 19) = 9.741, p<0.001). B. Principal coordinate analysis was analyzed using a pairwise PERMANOVA test with Benjamin-Hochberg procedure for multi-testing adjustment. Results revealed significant differences among the groups (F = 5.0392; R2=0.4431; p<0.001). The microbiota of LF and LF-LF rats clustered together (P = 0.121) and away from HF-HF (ps<0.01). The microbiota of HF-LF was significantly different from the microbiota of LF and LF-LF (ps<0.01) and HF-HF (p<0.0045) rats. However, it clustered closer to the microbiota of the LF and LF-LF groups than to the HF-HF cohort. C. Bacterial phyla abundance was quantified in fecal samples. Bacteroidetes and Firmicutes were the most abundant bacterial phyla in all groups. LF (LF and LF-LF) fed animals had significantly higher abundance of Bacteroidetes than HF (HF-LF and HF-HF) fed rats (Ps < 0.05). However, LF fed animals and HF-LF rats had significantly higher abundance of Bacteroidetes than HF-HF rats (Ps < 0.001). In contrast, HF-HF animals had significantly higher abundance of Firmicutes compared to LF fed and HF-LF rats (Ps < 0.001). D-E. Examples of taxa that displayed significantly different patterns of abundance among the groups. Bars denoted with the same letter are not statistically different. LF (n=5): Low fat fed control; LF-LF (n=8): Low fat rats that received microbiota from low fat fed donors; HF-LF (n=6); High fat fed rats that received microbiota from low fat fed donors; HF-HF (n=4): High fat fed rats that received microbiota from high fat fed donors.
Figure 4.
Figure 4.. LF microbiota transfer normalized feeding patterns in HF fed rats.
This figure shows representative data of 24-h food intake. Pre-inoculation data is shown on the left column. Post-inoculation data is shown on the right column. A, B. Meal size during the dark phase. There were no differences in meal size among the groups. C, D. Meal size during the light phase. Pre-inoculation, HF feeding significantly increased meal size. Post-inoculation, HF-HF rats had significantly larger meal size compared to LF, LF-LF, and HF-LF. E, F. Meal number during the dark phase. Pre-inoculation, there were no differences in meal number between LF and HF fed animals. Post-inoculation, HF-LF animals had a significantly lower meal number than LF-LF rats. G, H. Meal number during the light phase. There were no significant differences in meal number during the light phase among the groups. Bars denoted with the same letter are not statistically different. Pre-inoculation, LF n=11–12, HF n=12. Post-inoculation, LF (n=6): Low fat fed control; LF-LF (n=6): Low fat rats that received microbiota from low fat fed donors; HF-LF (n=6); High fat fed rats that received microbiota from low fat fed donors; HF-HF (n=6): High fat fed rats that received microbiota from high fat fed donors.
Figure 5.
Figure 5.. LF microbiota transfer improved acquisition time for an operant task in HF fed rats.
Pre-inoculation data is shown on the left column. Post-inoculation data is shown on the right column. A, B. Time to acquire FR3 training criteria. C, D. Time to acquire FR5 training criteria. HF-HF rats showed slower acquisition learning in FR3 and FR5 (ps < 0.05). There was no difference in willingness to work for a food reward (breakpoint; Suppl. Fig. 2). Pre-inoculation, LF n=19, HF n=17–18. Post-inoculation, LF (n=9): Low fat fed control; LF-LF (n=9): Low fat rats that received microbiota from low fat fed donors; HF-LF (n=9); High fat fed rats that received microbiota from low fat fed donors; HF-HF (n=8): High fat fed rats that received microbiota from high fat fed donors.
Figure 6.
Figure 6.. LF microbiota transfer increased post-prandial nodose ganglia (NG) and NTS activation in HF fed rats.
Representative sections of NG are shown (A-D). Immunostaining against CART revealed that HF-LF animals had significantly higher number of CART positive neurons in the NG compared to HF-HF (p<0.05) and LF (ps<0.01) animals (E). Representative images of c-Fos staining in the hindbrain between bregma −13.10 and −14.10 mm are shown (F-I). HF-LF animals exhibited significantly higher c-Fos positive cells in the NTS compared to HF-HF (p<0.05) and LF-LF (p<0.05) rats (J). Bars denoted with the same letter are not statistically different. LF (NG n=5; NTS n=4): Low fat fed control; LF-LF (NG n=4; NTS n=4): Low fat rats that received microbiota from low fat fed donors; HF-LF (NG n=6; NTS n=3); High fat fed rats that received microbiota from low fat fed donors; HF-HF (NG n=4; NTS n=3): High fat fed rats that received microbiota from high fat fed donors; AP: Area postrema; NTS: Nucleus Tractus Solitarious.
Figure 7.
Figure 7.. LF microbiota transfer reduced immune cells activation in the NTS in HF fed rats.
Representative images of Iba-1 staining in the hindbrain between bregma −13.10 and −14.10 mm. Binary analysis of the area fraction of Iba1 immunoreactivity and cell count of microglia revealed HF fed rats that received microbiota from HF fed donors (HF-HF) had significantly higher Iba1 immunoreactivity and activated microglia than LF fed rats (LF and LF-LF) and HF fed rats that received microbiota from LF fed donors (HF-LF) (Ps < 0.05). Bars denoted with the same letter are not statistically different. LF (n=4): Low fat fed control; LF-LF (n=6): Low fat rats that received microbiota from low fat fed donors; HF-LF (n=4); High fat fed rats that received microbiota from low fat fed donors; HF-HF (n=4): High fat fed rats that received microbiota from high fat fed donors; AP: Area postrema; NTS: Nucleus Tractus Solitarious.

Similar articles

References

    1. Hales CM, Carroll MD, Fryar CD, and Ogden CL. Prevalence of Obesity and Severe Obesity Among Adults: United States, 2017–2018. NCHS Data Brief 1-8, 2020. - PubMed
    1. Cawley J, Biener A, Meyerhoefer C, Ding YC, Zvenyach T, Smolarz BG, and Ramasamy A. Direct medical costs of obesity in the United States and the most populous states. J Manag Care Spec Ph 27: 354–366, 2021. - PMC - PubMed
    1. Stephenson J, Smith CM, Kearns B, Haywood A, and Bissell P. The association between obesity and quality of life: a retrospective analysis of a large-scale population-based cohort study. Bmc Public Health 21: 2021. - PMC - PubMed
    1. Hill JO, Wyatt HR, and Peters JC. Energy Balance and Obesity. Circulation 126: 126–132, 2012. - PMC - PubMed
    1. Fujisaka S, Watanabe Y, and Tobe K. The gut microbiome: a core regulator of metabolism. J Endocrinol 256: 2023. - PMC - PubMed

Publication types