[Preprint]. 2024 May 30:2024.05.29.596423.
doi: 10.1101/2024.05.29.596423.

Directly Measuring Atherogenic Lipoprotein Kinetics in Zebrafish with the Photoconvertible LipoTimer Reporter

Affiliations

Directly Measuring Atherogenic Lipoprotein Kinetics in Zebrafish with the Photoconvertible LipoTimer Reporter

Tabea O C Moll et al. bioRxiv. .

Update in

Abstract

Lipoprotein kinetics are a crucial factor in understanding lipoprotein metabolism since a prolonged time in circulation can contribute to the atherogenic character of apolipoprotein-B (ApoB)-containing lipoproteins (B-lps). Here, we report a method to directly measure lipoprotein kinetics in live developing animals. We developed a zebrafish geneticly encoded reporter, LipoTimer, in which endogenous ApoBb.1 is fused to the photoconvertible fluorophore Dendra2 which shift its emission profile from green to red upon UV exposure. By quantifying the red population of ApoB-Dendra2 over time, we found that B-lp turnover in wild-type larvae becomes faster as development proceeds. Mutants with impaired B-lp uptake or lipolysis present with increased B-lp levels and half-life. In contrast, mutants with impaired B-lp triglyceride loading display slightly fewer and smaller-B-lps, which have a significantly shorter B-lp half-life. Further, we showed that chronic high-cholesterol feeding is associated with a longer B-lp half-life in wild-type juveniles but does not lead to changes in B-lp half-life in lipolysis deficient apoC2 mutants. These data support the hypothesis that B-lp lipolysis is suppressed by the flood of intestinal-derived B-lps that follow a high-fat meal.

Keywords: apolipoprotein B; half-life; kinetics; lipoproteins; zebrafish.


Conflict of interest statement

Declaration of interests The authors have declared that no conflict of interest exists.

Figures
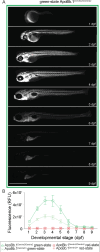
Figure 1:
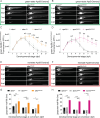
Figure 1:. LipoTimer efficiently visualizes B-lps in live animals, and quantification of B-lp levels correlates with yolk utilization.
(A) B-lp levels are visualized in LipoTimer larva using green emission filters on a fluorescent microscope. Representative images of the same apoBb.1Dendra2/Dendra2 larva ( to 9 dpf) show the localization of the ApoB-Dendra2 signal to the circulatory system and YSL and later the liver. (B) Quantification of green fluorescence from images of apoBb.1Dendra2/Dendra2 and apoBb.1Dendra2/+ rise during the first days of development and then fall off to near background levels at 7 dpf. Plotted values reflect the mean of fluorescence after subtraction of the background values of apoBb.1+/+ animals. ApoBb.1Dendra2/+ shows half as much fluorescent intensity. Since these animals were not exposed to UV light, no red-state ApoB-Dendra2 is detected. Three independent experiments, n = 15. Scale bar 1 mm.
Figure 2:
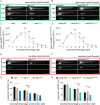
Figure 2:. Prolonged UV exposure intensity and/or time increase photoconversion efficiency of ApoB-Dendra2 in larval zebrafish.
(A) Photoconversion of ApoB-Dendra2 of 10 s leads to detectable red-state ApoB-Dendra2 levels, which can be increased by prolonged exposure. Representative image of a 3 dpf larva exposed to 2 mW/mm2 of UV light. (B) Green-state ApoB-Dendra2 continues to diminish as UV light exposure continues. Representative image of the same larva shown in (A) was obtained by using the green emission filters. (C) The intensity values of red-state ApoB-Dendra2 are plotted as the mean of all imaged larvae, allowing quantification of photoconversion efficiency. Exposure to 0.5 mW/mm2 of UV light intensity reduces the photoconversion efficiency. (D) Green-state ApoB-Dendra2 is plotted against time, showing a stronger reduction of green fluorescence in 2 mW/mm2 of UV compared to 0.5 mW/mm2 of UV. Three independent experiments, each n = 5 of a single clutch, total n = 15. Scale bar 1 mm. When performing the experiment with heterozygous apoBb.1Dendra2/+ animals, photocon-version leads to a 4.1 ± 0.9 fold and 10.74 ± 2.5 fold increase (30 s of 0.5 mW/mm2 and 2mW/mm2, respectively) of the red-state ApoB-Dendra2 (Fig. S2A), which is 57 – 78 % less than obtained with apoBb.1Dendra2/Dendra2. All turnover assays were performed using a 30 s UV exposure at 2 mW/mm2 and homozygous apoBb.1Dendra2/Dendra2 animals since these parameters resulted in effective photoconversion while not negatively affecting larval health.
Figure 3:
Figure 3:. B-lp half-life becomes faster during larval development and is equivalent between heterozygous and homozygous LipoTimer animals.
(A) Red-state ApoB-Dendra2 of the larva (4 dpf) increases drastically after photoconversion and diminishes over the course of 72 hrs, as seen in example images of the same animal taken on consecutive days in the red emission channel. (B) The total red-state fluorescent values obtained by quantifying the images with FIJI are plotted and graphed using Prism software. A trend line was fitted to a second-order polynomial equation to calculate the half-life of the red-state ApoB-Dendra2 of each individual larva. (C) Over the course of development, B-lp half-life accelerates from 2 to 5 dpf. Calculation of B-lp half-life in heterozygous and homozygous apoBb.1Dendra2 animals showed no difference between genotypes by Mann-Whitney test. Three independent experiments, n = 7 – 15. Scale bar 1 mm.
Figure 4:
Figure 4:. Ldlra and apoC2 mutants have more B-lps starting at 5 dpf and show significantly slower B-lp turnover.
Representative images of green-state ApoB-Dendra2 in (A) ldlra+/+ and ldlrasd52/sd52 and (B) apoC2+/+ and apoC2sd38/sd38 larva clearly show the increase in green-state ApoB-Dendra2. Quantification of green-state ApoB-Dendra2 levels in (C) ldlra and (D) apoC2 mutants reveal significantly higher levels of B-lps in the mutants compared to their wild type siblings. 2-Way ANOVA followed by Tukey’s multiple comparisons test; significances as follows a: wild type vs. heterozygous p < 0.01; b: wild type vs. mutant p < 0.01; c: wild type vs. heterozygous p < 0.0001; d: wild type vs. mutant p < 0.0001; e: heterozygous vs. mutant p < 0.0001; f: wild type vs. heterozygous p < 0.05; g: heterozygous vs. mutant p < 0.001; h: wild type vs. mutant p < 0.05. Three independent experiments, n = 6 – 22 (ldlra), n = 7 – 31 (apoC2). Representative images of (E) ldlra and (F) apoC2 mutants and their wild type siblings that were converted at 4 dpf and imaged on consecutive days. The persistence of the red-state ApoB-Dendra2 is apparent, and when quantified, the B-lp half-life in (G) ldlra and (H) apoC2 mutants is significantly longer. Welch’s ANOVA, Dune’s T3 multiple comparison test; significances as follows *: p < 0.05; ***: p < 0.001; ****: p < 0.0001. Three independent experiments, n = 5 – 28 (ldlra), n = 3 – 19 (apoC2). Scale bar 1 mm.
Figure 5:
Figure 5:. Mttp and pla2g12b mutants have less B-lps at 4 and 5 dpf and show significantly faster B-lp turnover.
(A) A mild reduction in overall green-state ApoB-Dendra2 can be seen at 5 dpf in mttpc655/c655 mutants compared to their mttp+/+ siblings. (B) At 4 dpf, the green-state ApoB-Dendra2 signal is more intense in the YSL of pla2g12bsa659/sa659 mutants than their pla2g12b+/+ siblings. Also, pla2g12bsa659/sa659 mutants have less overall green-state ApoB-Dendra2 in their circulation at 5 dpf compared to pla2g12b+/+ larva. Quantification of green-state ApoB-Dendra2 levels in (C) mttp and (D) pla2g12b mutants reveal significantly lower levels of B-lps in the mutants compared to their wild type siblings at 4 to 6 dpf. 2-Way ANOVA followed by Tukey’s multiple comparisons test; significances as follows a: wild type vs. mutant p < 0.0001; b: heterozygous vs. mutant p < 0.0001; c: wild type vs. mutant p < 0.01; d: wild type vs. mutant p < 0.001; e: heterozygous vs. mutant p < 0.001. Three independent experiments, n = 11 – 29 (mttp), n = 15 – 22 (pla2g12b). (E) Representative images of 4 dpf mttp+/+ and mttpc655/c655 larva showing a distinct reduction of red-state ApoB-Dendra2 in mttpc655/c665 with barely discernible fluorescent signal at 5 dpf. (F) Red-state ApoB-Dendra2 in pla2g12bsa659/sa659 is mildly reduced in mutants compared to their wild type siblings when converted at 4 dpf and imaged on consecutive days. The persistence of the red-state ApoB-Dendra2 in the YSL can be made out. When calculating the B-lp half-life of animals converted at 2, 3, or 4 dpf, (G) mttp mutants showed a shorter B-lp half-life at all days while (H) pla2g12b mutants only had significantly shorter B-lp half-life at 3 and 4 dpf of conversion. Welch’s ANOVA, Dune’s T3 multiple comparison test; significances as follows *: p < 0.05; **: p < 0.01; ***: p < 0.001; ****: p < 0.0001. Three independent experiments, n = 6 – 24 (mttp), n = 6 – 18 (pla2g12b). Scale bar 1 mm.
Figure 6:
Figure 6:. Circulating B-lps are turned over faster in mttp and pla2g12b mutants, which only produce small B-lps.
(A) Representative image of a 4 dpf larva imaged for red-state ApoB-Dendra2. The red circle indicates the area where fluorescence was measured to calculate the B-lp turnover of circulating B-lps, as explained by the circular insert. (B) Circulating B-lps show a shorter half-life in mttpc655/c655 mutants compared to their wild-type siblings when converted at 2, 3, or 4 dpf. (C) B-lp half-life was significantly shorter in pla2g12bsa659/sa659 compared to their wild-type siblings when converted at 3 and 4 dpf but not when converted at 2 dpf. Welch’s ANOVA, Dune’s T3 multiple comparison test; significances as follows *: p < 0.05; **: p < 0.01; ***: p < 0.001. Three independent experiments from Figure 5 were reanalyzed: n = 7 – 30 (mttp), n = 8 – 21 (pla2g12b). Scale bar 1 mm. (D) Representative LipoGlo-Electrophoresis at 3 and 7 dpf of wild type, ldlra, apoC2, mttp, and pla2g12b mutant larvae. At 3 dpf, ldlra mutants appear similar to wild types, while apoC2 mutants carry only large B-lps, and mttp and pla2g12b mutants only have small B-lps. At 7 dpf, wild-type animals have only a few remaining small B-lps, and ldlra mutants have many small B-lps left. ApoC2 mutants still exhibit only large B-lps, and mttp and pla2g12b mutants have such low numbers of B-lps that they cannot be detected on the assay. n = 2 from one clutch.
Figure 7:
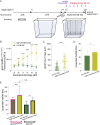
Figure 7:. Feeding a high-cholesterol diet increases circulating B-lp numbers and juvenile growth and prolongs B-lp half-life in wild-type animals, but not in apoC2 mutants.
(A) Schematic of feeding experiments: larvae are raised in dishes until they commence feeding in a 10 L tank on the recirculating system. After one day of feeding a Western diet, 15 dpf old juveniles are photo-converted and moved into playpens in 10 L tanks, receiving their respective experimental diet. (B) Feeding a high-cholesterol diet leads to significantly more circulating B-lps than the low-fat diet. ***: p = 0.0008, ****: p < 0.0001. 2way ANOVA followed by Šídák’s multiple comparisons test. (C) Juveniles fed a high-cholesterol diet exhibit more growth from day 1 to day 5 of the experimental feeding. ****: p < 0.0001. Mann-Whitney test. (D) Feeding a high cholesterol diet from 15 – 20 dpf leads a longer B-lp half-life in wild-type juveniles compared to siblings fed a low-fat diet. * p = 0.0227. Mann Whitney test. Three independent experiments, n(total) = 46–50 (E) apoC2 mutants fed the low-fat diet exhibit increased B-lp half-life compared to their wild-type and heterozygous siblings. ** p = 0.0082. However, there is no change in B-lp half-life in apoC2 mutants in response to the high-cholesterol diet, while wildtype and heterozygous siblings have a longer B-lp half-life on the high-cholesterol diet compared to the low-fat diet. ** p = 0.0026. Mann Whitney test. Three independent experiments, n(total) = 3–16.

Similar articles

  • Directly Measuring Atherogenic Lipoprotein Kinetics in Zebrafish With the Photoconvertible LipoTimer Reporter.
    Moll TOC, Kiefer JG, Klemek ML, Wilson MH, Farber SA. Moll TOC, et al. Arterioscler Thromb Vasc Biol. 2025 Aug 21. doi: 10.1161/ATVBAHA.125.322969. Online ahead of print. Arterioscler Thromb Vasc Biol. 2025. PMID: 40836916
  • Can a Liquid Biopsy Detect Circulating Tumor DNA With Low-passage Whole-genome Sequencing in Patients With a Sarcoma? A Pilot Evaluation.
    Anderson CJ, Yang H, Parsons J, Ahrens WA, Jagosky MH, Hsu JH, Patt JC, Kneisl JS, Steuerwald NM. Anderson CJ, et al. Clin Orthop Relat Res. 2025 Jan 1;483(1):39-48. doi: 10.1097/CORR.0000000000003161. Epub 2024 Jun 21. Clin Orthop Relat Res. 2025. PMID: 38905450
  • Prescription of Controlled Substances: Benefits and Risks.
    Preuss CV, Kalava A, King KC. Preuss CV, et al. 2025 Jul 6. In: StatPearls [Internet]. Treasure Island (FL): StatPearls Publishing; 2025 Jan–. 2025 Jul 6. In: StatPearls [Internet]. Treasure Island (FL): StatPearls Publishing; 2025 Jan–. PMID: 30726003 Free Books & Documents.
  • The Black Book of Psychotropic Dosing and Monitoring.
    DeBattista C, Schatzberg AF. DeBattista C, et al. Psychopharmacol Bull. 2024 Jul 8;54(3):8-59. Psychopharmacol Bull. 2024. PMID: 38993656 Free PMC article. Review.
  • The Effect of Endocrine Disorders on Lipids and Lipoproteins.
    Feingold KR. Feingold KR. 2023 Apr 6. In: Feingold KR, Ahmed SF, Anawalt B, Blackman MR, Boyce A, Chrousos G, Corpas E, de Herder WW, Dhatariya K, Dungan K, Hofland J, Kalra S, Kaltsas G, Kapoor N, Koch C, Kopp P, Korbonits M, Kovacs CS, Kuohung W, Laferrère B, Levy M, McGee EA, McLachlan R, Muzumdar R, Purnell J, Rey R, Sahay R, Shah AS, Singer F, Sperling MA, Stratakis CA, Trence DL, Wilson DP, editors. Endotext [Internet]. South Dartmouth (MA): MDText.com, Inc.; 2000–. 2023 Apr 6. In: Feingold KR, Ahmed SF, Anawalt B, Blackman MR, Boyce A, Chrousos G, Corpas E, de Herder WW, Dhatariya K, Dungan K, Hofland J, Kalra S, Kaltsas G, Kapoor N, Koch C, Kopp P, Korbonits M, Kovacs CS, Kuohung W, Laferrère B, Levy M, McGee EA, McLachlan R, Muzumdar R, Purnell J, Rey R, Sahay R, Shah AS, Singer F, Sperling MA, Stratakis CA, Trence DL, Wilson DP, editors. Endotext [Internet]. South Dartmouth (MA): MDText.com, Inc.; 2000–. PMID: 28121116 Free Books & Documents. Review.

References

    1. Feingold KR, Grunfeld C. Introduction to Lipids and Lipoproteins. In: Feingold KR, Anawalt B, Boyce A, Chrousos G, Dungan K, Grossman A, et al. , editors. Endotext. South Dartmouth (MA)2000.
    1. Palm W, Sampaio JL, Brankatschk M, Carvalho M, Mahmoud A, Shevchenko A, et al. Lipoproteins in Drosophila melanogaster—Assembly, Function, and Influence on Tissue Lipid Composition. PLOS Genetics. 2012;8(7):e1002828. - PMC - PubMed
    1. Schumaker VN, Phillips ML, Chatterton JE. Apolipoprotein B and low-density lipoprotein structure: implications for biosynthesis of triglyceride-rich lipoproteins. Adv Protein Chem. 1994;45:205–48. - PubMed
    1. Hussain MM, Kancha RK, Zhou Z, Luchoomun J, Zu H, Bakillah A. Chylomicron assembly and catabolism: role of apolipoproteins and receptors. Biochim Biophys Acta. 1996;1300(3):151–70. - PubMed
    1. Howard BV, Robbins DC, Sievers ML, Lee ET, Rhoades D, Devereux RB, et al. LDL cholesterol as a strong predictor of coronary heart disease in diabetic individuals with insulin resistance and low LDL: The Strong Heart Study. Arteriosclerosis, thrombosis, and vascular biology. 2000;20(3):830–5. - PubMed

Publication types