[Preprint]. 2024 May 31:rs.3.rs-4421613.
doi: 10.21203/rs.3.rs-4421613/v1.

Reduced Sialylation of Airway Mucin Impairs Mucus Transport by Altering the Biophysical Properties of Mucin

Affiliations

Reduced Sialylation of Airway Mucin Impairs Mucus Transport by Altering the Biophysical Properties of Mucin

Elex S Harris et al. Res Sq. .

Update in

Abstract

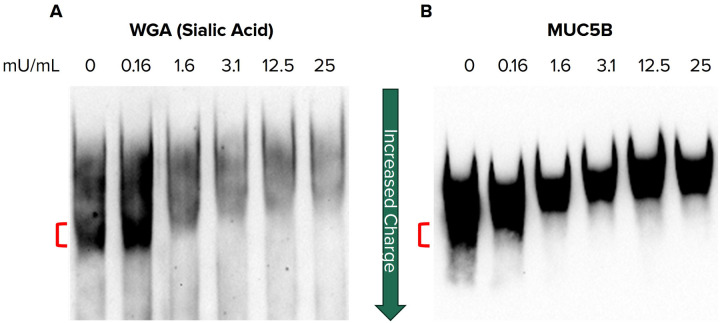
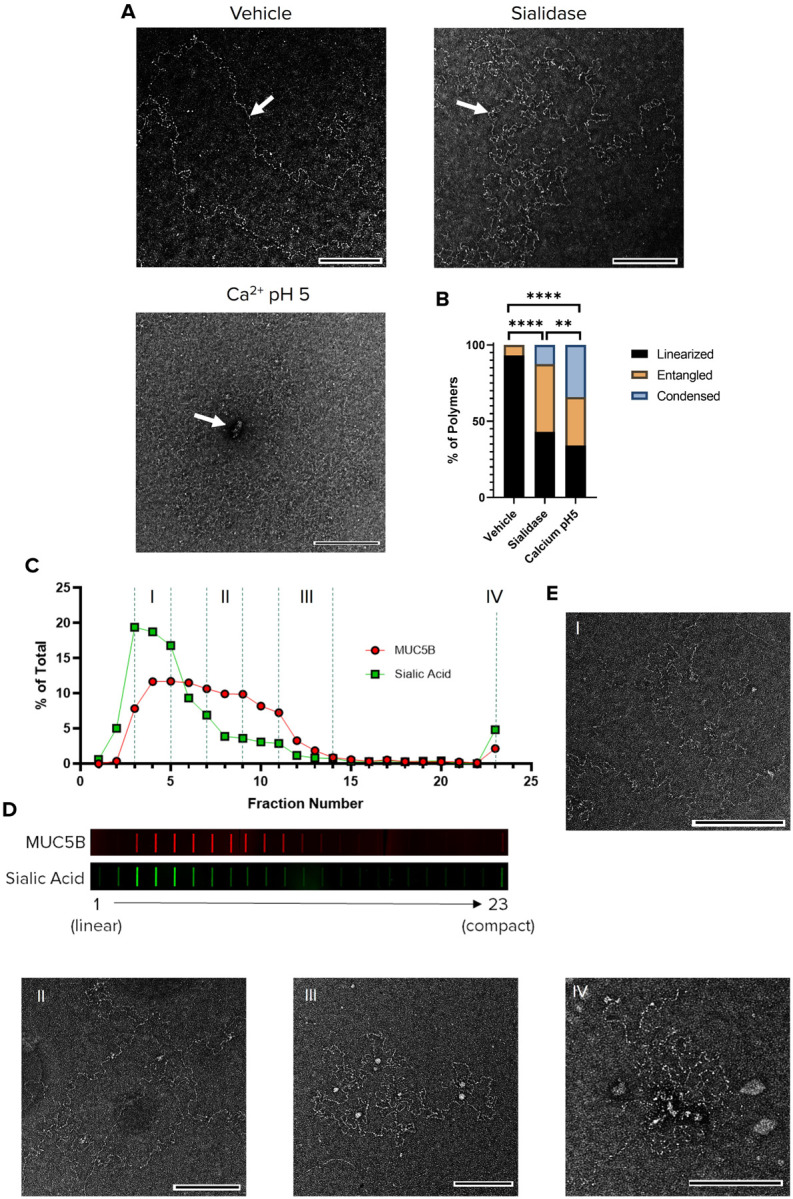
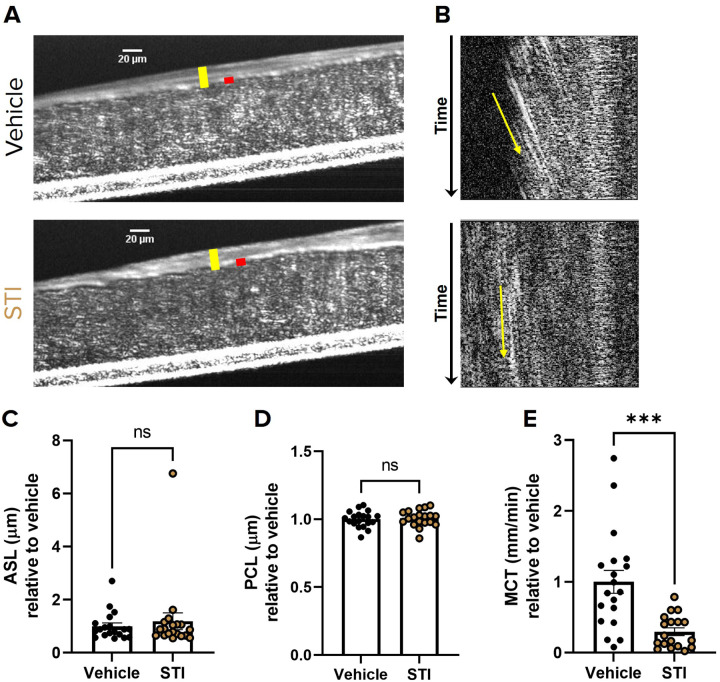
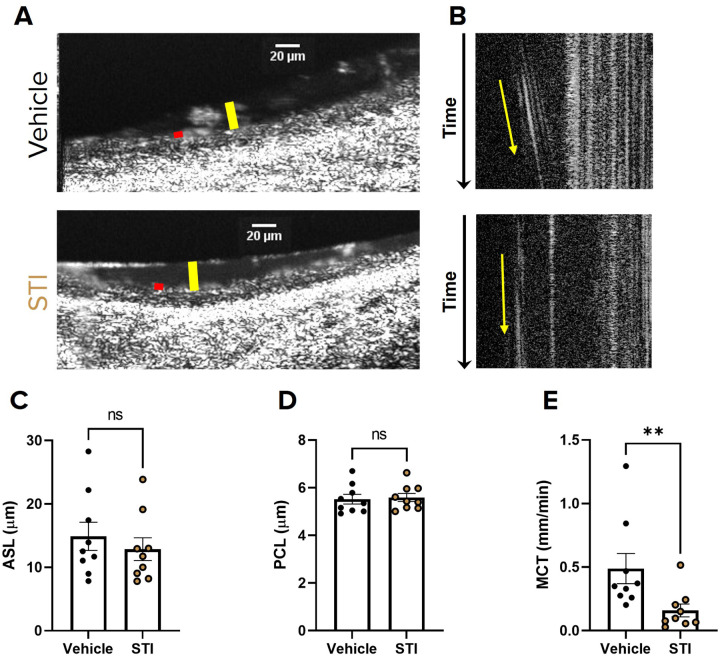
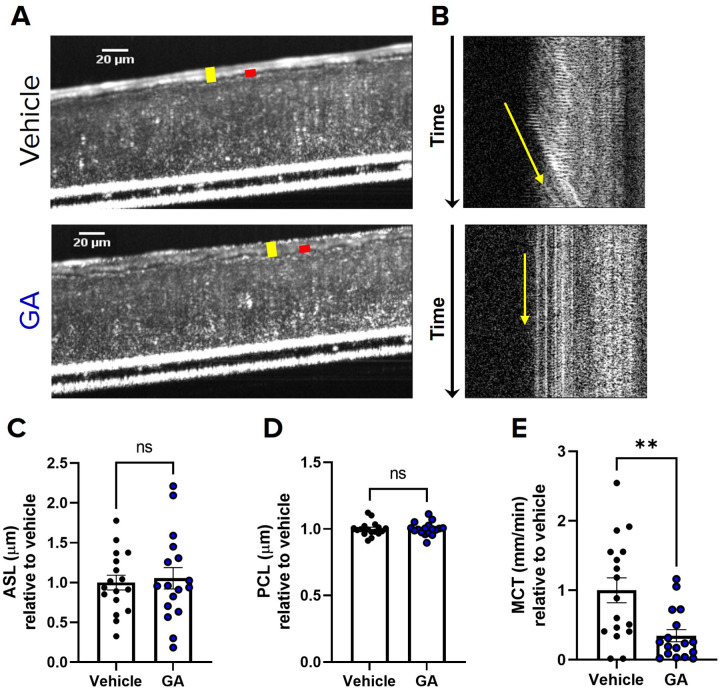
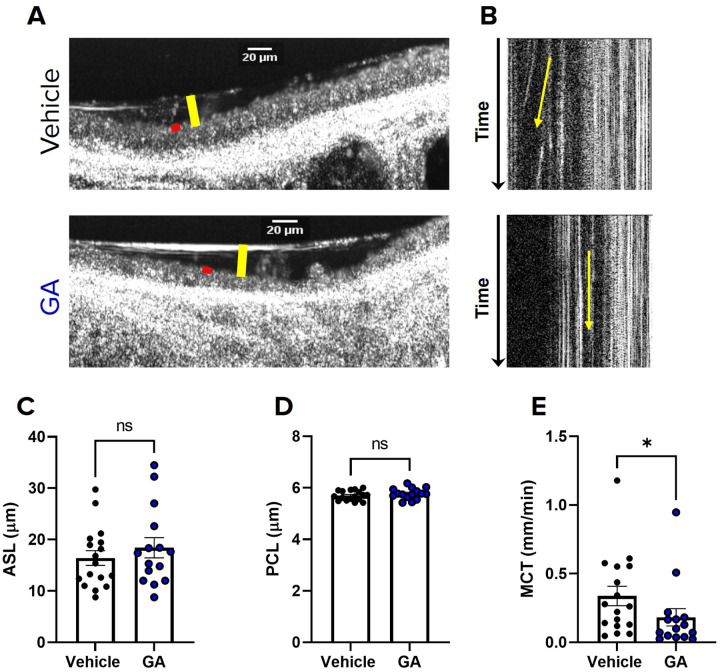
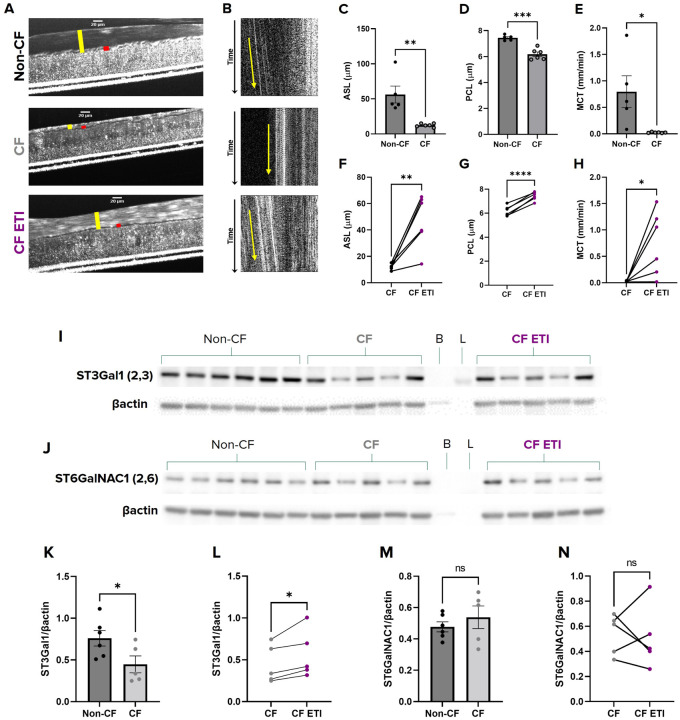
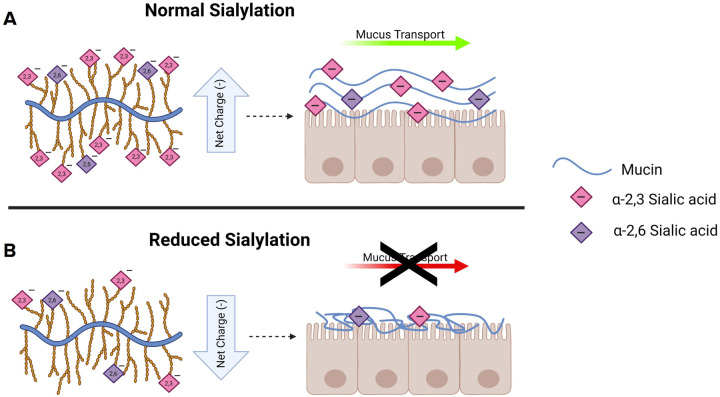
Mucus stasis is a pathologic hallmark of muco-obstructive diseases, including cystic fibrosis (CF). Mucins, the principal component of mucus, are extensively modified with hydroxyl (O)-linked glycans, which are largely terminated by sialic acid. Sialic acid is a negatively charged monosaccharide and contributes to the biochemical/biophysical properties of mucins. Reports suggest that mucin sialylation may be altered in CF; however, the consequences of reduced sialylation on mucus clearance have not been fully determined. Here, we investigated the consequences of reduced sialylation on the charge state and conformation of the most prominent airway mucin, MUC5B, and defined the functional consequences of reduced sialylation on mucociliary transport (MCT). Reduced sialylation contributed to a lower charged MUC5B form and decreased polymer expansion. The inhibition of total mucin sialylation de novo impaired MCT in primary human bronchial epithelial cells and rat airways, and specific α-2,3 sialylation blockade was sufficient to recapitulate these findings. Finally, we show that ST3 beta-galactoside alpha-2,3-sialyltransferase (ST3Gal1) expression is downregulated in CF and partially restored by correcting CFTR via Elexacaftor/Tezacaftor/Ivacaftor treatment. Overall, this study demonstrates the importance of mucin sialylation in mucus clearance and identifies decreased sialylation by ST3Gal1 as a possible therapeutic target in CF and potentially other muco-obstructive diseases.


Conflict of interest statement

Conflict of Interest: The authors have declared that no conflict of interest exists.

Figures

Figure 1
Figure 1. Reducing the sialylation of secreted mucin contributes to a low charge form of MUC5B
Agarose-PAGE western blots of partially purified mucin from non-CF HBEC secretions. Mucin was treated with increasing concentrations of neuraminidase, ranging from 0 to 25mu/mL, to remove sialic acid and separated by gel electrophoresis before being probed for (A) sialic acid (WGA) and (B)MUC5B. The faster migrating/highest charged species (red bar) disappears as sialic acid is increasingly removed. The gel mobility of MUC5B is decreased as sialic acid is removed indicating a decrease in charge.
Figure 2
Figure 2. Reducing Sialylation of MUC5B Impairs Mucin Linearization
(A-B) Natively purified MUC5B was treated with either vehicle or sialidase at pH 7.4 or 10mM CaCl2 at a pH of 5. 10mM EGTA at pH 7.4 was added to vehicle and sialidase groups prior to ON incubation at 4°C. MUC5B polymers were subsequently visualized by negative stain TEM. (A) representative TEM images of MUC5B polymers treated with either vehicle, sialidase, or calcium CaCl2/pH 5. Imaging was performed to capture 72–85 polymers per group (vehicle, N=73; sialidase, N=72; and 10mM CaCl2/pH 5, N=85). After blinding, polymers were counted and categorized into 3 groups for each condition: linear, entangled, or condensed. White arrows indicate a linearized polymer in the vehicle group, an entangled polymer in the sialidase group, and a condensed polymer in the CaCl2/pH 5 group. (B) Quantification showing the percentage total polymers that were linear, entangled, or condensed for each group. N=72–85 per group. **P<0.01, ****P<0.0001 by Chi Square. Scale bars, 200 nm. (C-D) Untreated MUC5B was separated on 10–35% Sucrose gradient by rate zonal centrifugation to separate MUC5B by shape; more compact mucins sediment faster. Gradient fractions were slot blotted and probed for MUC5B and sialic acid content. (C) Intensities were quantified as a percentage of whole for both MUC5B and sialic acid. (D) Representative slot blots of MUC5B and sialic acid, showing a higher percentage of sialic acid content compared to MUC5B in the early (more linear) fractions. (E) Fractions were pooled to represent 4 different sedimentation rates across the gradient and imaged via TEM. Scale bars, 200 nm.
Figure 3
Figure 3. Sialyltransferase inhibition impairs mucociliary transport in primary HBECs
(A) Representative μOCT images of HBECs treated with either vehicle or 200 μM STI demonstrate no differences in ASL (yellow bar) or PCL (red bar). (B) Reprocessed M-mode (e.g., x vs time) μOCT images show tracks of mucus particles above the epithelial surface of HBECs treated with vehicle or 200 μM STI; the more horizontal direction of particle streaks (yellow arrow) indicates more rapid transport. Summary data shows the effect of STI on (C) ASL and (D) PCL depths and (E)MCT. Regions of interest were measured and averaged for each HBEC filter. N=18–19/condition, representing 3 donors. Measurements were normalized to vehicle for each donor. nsP>0.05, ***P<0.001 by unpaired T-test or Mann-Whitney. Scale bars, 20μm.
Figure 4
Figure 4. Sialyltransferase inhibition impairs mucociliary transport in rat tracheae
(A) Representative μOCT images of excised WT rat tracheae from rats, treated with either PBS vehicle or 500 μM STI by intratracheal instillation daily for 7 days, demonstrate no differences in ASL (yellow bar) or PCL (red bar). (B) Reprocessed M-mode (e.g., x vs time) μOCT images show tracks of mucus particles above the epithelial surface of rat tracheae treated with vehicle or 500 μM STI; the more horizontal direction of particle streaks (yellow arrow) indicates more rapid transport. Summary data shows the effect of STI on (C) ASL and (D)PCL depths and (E) MCT. Regions of interest were measured and averaged for each trachea. N=9/condition. nsP>0.05, **P<0.01 by unpaired T-test or Mann-Whitney. Scale bars, 20μm.
Figure 5
Figure 5. α−2,3 sialyltransferase inhibition alone is sufficient to impair mucociliary transport in HBECs
(A) Representative μOCT images of HBECs treated with either vehicle or 120 μM GA demonstrate no differences in ASL (yellow bar) or PCL (red bar). (B) Reprocessed M-mode (e.g., x vs time) μOCT images show tracks of mucus particles above the epithelial surface of HBECs treated with vehicle or 120 μM GA; the more horizontal direction of particle streaks (yellow arrow) indicates more rapid transport. Summary data shows the effect of GA on (C) ASL and (D) PCL depths and (E)MCT. Regions of interest were measured and averaged for each HBEC filter. N=17/condition, representing 3 donors. Measurements were normalized to vehicle for each donor. nsP>0.05, **P<0.01 by unpaired T-test or Mann-Whitney. Scale bars, 20μm.
Figure 6
Figure 6. α−2,3 sialyltransferase inhibition alone is sufficient to impair mucociliary transport in trachea
(A) Representative μOCT images of excised WT rat tracheae from rats, treated with either PBS vehicle or 300 μM GA by intratracheal instillation daily for 7 days, demonstrate no differences in ASL (yellow bar) or PCL (red bar). (B) Reprocessed M-mode (e.g., x vs time) μOCT images show tracks of mucus particles above the epithelial surface of rat tracheae treated with vehicle or 300 μM GA; the more horizontal direction of particle streaks (yellow arrow) indicates more rapid transport. Summary data shows the effect of GA on (C) ASL and (D) PCL depths and (E)MCT. Regions of interest were measured and averaged for each trachea. N=15–17/condition. nsP>0.05, *P<0.05 by unpaired T-test or Mann-Whitney. Scale bars, 20μm.
Figure 7
Figure 7. MCT and ST3Gal1 expression are decreased in CF and increased with CFTR modulation in HBECs
(A) Representative μOCT images of non-CF HBECs treated with vehicle and CF HBECs treated with either vehicle or ETI triple modulators for 72hrs demonstrate decreased ASL (yellow bar) and PCL (red bar) in CF HBECs that were increased with ETI treatment. (B) Reprocessed M-mode (e.g., x vs time) μOCT images show tracks of mucus particles above the epithelial surface of non-CF HBECs treated with vehicle and CF HBECs treated with vehicle or ETI modulators; the more horizontal direction of particle streaks (yellow arrow) indicates more rapid transport. Summary data shows the differences in (C) ASL and (D) PCL depths and (E) MCT between non-CF and CF and (F-H) CF after ETI correction. Regions of interest from 4 different filters were measured and averaged for each HBEC donor. (I) Representative western blot of cell lysates probed for ST3Gal1 from non-CF HBECs treated with vehicle and CF HBECs treated with either vehicle or ETI triple modulators for 72hrs, demonstrate decreased expression of ST3Gal1 in CF HBECs that was partially restored after ETI treatment. (J)Representative western blot of cell lysates probed for ST6GalNAC1 from non-CF HBECs treated with vehicle and CF HBECs treated with either vehicle or ETI triple modulators for 72hrs, demonstrate no differences in expression of ST6GalNAC1. Quantification by densitometry of ST3Gal1 expression showing (K)a significant decrease in ST3Gal1 expression in CF HBECs compared to non-CF and (L) an increase in paired ETI treated CF HBECs. Quantification by densitometry of ST6GalNAC1 expression showing no differences in ST6GalNAC1 expression between (M) non-CF and CF or (N) paired ETI treated CF HBECs. N=5–6 donors/condition. nsP>0.05, *P<0.05, **P<0.01 by unpaired or paired T-test as appropriate. Scale bars, 20μm. Densitometry is presented normalized to βactin.
Figure 8
Figure 8. The consequences of reduced sialylation on mucus physiology
(A) Under normal conditions, gel-forming mucins are heavily sialylated on the terminus of their glycan chains. This sialylation produces a high negative charge density across the mucin backbone. These negative charges promote mucin expansion and linearization through charge repulsion of neighboring sialic acids within and across mucin polymers. This promotes the formation of a normal mucin network and facilitates mucus transport. (B) When the level of sialylation is reduced, the net charge across the mucin backbone is also reduced. The charge deficit ameliorates the repulsive forces within and between mucin polymers and results in less linear, more entangled mucins. This results in an aberrant mucin network and ultimately impairs mucus transport.

Similar articles

References

    1. Rowe SM, Miller S, Sorscher EJ. Cystic fibrosis. N Engl J Med. 2005;352(19):1992–2001. - PubMed
    1. Fahy JV, Dickey BF. Airway mucus function and dysfunction. N Engl J Med. 2010;363(23):2233–47. - PMC - PubMed
    1. Boucher RC. Muco-Obstructive Lung Diseases. N Engl J Med. 2019;380(20):1941–53. - PubMed
    1. Morrison CB, Markovetz MR, Ehre C. Mucus, mucins, and cystic fibrosis. Pediatr Pulmonol. 2019;54 Suppl 3(Suppl 3):S84–S96. - PMC - PubMed
    1. Ridley C, Thornton DJ. Mucins: the frontline defence of the lung. Biochem Soc Trans. 2018;46(5):1099–106. - PMC - PubMed

Publication types

LinkOut - more resources