[Preprint]. 2025 May 15:2024.06.01.596974.
doi: 10.1101/2024.06.01.596974.

An Unbiased Proteomic Platform for ATE1-based Arginylation Profiling

Affiliations

An Unbiased Proteomic Platform for ATE1-based Arginylation Profiling

Zongtao Lin et al. bioRxiv. .

Update in

  • An unbiased proteomic platform for ATE1-based arginylation profiling.
    Lin Z, Xie Y, Gongora J, Liu X, Zahn E, Palai BB, Ramirez DH, Searfoss RM, Vitorino FN, Karki R, Dann GP, Zhao C, Han X, MacTaggart B, Lan X, Fu D, Greenberg L, Zhang Y, Lavine KJ, Greenberg MJ, Lv D, Kashina A, Garcia BA. Lin Z, et al. Nat Chem Biol. 2025 Aug 25. doi: 10.1038/s41589-025-01996-z. Online ahead of print. Nat Chem Biol. 2025. PMID: 40855110

Abstract

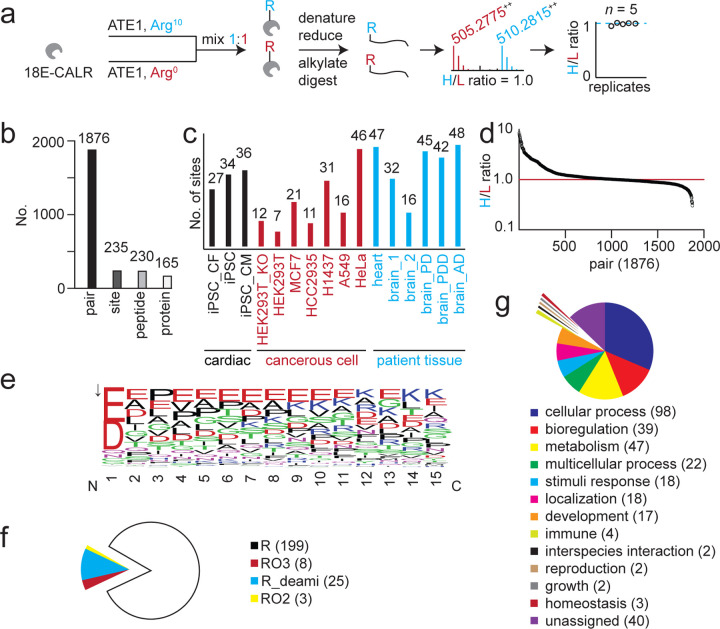
Protein arginylation is an essential posttranslational modification (PTM) catalyzed by arginyl-tRNA-protein transferase 1 (ATE1) in mammalian systems. Arginylation features a post-translational conjugation of an arginyl to a protein, making it extremely challenging to differentiate from translational arginine residues with the same mass in a protein sequence. Here we present a general ATE1-based arginylation profiling platform for the unbiased discovery of arginylation substrates and their precise modification sites. This method integrates isotopic arginine labeling into an ATE1 assay utilizing biological lysates (ex vivo) rather than live cells, thus eliminating translational bias derived from the ribosomal activity and enabling bona fide arginylation identification using isotopic features. The method has been successfully applied to an array of peptide, protein, cell, patient, and animal tissue samples using 20 μg sample input, with 235 unique arginylation sites revealed from human proteomes. Representative sites were validated and followed up for their biological functions. The developed platform is globally applicable to the aforementioned sample types and therefore paves the way for functional studies of this difficult-to-characterize protein modification.

Keywords: arginylation; arginyltransferase; posttranslational modification; protein profiling; proteomics.


Conflict of interest statement

Competing interests Z.L., D.L., and B.A.G. are co-founders of LasNova Therapeutics, LLC.

Figures

Figure 1.
Figure 1.. Isotopic arginine labeling and detection strategy for ATE1 substrates and arginylation sites.
a, scheme of arginyl installation onto proteins by ribosomal synthesis (translational) and ATE1 (post-translational). RARS, arginine-tRNA ligase. ATE1, arginyl-tRNA-protein transferase 1. b, arginylation profiling platform for arginylation site and substrate discovery from biological samples. Lysate is labeled by isotopic arginine molecules (Arg10 and Arg0) respectively using ATE1 assay, mixed, and digested. Peptides are fractionated and analyzed by mass spectrometry in data-dependent acquisition (DDA) mode. Proteomics data is searched to produce peptide identifications (IDs), among which peptide pairs modified by heavy and light Arg are further evaluated for MS1 isotopic features. c, isotopic arginylation of a peptide ATE1 substrate. EICs were extracted using monoisotopic peaks based on calculated m/z values. EIC in black indicates chromatography of the unmodified peptide. d, isotopic feature in MS1 spectra and their summary. The first monoisotopic peak in each MS1 scan is set at 1 for normalization. Relative intensities of other isotopic peaks are displayed. 10-ppm error is set for all MS1 isotopic peaks. e, ratio summary of MS1 pairs in 4 replicates (n = 4) using doublet, quartet, and sextet peaks. Detailed ratios from the replicates are provided. The numbers of pairs in quartet and sextet are normalized to the numbers of pairs in doublet from respective replicate. EIC: extracted ion chromatogram. Nle: norleucine.
Figure 2.
Figure 2.. Arginylation analysis of whole-proteome peptides using in-house software.
a, software flowchart of customized “ArginylomePlot”. Input data are mzXML and peptide identification files. Output data are MS1, MS2, and the summary of unbiased arginylation sites. b, experimental workflow for arginylation of tryptic peptides from HEK293T (ATE1 KO) cells. c, numbers of identified MS1 pairs, arginylation sites, unique peptides, and unique proteins. d, H/L ratio distribution of all MS1 pairs and their corresponding numbers of MS1 scans (doublets, error ⩽ 10 ppm). The retention times of peptide IDs belonging to a pair were averaged. The software will extract matching MS1 scans within 1.25 min (± 1.25 min) of the averaged retention times. e, analysis of the N-terminal residues of all unique arginylated peptides. Q is arginylated after deamidation (Q→E). f, sequence logo calculated from unmodified forms of all unique arginylated peptides. The frequency plot is generated by WebLogo. The peptide sequences were aligned and extended to include 14 positions downstream of the arginylation sites as the P1’ position. g, comparison of tryptic and non-tryptic N-term of all arginylated peptides. Non-tryptic N-term may indicate endogenously exposed N-termini of proteins.
Figure 3.
Figure 3.. Summary of arginylation sites and ATE1 substrates in human proteins and proteomes.
a, experimental workflow for CALR arginylation. b, numbers of identified MS1 pairs, arginylation sites, unique peptides and unique proteins in human cells and patient tissues. c, overview of arginylation sites in human cells and patient tissues. d, ratio plot of all MS1 pairs detected in all sample fractions. e, sequence logo calculated from unmodified forms of all unique arginylated peptides. Frequency plots are generated by WebLogo. The arrow indicates the cleavage site before arginylation. f, arginylation type comparison of all unique sites. g, biological function analysis of ATE1 protein substrates using PANTHER. iPSC, induced pluripotent stem cell. CF, cardiac fibroblasts. CM, cardiomyocytes. R, arginylation. RO3, Cys tri-oxidation and arginylation. RO2, Cys di-oxidation and arginylation. R_deami, N/Q arginylation after deamidation. PD, Parkinson’s disease. PDD, PD with dementia. AD, Alzheimer’s disease.
Figure 4.
Figure 4.. Validation of representative arginylation sites.
a, synthetic peptide validation of 7 arginylation sites. b, representative MS2 spectra indicating RM12 arginylation on Cys45 with tri-oxidation (C45 RO3). c, open E24 in ERO1A and E17 in SSBP are arginylated in an in-bacteria arginylation system. Protein and ATE1 are co-expressed in E. coli for in-bacteria arginylation. The protein was purified and digested for proteomics analysis. d, arginylation dependency of CALR, ERO1A, and SSBP sites on endogenous ATE1. Anti-ATE1 was used to detect the expression of endogenous ATE1. β-tubulin was used as a loading control. Anti-FLAG antibody was used to detect expressions of CALR, ERO1A, and SSBP proteins. Extracted ion chromatograms (EICs) of arginylated peptide in each protein in WT and KO cells after pulldown and proteomics are provided. e, relative arginylation levels of CALR, ERO1A, and SSBP sites after co-overexpression of ATE1. Protein was purified by antibody pulldown experiment followed by proteomics analysis. Peak areas of arginylated peptides were normalized to the sample with the highest signal and relative ratios are displayed. Different amounts (0, 0.5, and 1 μg) of ATE1 plasmids were used for transfection. β-tubulin was used as a loading control. Anti-FLAG antibody was used to detect expressions of CALR, ERO1A, and SSBP proteins. std, standard peptide. KO, ATE1 KO. R, arginylation.
Figure 5.
Figure 5.. Biological functions of representative arginylation sites.
a, imaging of ERO1A and 24R-ERO1A compared with ER marker and co-overexpressed PDI. b, expression levels of cytosolic ERO1A species in CHX chase experiment. c, imaging of SSBP and 17R-SSBP compared with mitochondria protein COX4. d, bioenergetic profiles of HEK293T cells after SSBP and 17R-SSBP transfection measured by Seahorse XF24. Mitochondria respiration was analyzed with basal respiration, ATP production, proton leak, maximal respiration, spare capacity, and non-mitochondria respiration. The average values of 3 Seahorse measurements were used for comparison.
Figure 6.
Figure 6.. Design and flowchart of the arginylation database and its website.
Arginylation data are from peptides, whole-proteome peptides, proteins, human proteomes, and mouse proteomes. Visualization includes isotopic ratios and annotated isotopic MS1 and MS2 spectra. All indexed MS1 and MS2 scans are accessible to the public to download. A dashed arrow means a one-to-multiple inclusion relationship.

References

    1. Kwon Y. T., Kashina A. S., Davydov I. V., Hu R. G., An J. Y., Seo J. W., Du F. & Varshavsky A. An essential role of N-terminal arginylation in cardiovascular development. Science 297, 96–99, (2002). - PubMed
    1. Lian L., Suzuki A., Hayes V., Saha S., Han X., Xu T., Yates J. R. 3rd, Poncz M., Kashina A. & Abrams C. S. Loss of ATE1-mediated arginylation leads to impaired platelet myosin phosphorylation, clot retraction, and in vivo thrombosis formation. Haematologica 99, 554–560, (2014). - PMC - PubMed
    1. Kurosaka S., Leu N. A., Pavlov I., Han X., Ribeiro P. A., Xu T., Bunte R., Saha S., Wang J., Cornachione A., Mai W., Yates J. R. 3rd, Rassier D. E. & Kashina A. Arginylation regulates myofibrils to maintain heart function and prevent dilated cardiomyopathy. J Mol Cell Cardiol 53, 333–341, (2012). - PMC - PubMed
    1. Singh K., Gupta A., Sarkar A., Gupta I., Rana S., Sarkar S. & Khan S. Arginyltransferase knockdown attenuates cardiac hypertrophy and fibrosis through TAK1-JNK1/2 pathway. Sci Rep 10, 598, (2020). - PMC - PubMed
    1. Kurosaka S., Leu N. A., Zhang F., Bunte R., Saha S., Wang J., Guo C., He W. & Kashina A. Arginylation-dependent neural crest cell migration is essential for mouse development. PLoS Genet 6, e1000878, (2010). - PMC - PubMed

Publication types