[Preprint]. 2024 May 30:rs.3.rs-4432372.
doi: 10.21203/rs.3.rs-4432372/v1.

Limited Immunogenicity of an HLA-A*03:01-restricted Epitope of Erv-k-env in Non-hiv-1 Settings: Implications for Adoptive Cell Therapy in Cancer

Affiliations

Limited Immunogenicity of an HLA-A*03:01-restricted Epitope of Erv-k-env in Non-hiv-1 Settings: Implications for Adoptive Cell Therapy in Cancer

Erin E Grundy et al. Res Sq. .

Update in

Abstract

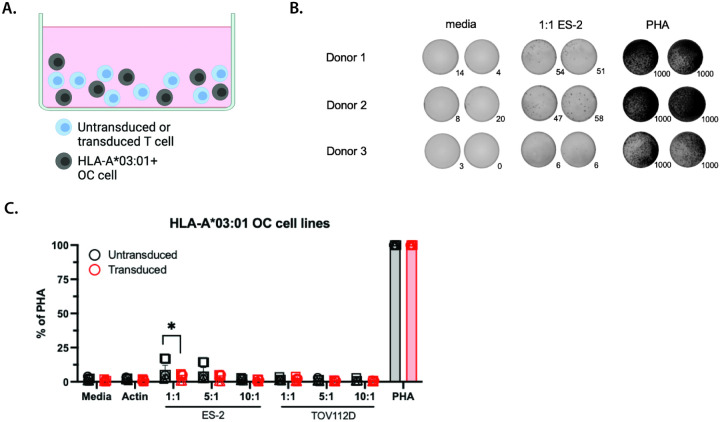
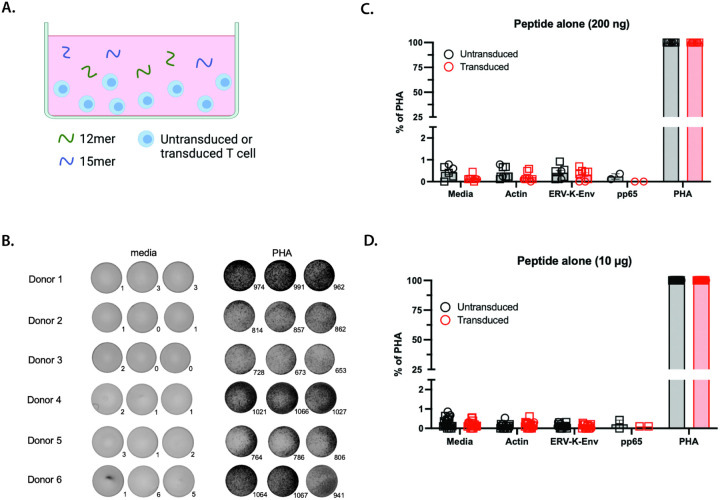
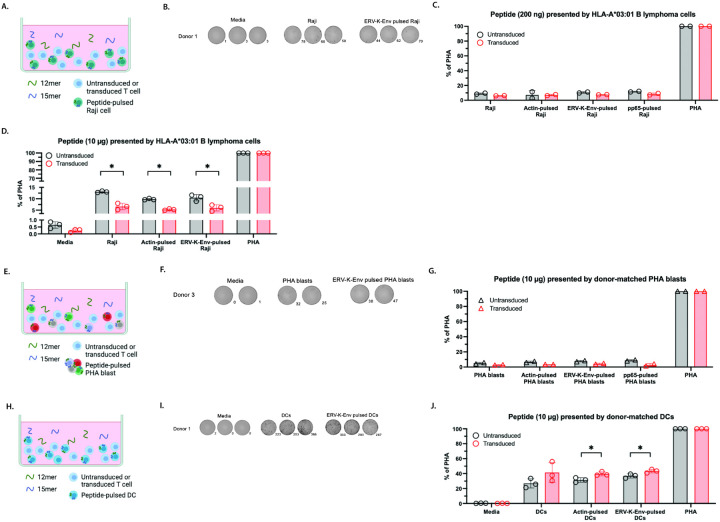
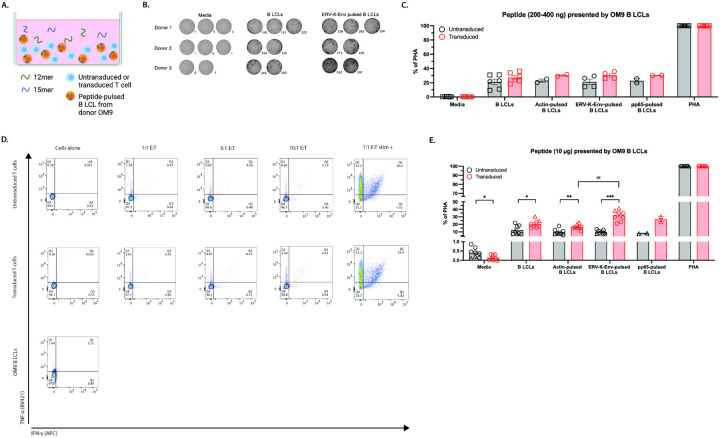
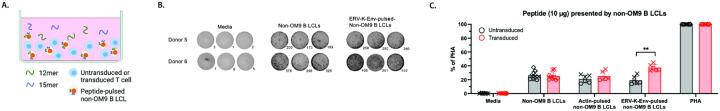
Repetitive elements (REs) are often expressed at higher levels in tumor cells than normal cells, implicating these genomic regions as an untapped pool of tumor-associated antigens. In ovarian cancer (OC), protein from the RE ERV-K is frequently expressed by tumor cells. Here we determined whether the targeting of a previously identified immunogenic epitope in the envelope gene (env) of ERV-K resulted in target antigen specificity in non-HIV-1 settings. We found that transducing healthy donor T cells with an ERV-K-Env-specific T cell receptor construct resulted in antigen specificity only when co-cultured with HLA-A*03:01 B lymphoblastoid cells. Furthermore, these transduced T cells were not specific for HLA-A*03:01 + OC cells nor for the cognate peptide in HLA-matched systems from multiple healthy donors. These data suggest that the ERV-K-Env epitope recognized by this T cell receptor is of low immunogenicity and has limited potential as a T cell target for OC.

Keywords: Endogenous retroviruses; Immunotherapy; Repetitive elements; T cell receptor; Tumor immunology.


Conflict of interest statement

Additional Declarations: Competing interest reported. Erin E. Grundy: no such conflicts exist Lauren C. Shaw: no such conflicts exist Daniel J. Powell Jr.: no such conflicts exist Mario Ostrowski: no such conflicts exist R. Brad Jones: no such conflicts exist C. Russell Y. Cruz: no such conflicts exist Heather Gordish-Dressman: no such conflicts exist Catherine M. Bollard: no such conflicts exist Katherine B. Chiappinelli: consultant for Rome Therapeutics DISCLOSURES & COMPETING INTERESTS KBC is a consultant for Rome Therapeutics.

Figures

Figure 1
Figure 1. OM9.2 T cells did not respond to HLA-A*03:01 OC cells more than untransduced T cells.
A. Diagram of the ELISpot assay design used in B-C. B. Representative images of developed wells for the level of background IFN-γ secretion (media), IFN-γ secretion in the presence of ES-2 cells (1:1 ES-2), and positive control of IFN-γ (PHA) for the ELISpot assay quantified in C. Number of spots in each well are indicated to the bottom right of each image. Images shown are for OM9.2 T cells. C. Number of IFN-γspots per well normalized to the positive control (expressed as % of PHA) of untransduced T cells (black) and OM9.2 T cells (red) for the indicated conditions: media = background level of IFN-γ secretion from T cells, actin = negative control, various effector:target ratios of T cells (effectors) with HLA-A*03:01 OC cell lines (targets), PHA = positive control. Each donor is indicated by a different symbol. ELISpot conditions were plated in duplicate or triplicate as cell numbers allowed for n = 3 donors. Error bars represent SEM of all data points for all donors. The Wilcoxon rank sum test was used to compare the number of IFN-γ spots between untransduced and transduced T cells (indicated by *). The Kruskal Wallis test was used to compare the number of IFN-γ spots between each antigen condition for untransduced or transduced cells. Any Kruskal Wallis test that had p < 0.05 was followed by post-hoc pairwise Wilcoxon rank sum tests and adjusted for multiple comparisons (indicated by #). All statistical comparisons are in Tables S1 and S2. *p < 0.05, **p < 0.005, ***p < 0.0005. ELISpot = Enzyme-linked immunosorbent spot; PHA = phytohemagglutinin; OC = ovarian cancer; SEM = standard error of the mean.
Figure 2
Figure 2. OM9.2 T cells were not activated by free ERV-K-Env peptide.
A. Diagram of the ELISpot assay design used in B-D. B. Representative images of developed wells for the level of background IFN-γ secretion (media) and positive control of IFN-γ(PHA) for the ELISpot assays quantified in C-D. Number of spots in each well are indicated to the bottom right of each image. Images shown are for OM9.2 T cells. C-D. Number of IFN-γ spots per well normalized to the positive control (expressed as % of PHA) of untransduced T cells (black) and OM9.2 T cells (red) for the indicated conditions: media = background level of IFN-γ secretion from T cells, actin = negative control, ERV-K-Env = ERV-K-Env peptide, pp65 = HLA-B*35 off-target control, PHA = positive control. Each donor is indicated by a different symbol. ELISpot conditions were plated with the indicated peptide concentrations in duplicate or triplicate as cell numbers allowed at 200 ng for n = 2 donors (C) or at 10 μg for n = 6 donors (D). Error bars represent SEM of all data points for all donors. The Wilcoxon rank sum test was used to compare the number of IFN-γ spots between untransduced and transduced T cells (indicated by *). The Kruskal Wallis test was used to compare the number of IFN-γ spots between each antigen condition for untransduced or transduced cells. Any Kruskal Wallis test that had p < 0.05 was followed by post-hoc pairwise Wilcoxon rank sum tests and adjusted for multiple comparisons (indicated by #). All statistical comparisons are in Tables S1 and S2. *p < 0.05, **p < 0.005, ***p < 0.0005. ELISpot = Enzyme-linked immunosorbent spot; PHA = phytohemagglutinin; SEM = standard error of the mean.
Figure 3
Figure 3. OM9.2 T cells were not activated by the ERV-K-Env peptide when presented by peptide-pulsed APCs.
A, E, H. Diagrams of the ELISpot assay designs used in B-D, F-G, and I-J, respectively. B, F, I. Representative images of developed wells for OM9.2 T cell levels of background IFN-γ secretion (media) and IFN-γ secretion in the presence of unpulsed APCs and ERV-K-Env-pulsed APCs for the ELISpot assays quantified in C-D, G, and J, respectively. Spot numbers are indicated to the bottom right of each image. C-D, G, J. Number of IFN-γ spots per well normalized to the positive control (expressed as % of PHA) of untransduced T cells (black) and OM9.2 T cells (red) for the indicated conditions: Media = background level of IFN-γ secretion from T cells, Raji/PHA blast/DC = background level of IFN-γ secretion from T cells co-cultured with unpulsed APCs, actin-pulsed Raji/PHA blast/DC = negative control-pulsed APCs, ERV-K-Env-pulsed Raji/PHA blast/DC = ERV-K-Env-pulsed APCs, pp65-pulsed Raji/PHA blast/DC = HLA-B*35 off-target control pulsed APCs, PHA = positive control. Each donor is indicated by a different symbol. ELISpot conditions were plated with the indicated peptide concentrations in duplicate or triplicate as cell numbers allowed for n = 1 donor. Error bars represent SD of all data points for one donor. The Wilcoxon rank sum test was used to compare the number of IFN-γ spots between untransduced and transduced T cells (indicated by *). The Kruskal Wallis test was used to compare the number of IFN-γ spots between each antigen condition for untransduced or transduced cells. Any Kruskal Wallis test that had p < 0.05 was followed by post-hoc pairwise Wilcoxon rank sum tests and adjusted for multiple comparisons (indicated by #). All statistical comparisons are in Tables S1 and S2. *p < 0.05, **p < 0.005, ***p < 0.0005. APCs = antigen presenting cells; ELISpot = Enzyme-linked immunosorbent spot; PHA = phytohemagglutinin; SD = standard deviation.
Figure 4
Figure 4. OM9.2 T cells were activated by a high concentration of peptide-pulsed B LCLs.
A. Diagram of the ELISpot assay design used in B-C, and E. B. Representative images of developed wells for OM9.2 T cell levels of background IFN-γsecretion (media) and IFN-γ secretion co-cultured with unpulsed and peptide-pulsed OM9-derived B LCLs for the ELISpot assays quantified C and E. Spot numbers are indicated to the bottom right of each image. C., E. Number of IFN-γ spots per well normalized to the positive control (expressed as % of PHA) of untransduced T cells (black) and OM9.2 T cells (red) for the indicated conditions: Media = background level of IFN-γ secretion from T cells, B LCLs = background level of IFN-γ secretion from T cells co-cultured with unpulsed B LCLs, actin-pulsed B LCLs = negative control-pulsed B LCLs, ERV-K-Env-pulsed B LCLs, pp65-pulsed B LCLs= HLA-B*35 off-target control pulsed B LCLs, PHA = positive control. Each donor is indicated by a different symbol. ELISpot conditions were plated with the indicated peptide concentrations in duplicate or triplicate as cell numbers allowed for n = 2 donors (C) or n = 3 donors (E). The Wilcoxon rank sum test was used to compare the number of IFN-γ spots between untransduced and transduced T cells (indicated by *). The Kruskal Wallis test was used to compare the number of IFN-γ spots between each antigen condition for untransduced or transduced cells. Any Kruskal Wallis test that had p < 0.05 was followed by post-hoc pairwise Wilcoxon rank sum tests and adjusted for multiple comparisons (indicated by #). All statistical comparisons are in Tables S1 and S2. *p < 0.05, **p < 0.005, ***p < 0.0005. D. Flow cytometry plots of intracellular IFN-γ and TNF-α from indicated cell types after 6 hours of co-culture. Cells were plated in a single well for one technical replicate. Gating strategy in Figure S4C. ELISpot = Enzyme-linked immunosorbent spot; B LCL = B lymphoblastoid cell line; PHA = phytohemagglutinin; SEM = standard error of the mean.
Figure 5
Figure 5. OM9.2 T cells were activated by a high concentration of peptide-pulsed B LCLs derived from another donor.
A. Diagram of the ELISpot assay design used in B-C. B. Representative images of developed wells of OM9.2 T cell levels of background IFN-γ secretion (media) and IFN-γ secretion in the presence of unpulsed non-OM9 B LCLs and ERV-K-Env-pulsed non-OM9 B LCLs for the ELISpot assays quantified in C. Number of spots in each well are indicated to the bottom right of each image. C. Number of IFN-γ spots per well normalized to the positive control (expressed as % of PHA) of untransduced T cells (black) and OM9.2 T cells (red) for the indicated conditions: Media = background level of IFN-γ secretion from T cells plated alone, Non-OM9 B LCLs = background level of IFN-γ secretion from T cells in the presence of unpulsed non-OM9 B LCLs,actin-pulsed non-OM9 B LCLs = negative control pulsed non-OM9 B LCLs, ERV-K-Env-pulsed non-OM9 B LCLs, PHA = positive control. Each donor is indicated by a different symbol. ELISpot conditions were plated with the indicated peptide concentrations in duplicate or triplicate as cell numbers allowed for n = 2 donors. Error bars represent SEM of all data points for all donors. The Wilcoxon rank sum test was used to compare the number of IFN-γ spots between untransduced and transduced T cells (indicated by *). The Kruskal Wallis test was used to compare the number of IFN-γ spots between each antigen condition for untransduced or transduced cells. Any Kruskal Wallis test that had p < 0.05 was followed by post-hoc pairwise Wilcoxon rank sum tests and adjusted for multiple comparisons (indicated by #). All statistical comparisons are in Tables S1 and S2. *p < 0.05, **p < 0.005, ***p < 0.0005. ELISpot = Enzyme-linked immunosorbent spot; B LCL = B lymphoblastoid cell line; PHA = phytohemagglutinin; SEM = standard error of the mean.

Similar articles

References

    1. Zhang R.; Siu M.K.Y.; Ngan H.Y.S.; Chan K.K.L. Molecular Biomarkers for the Early Detection of Ovarian Cancer. Int. J. Mol. Sci. 2022, 23, 12041, doi:10.3390/ijms231912041. - DOI - PMC - PubMed
    1. Narod S. Can Advanced-Stage Ovarian Cancer Be Cured? Nat. Rev. Clin. Oncol. 2016, 13, 255–261, doi:10.1038/nrclinonc.2015.224. - DOI - PubMed
    1. Rizvi N.A.; Hellmann M.D.; Snyder A.; Kvistborg P.; Makarov V.; Havel J.J.; Lee W.; Yuan J.; Wong P.; Ho T.S.; et al. Cancer Immunology. Mutational Landscape Determines Sensitivity to PD-1 Blockade in Non-Small Cell Lung Cancer. Science 2015, 348, 124–128, doi:10.1126/science.aaa1348. - DOI - PMC - PubMed
    1. Desrichard A.; Snyder A.; Chan T.A. Cancer Neoantigens and Applications for Immunotherapy. Clin. Cancer Res. 2016, 22, 807–812, doi:10.1158/1078-0432.CCR-14-3175. - DOI - PubMed
    1. Schumacher T.N.; Schreiber R.D. Neoantigens in Cancer Immunotherapy. Science 2015, 348, 69–74, doi:10.1126/science.aaa4971. - DOI - PubMed

Publication types