[Preprint]. 2024 May 30:2024.05.28.596284.
doi: 10.1101/2024.05.28.596284.

The Latent Aging of Cells

Affiliations

The Latent Aging of Cells

Peter Niimi et al. bioRxiv. .

Abstract

As epigenetic clocks have evolved from powerful estimators of chronological aging to predictors of mortality and disease risk, it begs the question of what role DNA methylation plays in the aging process. We hypothesize that while it has the potential to serve as an informative biomarker, DNA methylation could also be a key to understanding the biology entangled between aging, (de)differentiation, and epigenetic reprogramming. Here we use an unsupervised approach to analyze time associated DNA methylation from both in vivo and in vitro samples to measure an underlying signal that ties these phenomena together. We identify a methylation pattern shared across all three, as well as a signal that tracks aging in tissues but appears refractory to reprogramming, suggesting that aging and reprogramming may not be fully mirrored processes.


Conflict of interest statement

Declarations All authors are employees of Altos Labs.

Figures

Figure 1:
Figure 1:
Project Workflow Schematic for data collection through data processing. Created with BioRender.com.
Figure 2:
Figure 2:
Selection of PCs PC Time correlations for iPSC v Dermis, BJs vs Dermis, and iPSC vs BJs. The first 5 PCs in the correlation plots are red, yellow, green, blue, purple respectively. The last plot is the PC1 vs PC5 variance plot for serial passaged BJ fibroblasts in red, sun-exposed dermis in green, HRAS cohort in blue, and iPSC time course in purple.
Figure 3:
Figure 3:
PC1 Score in vivo PC5 Score in vivo Liver samples shown in red (GSE48325), brain samples shown in green (GSE74193) separated by samples under the age of one as developing, blood samples in cyan (GSE40279), sun-protected dermis samples in blue (GSE52980), sun-protected epidermis samples in black (GSE52980), and sun-exposed epidermis samples in pink (GSE52980).
Figure 3:
Figure 3:
PC1 Score in vivo PC5 Score in vivo Liver samples shown in red (GSE48325), brain samples shown in green (GSE74193) separated by samples under the age of one as developing, blood samples in cyan (GSE40279), sun-protected dermis samples in blue (GSE52980), sun-protected epidermis samples in black (GSE52980), and sun-exposed epidermis samples in pink (GSE52980).
Figure 4:
Figure 4:
PC1 and PC5 plotted against days of OSKM expression in 3 models of reprogramming iPSC time course in red (GSE54848), transient reprogramming by dox-inducible OSKM time course in yellow (GSE165180), Sendai time course failed to reprogram in black (GSE165180), and Sendai time course successfully reprogrammed in green (GSE165180).
Figure 5:
Figure 5:
PC Scores in vitro iPSC differentiation into neuronal cell line in yellow (GSE158089), BJ fibroblast serial passaging set 1 in cyan, BJ fibroblast serial passaging set 2 in green, serially passaged hTert immortalized BJ fibroblasts in blue, serially passaged astrocytes in purple (GSE226079), and serially passaged hTert immortalized astrocytes in pink (GSE226079). PC1 scores shown in A-F, PC5 scores shown in G-L.
Figure 5:
Figure 5:
PC Scores in vitro iPSC differentiation into neuronal cell line in yellow (GSE158089), BJ fibroblast serial passaging set 1 in cyan, BJ fibroblast serial passaging set 2 in green, serially passaged hTert immortalized BJ fibroblasts in blue, serially passaged astrocytes in purple (GSE226079), and serially passaged hTert immortalized astrocytes in pink (GSE226079). PC1 scores shown in A-F, PC5 scores shown in G-L.
Figure 6:
Figure 6:
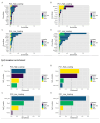
Chromatin State Enrichment CpG location enrichment for the top and bottom 1000 loading CpGs in PC1 and PC5 respectively. CpG islands in purple, open sea CpGs in blue, shelf CpGs in green, and shore CpGs in yellow.

References

    1. Abad María, Mosteiro Lluc, Pantoja Cristina, Marta Cañamero Teresa Rayon, Ors Inmaculada, Graña Osvaldo, et al. 2013. “Reprogramming in Vivo Produces Teratomas and IPS Cells with Totipotency Features.” Nature 502 (7471): 340–45. 10.1038/nature12586. - DOI - PubMed
    1. Ahuja N, Q Li A Msohan L, Baylin S B, and Issa J P. 1998. “Aging and DNA Methylation in Colorectal Mucosa and Cancer.” Cancer Research 58 (23): 5489–94. - PubMed
    1. Aran Dvir, and Hellman Asaf. 2013. “DNA Methylation of Transcriptional Enhancers and Cancer Predisposition.” Cell 154 (1): 11–13. 10.1016/j.cell.2013.06.018. - DOI - PubMed
    1. Bergsma Tessa, and Rogaeva Ekaterina. 2020. “DNA Methylation Clocks and Their Predictive Capacity for Aging Phenotypes and Healthspan.” Neuroscience Insights 15: 2633105520942221. 10.1177/2633105520942221. - DOI - PMC - PubMed
    1. Bernhart Stephan H., Kretzmer Helene, Holdt Lesca M., Frank Jühling Ole Ammerpohl, Bergmann Anke K., Northoff Bernd H., et al. 2016. “Changes of Bivalent Chromatin Coincide with Increased Expression of Developmental Genes in Cancer.” Scientific Reports 6 (1): 37393. 10.1038/srep37393. - DOI - PMC - PubMed

Publication types