[Preprint]. 2024 Jun 1:2024.06.01.596950.
doi: 10.1101/2024.06.01.596950.

Aging disrupts the coordination between mRNA and protein expression in mouse and human midbrain

Affiliations

Aging disrupts the coordination between mRNA and protein expression in mouse and human midbrain

Silas A Buck et al. bioRxiv. .

Update in

Abstract

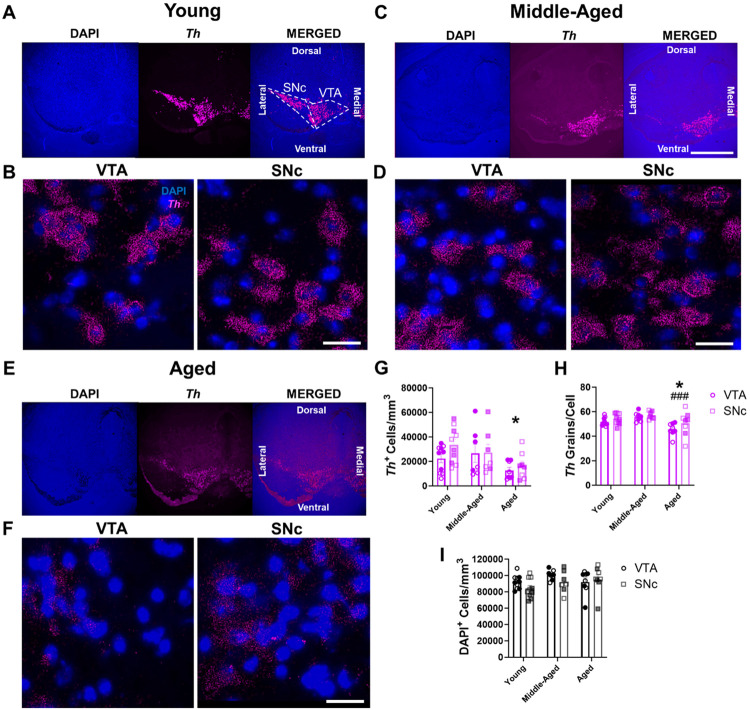
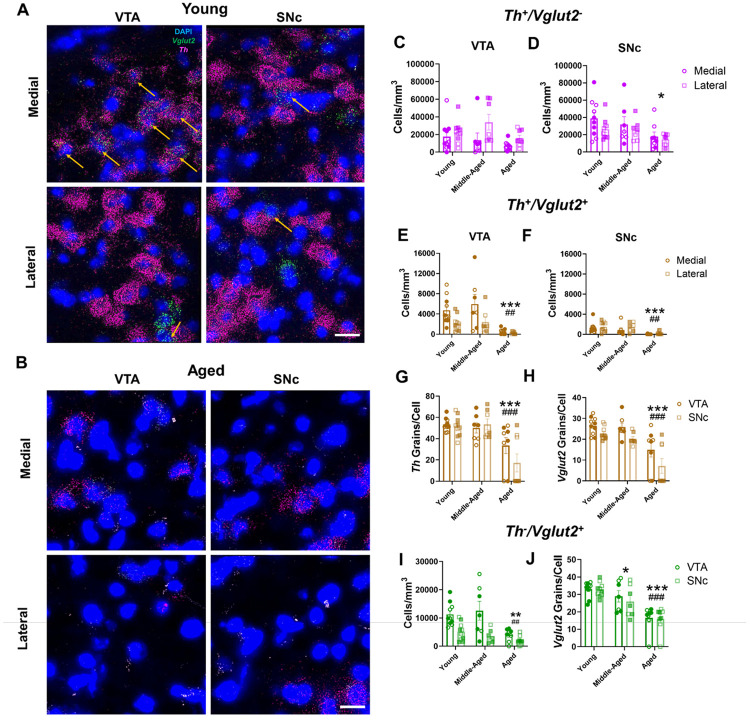
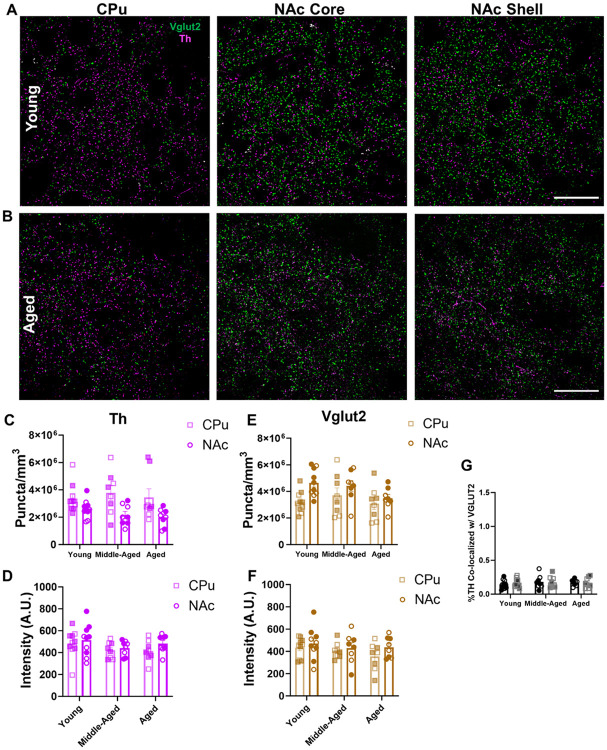
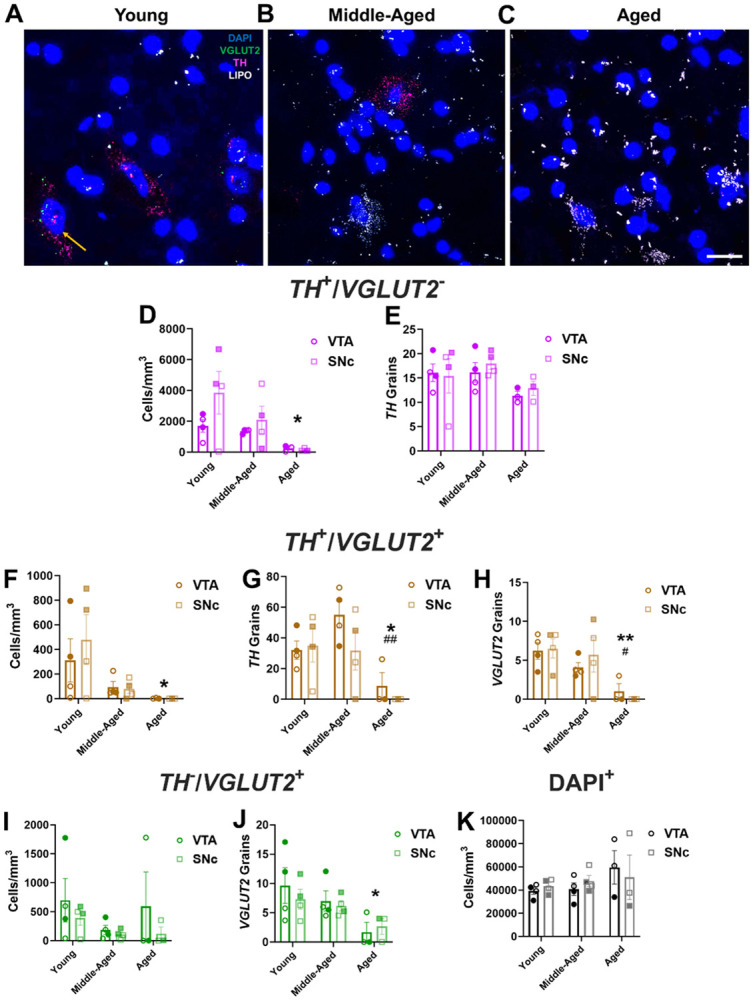
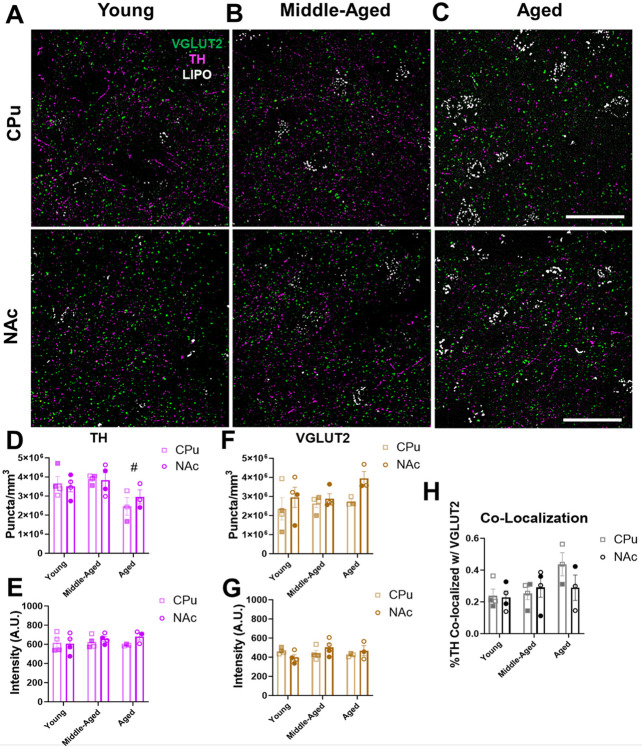
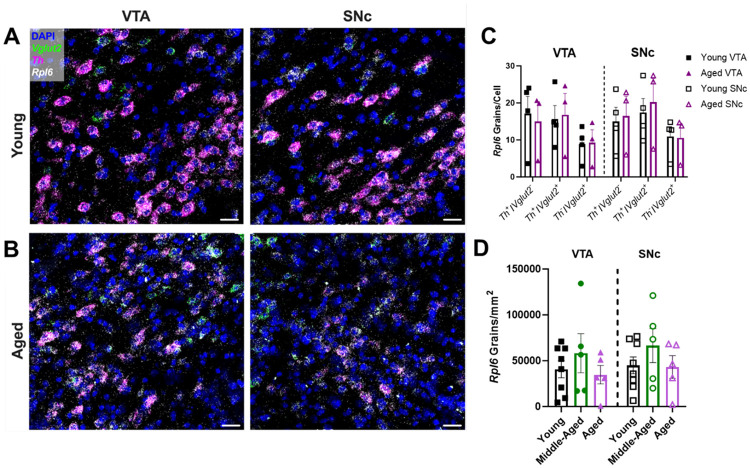
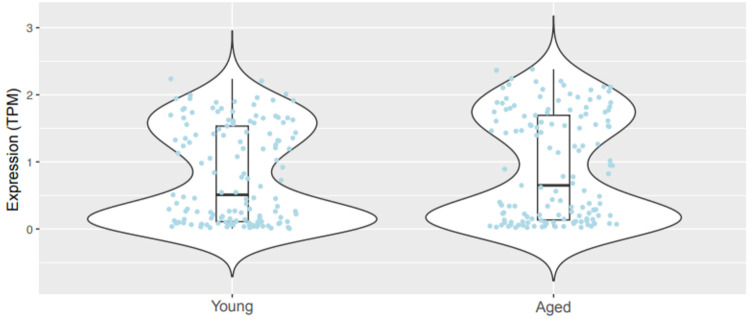
Age-related dopamine (DA) neuron loss is a primary feature of Parkinson's disease. However, it remains unclear whether similar biological processes occur during healthy aging, albeit to a lesser degree. We therefore determined whether midbrain DA neurons degenerate during aging in mice and humans. In mice, we identified no changes in midbrain neuron numbers throughout aging. Despite this, we found age-related decreases in midbrain mRNA expression of tyrosine hydroxylase (Th), the rate limiting enzyme of DA synthesis. Among midbrain glutamatergic cells, we similarly identified age-related declines in vesicular glutamate transporter 2 (Vglut2) mRNA expression. In co-transmitting Th +/Vglut2 + neurons, Th and Vglut2 transcripts decreased with aging. Importantly, striatal Th and Vglut2 protein expression remained unchanged. In translating our findings to humans, we found no midbrain neurodegeneration during aging and identified age-related decreases in TH and VGLUT2 mRNA expression similar to mouse. Unlike mice, we discovered diminished density of striatal TH+ dopaminergic terminals in aged human subjects. However, TH and VGLUT2 protein expression were unchanged in the remaining striatal boutons. Finally, in contrast to Th and Vglut2 mRNA, expression of most ribosomal genes in Th + neurons was either maintained or even upregulated during aging. This suggests a homeostatic mechanism where age-related declines in transcriptional efficiency are overcome by ongoing ribosomal translation. Overall, we demonstrate species-conserved transcriptional effects of aging in midbrain dopaminergic and glutamatergic neurons that are not accompanied by marked cell death or lower striatal protein expression. This opens the door to novel therapeutic approaches to maintain neurotransmission and bolster neuronal resilience.

Keywords: aging; dopamine; glutamate; neurodegeneration; ribosome; tyrosine hydroxylase; vesicular glutamate transporter 2.


Conflict of interest statement

Conflicts of Interest The authors report no conflicts of interest.

Figures

Figure 1.
Figure 1.. Age-related decreases in Th mRNA expression in mouse VTA and SNc.
(A-F) Representative RNAscope images of Th mRNA expression (in magenta) and associated DAPI-labeled cell nuclei (in blue) in mouse midbrain across aging. 4× images of young (A), middle-aged (C), and aged mice (E); scale bar=500μm. Enlarged 60× images show Th expression and nuclei within VTA and SNc midbrain subregions in young (B), middle-aged (D), and aged (F) animals; scale bar=25μm. (G) There were significant age-related decreases in the cell density of Th+ dopaminergic cells in the VTA and SNc (F2,44=4.8, P=0.012 for effect of age group; F1,44=1.7, P=0.2 for effect of brain region; F2,44=0.7, P=0.52 for effect of interaction). (H) There were significant age-related decreases in Th mRNA grain numbers per cell of Th+ DAergic cells in the VTA and SNc (F2,44=8.9, P=0.0006 for effect of age group; F1,44=3.6, P=0.06 for effect of brain region; F2,44=0.4, P=0.66 for effect of interaction). (I) There was no significant change in DAPI-labeled nucleus density with age in either the VTA or SNc (F2,44=2.1, P=0.14 for effect of age group; F1,44=1.6, P=0.21 for effect of brain region; F2,44=1.2, P=0.31 for effect of interaction). Shaded symbols represent female animals. Bars represent mean±SEM with points representing individual animals; N=7-10 per group. *P<0.05 compared to young age, ###P<0.001 compared to middle-aged, via Bonferroni post hoc test.
Figure 2.
Figure 2.. Th and Vglut2 mRNA expression decrease across aging in distinct midbrain neuron subpopulations.
(A-B) Representative 60× multiplex RNAscope images of Th (in magenta) and Vglut2 (in green) mRNA expression alongside DAPI nuclear stain (in blue) in the VTA and SNc of young (A) and aged (B) wild-type mice. Th+/Vglut2+ co-expressing midbrain neurons are marked by yellow arrows; scale bar=25μm. (C) There were significantly more Th+/Vglut2 cells in the lateral VTA compared to the medial VTA (F2,44=2.4, P=0.11 for effect of age group; F1,44=6.2, P=0.017 for effect of subregion; F2,44=1.0, P=0.37 for effect of interaction). (D) There was a significant age-related decrease in the cell density of Th+ neurons in the SNc (F2,44=4.9, P=0.01 for effect of age; F2,44=2.6, P=0.11 for effect of subregion; F2,44=0.38, P=0.68 for effect of interaction). (E-F) There was an age-related decrease in the cell density of Th+/Vglut2+ neurons in the VTA (E: F2,44=9.9, P=0.0003 for effect of age; F1,44=9.1, P=0.004 for effect of subregion; F2,44=1.7, P=0.20 for effect of interaction) and SNc (F: F2,44=10.3, P=0.0002 for effect of age; F1,44=1.6, P=0.21 for effect of region; F2,44=0.2, P=0.82 for effect of interaction) of aged mice compared to young and middle-aged animals. (G) Th mRNA expression decreased within midbrain Th+/Vglut2+ cells in aged mice (F2,44=16.62, P<0.0001 for effect of age; F1,44=1.247, P=0.27 for effect of region; F2,44=1.736, P=0.19 for effect of interaction). (H) Vglut2 mRNA grain expression decreased within midbrain Th+/Vglut2+ cells in aged mice. Additionally, Vglut2 mRNA grain expression was greater in the VTA compared to SNc (F2,44=21.3, P<0.0001 for effect of age; F1,44=79.758, P=0.032 for effect of brain region; F2,44=0.40, P=0.68 for effect of interaction). (I) There was a lower cell density of purely glutamatergic Th/Vglut2+ neurons in the VTA and SNc of aged mice compared to young and middle-aged mice (F2,44=7.9, P=0.0012 for effect of age; F1,44=22.1, P<0.001 for effect of region; F2,44=2.7, P=0.08 for effect of interaction). (J) There was a significant decrease in Vglut2 mRNA grains per Th/Vglut2+ cells in middle-aged compared to young mice. Aged mice exhibited a further decrease in Vglut2 mRNA grains compared to young and middle-aged mice. (F2,44=28.12, P<0.001 for effect of age; F1,44=0.52, P=0.48 for effect of region; F2,42=0.17, P=0.84 for effect of interaction). Shaded symbols represent females and open symbols represent males. Bars represent mean±SEM with points representing individual animals; N=7-10 per group. *P<0.05, **P<0.01, ***P<0.001 compared to young age, #P<0.05, ##P<0.01 compared to middle-aged, ###P<0.001 compared to middle-aged, via Bonferroni post hoc test.
Figure 3.
Figure 3.. Th and Vglut2 protein expression is unaltered across aging in mouse striatum.
(A-B) 60× representative images of immunohistochemical labeling of Th (in magenta) and Vglut2 (in green) protein in the CPu, NAc core, and NAc shell subregions of mouse striatum; scale bars=25μm. (C) There was no change in Th+ puncta density across aging. There were significantly higher levels of Th+ puncta in the CPu compared to the NAc (F2,46=0.3, P=0.74 for effect of age; F1,46=16.3, P=0.0002 for effect of region; F2,46=0.8, P=0.46 for effect of interaction). (D) There was no change in Th+ puncta intensity across aging or between striatal regions (F2,46=2.1, P=0.13 for effect of age, F1,46=1.7, P=0.20 for effect of brain region; F2,46=0.23, P=0.79 for effect of interaction). (E) There was no change in Vglut2+ puncta density across age. There were significantly higher levels of Vglut2+ puncta in the NAc compared to CPu (F2,46=2.2, P=0.12 for effect of age; F1,46=7.6, P=0.0083 for effect of region; F2,46=1.1, P=0.35 for effect of interaction). (F) There was no change in Vglut2+ puncta intensity across age or striatal region (F2,46=1.1, P=0.33 for effect of age; F1,46=2.2, P=0.14 for effect of region; F2,46=0.3, P=0.74 for effect of interaction). (G) There were low levels of TH co-localization with Vglut2 (~0.2%) that remained unchanged with age or across NAc sub-region (F2,46=0.3, P=0.71 for effect of age; F1,46=0.1, P=0.79 for effect of NAc sub-region; F2,46=0.2, P=0.84 for effect of interaction). Shaded symbols represent female animals and open symbols represent males. Bars represent mean±SEM with points representing individual animals; N=8-10 per group.
Figure 4.
Figure 4.. Age-related decreases in TH and VGLUT2 mRNA expression in human VTA and SNc.
(A-C) Representative 60× multiplex RNAscope images showing mRNA expression of TH (in magenta) and VGLUT2 (in green) mRNA expression alongside DAPI-labeled nuclei (in blue) in postmortem midbrains of young, middle-aged, and aged subjects; lipofuscin (LIPO, in white) was also present in middle-aged and aged tissue; scale bar=25μm. (D) There was an age-related decrease in cell density of non-glutamatergic TH+ neurons (TH+/VGLUT2) (F2,16=5.2, P=0.018 for effect of age, F1,15=2.1, P=0.16 for effect of brain region; F2,15=1.1, P=0.37 for effect of interaction). (E) TH mRNA grain numbers in TH+ neurons did not change between age groups or across region (F2,15=2.5, P=0.12 for effect of age; F1,15=0.2, P=0.63 for effect of brain region; F2,15=0.2, P=0.83 for effect of interaction). (F) TH+/VGLUT2+ cell density diminished with age (F2,16=5.6, P=0.014 for effect of age; F1,16=0.2, P=0.63 for effect of region; F2,16=0.4, P=0.7 for effect of interaction). (G) TH mRNA grains per cell declined across aging (F2,16=8.6, P=0.0029 for effect of age; F1,16=1.6, P=0.23 for effect of region; F2,16=1.1, P=0.36 for effect of interaction). (H) VGLUT2 mRNA grains per cell decreased across aging (F2,16=9.7, P=0.0018 for effect of age; F1,16=0.1, P=0.78 for effect of brain region; F2,16=0.5, P=0.63 for effect of interaction). (I) Among non-dopaminergic VGLUT2+ midbrain neurons (TH/VGLUT2+), there was no significant change in cell density (F2,16=1.2, P=0.32 for effect of age; F1,16=1.7, P=0.21 for effect of region; F2,16=0.27, P=0.77 for effect of interaction). (J) Numbers of VGLUT2 mRNA grains per cell were significantly decreased in aged subjects compared to young subjects (F2,16=5.1, P=0.019 for effect of age; F1,16=0.2121, P=0.65 for effect of region; F2,16=0.34, P=0.72 for effect of interaction). (K) There was no change in the density of DAPI-stained nuclei with age (F2,16=1.3, P=0.29 for effect of age; F1,16=0.02, P=0.90 for effect of region; F2,16=0.4, P=0.66 for effect of interaction). Shaded symbols represent female subjects and open symbols represent male subjects. Bars represent mean±SEM with points representing individual subjects; N=3-4 per group. *P<0.05 compared to young subjects. #P<0.05 compared to middle-aged subjects.
Figure 5.
Figure 5.. TH and VGLUT2 protein expression in projections to human striatum remain unchanged throughout aging.
(A-C) 60× representative immunohistochemistry images of TH (in magenta) and VGLUT2 (in green) protein expression within the NAc and CPu subregions of human striatum; lipofuscin (in white) was also present in the images; scale bars=25μm. (D) There was an age-related decrease in the density of TH+ puncta in aged versus middle-aged subjects (F2,16=5.8, P=0.013 for effect of age; F1,16=0.1, P=0.74 for effect of region; F2,16=0.5, P=0.63 for effect of interaction). (E) There were no significant age-related changes in the intensity of TH+ puncta in the striatum across age or between regions (F2,16=0.3, P=0.72 for effect of age; F1,16=1.3, P=0.27 for effect of region; F2,16=0.8, P=0.47 for effect of interaction). (F) VGLUT2 puncta density remained unaltered across aging and between regions (F2,16=1.5, P=0.26 for effect of age; F1,16=4.2, P=0.057 for effect of region; F2,16=2.3, P=0.14 for effect of interaction). (G) VGLUT2 puncta intensity remained unaltered across aging and between regions (F2,16=0.8, P=0.46 for effect of age; F1,16=0.2, P=0.63 for effect of region; F2,16=2.3, P=0.14 for effect of interaction). (H) Quantification showed low levels of TH and VGLUT2 co-localization in projections to the striatum (~0.2-0.4%) that did not change with age or across region (F2,16=2.7, P=0.097 for effect of age; F1,16=0.8, P=0.39 for effect of region; F2,16=1.4, P=0.28 for effect of interaction). Shaded symbols represent female subjects and open symbols represent male subjects. Bars represent mean±SEM with points representing individual subjects; N=3-4 per group. #P<0.05 compared to middle-aged subjects.
Figure 6.
Figure 6.. Rpl6 mRNA expression is preserved across aging in the mouse midbrain.
(A-B) Representative 60× multiplex RNAscope images of Th (in magenta), Vglut2 (in green), and Rpl6 (in white) mRNA expression alongside DAPI nuclear stain (in blue) in the VTA and SNc of young and aged wild-type mice. Scale bars=25μm (C) Cell type- and region-specific analysis of average Rpl6 mRNA grain numbers per cell. There were no significant expression differences in Th+/Vglut2, Th+/Vglut2+, and Th/Vglut2+ cell types in either the VTA or SNc of young versus aged mice (F1,30=0.30, P=0.59 for effect of age; F1,30=0.05, P=0.82 for effect of region; F2,30=3.558, P=0.04 for effect of cell type; F1,30=0.10, P=0.75 for effect of age×region; F2,30=0.12, P=0.89 for effect of age×cell type; F2,30=0.09, P=0.92 for effect of region×cell type; F2,30=0.07, P=0.94 for effect of age×region×cell type. (D) Quantification of Rpl6 mRNA density across both VTA and SNc showed no significant differences between the age groups (F2,30=1.6091, P=0.22 for effect of age; F1,30=0.4163, P=0.52 for effect of region; F2,30=0.018, P=0.98 for effect of interaction). Bars represent mean±SEM with points representing individual animals; N=3-8 per group.
Figure 7.
Figure 7.. Transcriptomic analysis of ribosomal genes in young and aged mice.
Expression levels of 141 ribosomal genes in Th+ cells (young cells, N=295; aged cells, N=502). Each jitter represents averaged expression levels (in TPM) for every assayed ribosomal gene in Th+ neurons of young versus aged wild-type mice. Each of the 141 ribosomal genes was expressed in at least 10 Th+ cells. There was no significant difference in gene expression between the young and old groups (t = 0.893, P = 0.37). Box and whiskers represent the 25th percentile, median, and 75th percentile.

Similar articles

References

    1. Sulzer D., and Surmeier D.J. (2013). Neuronal vulnerability, pathogenesis, and Parkinson's disease. Movement disorders : official journal of the Movement Disorder Society 28, 715–724. 10.1002/mds.25187. - DOI - PubMed
    1. Reeve A., Simcox E., and Turnbull D. (2014). Ageing and Parkinson's disease: why is advancing age the biggest risk factor? Ageing research reviews 14, 19–30. 10.1016/j.arr.2014.01.004. - DOI - PMC - PubMed
    1. Lee J., and Kim H.J. (2022). Normal Aging Induces Changes in the Brain and Neurodegeneration Progress: Review of the Structural, Biochemical, Metabolic, Cellular, and Molecular Changes. Frontiers in aging neuroscience 14, 931536. 10.3389/fnagi.2022.931536. - DOI - PMC - PubMed
    1. Ota M., Yasuno F., Ito H., Seki C., Nozaki S., Asada T., and Suhara T. (2006). Age-related decline of dopamine synthesis in the living human brain measured by positron emission tomography with L-[beta-11C]DOPA. Life Sci 79, 730–736. 10.1016/j.lfs.2006.02.017. - DOI - PubMed
    1. Volkow N.D., Ding Y.S., Fowler J.S., Wang G.J., Logan J., Gatley S.J., Hitzemann R., Smith G., Fields S.D., and Gur R. (1996). Dopamine transporters decrease with age. Journal of nuclear medicine : official publication, Society of Nuclear Medicine 37, 554–559. - PubMed

Publication types