[Preprint]. 2024 May 30:2024.05.28.596192.
doi: 10.1101/2024.05.28.596192.

Dopamine-mediated plasticity preserves excitatory connections to direct pathway striatal projection neurons and motor function in a mouse model of Parkinson's disease

Affiliations

Dopamine-mediated plasticity preserves excitatory connections to direct pathway striatal projection neurons and motor function in a mouse model of Parkinson's disease

Joe C Brague et al. bioRxiv. .

Abstract

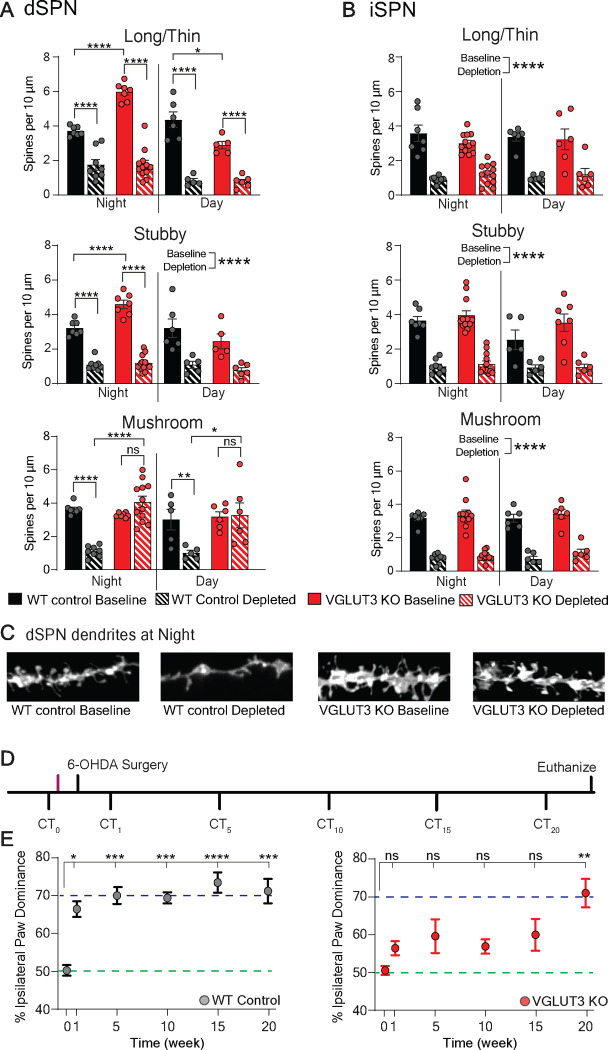
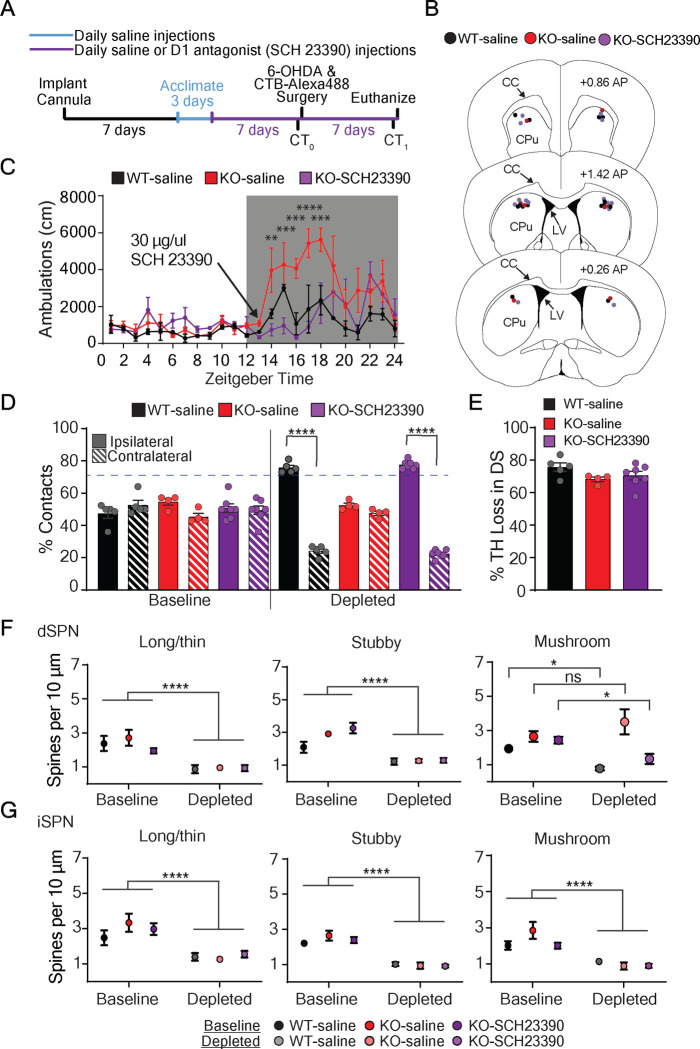
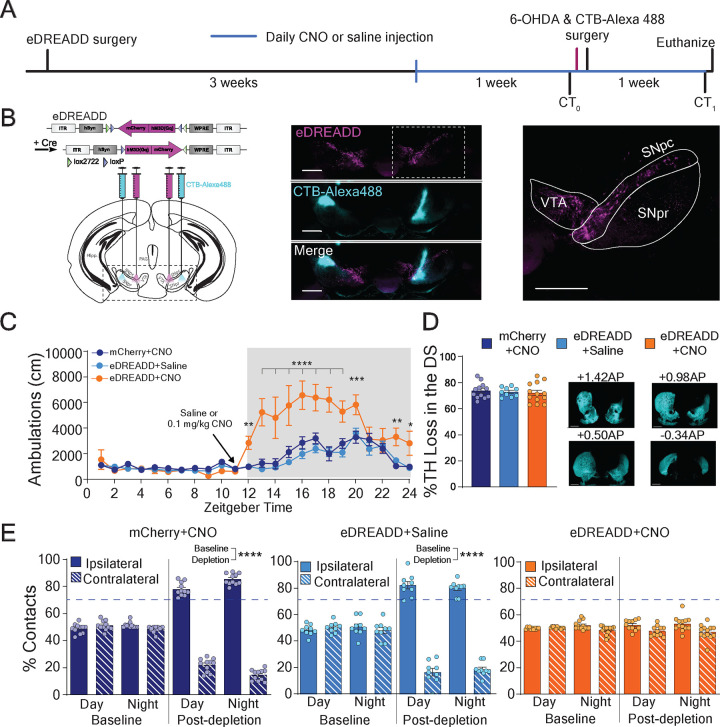
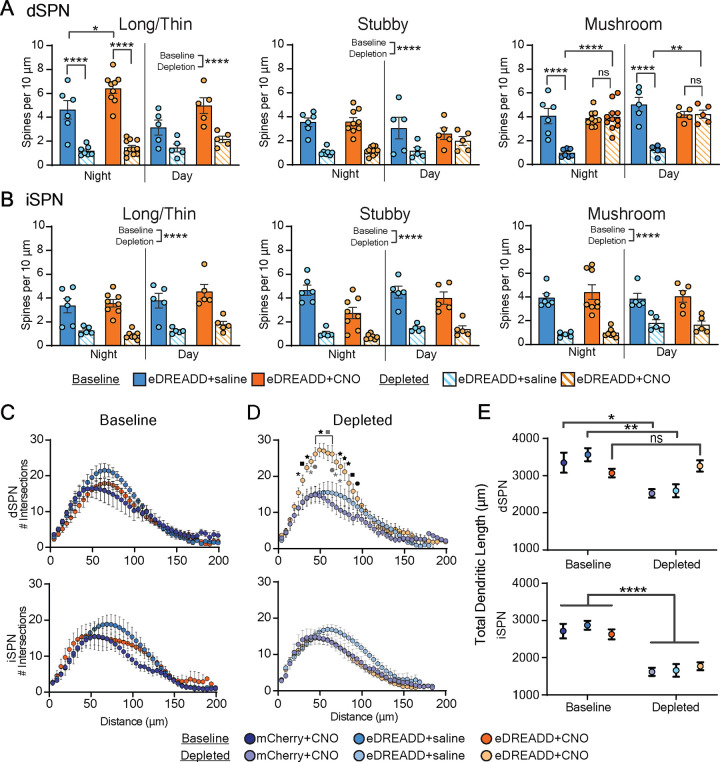
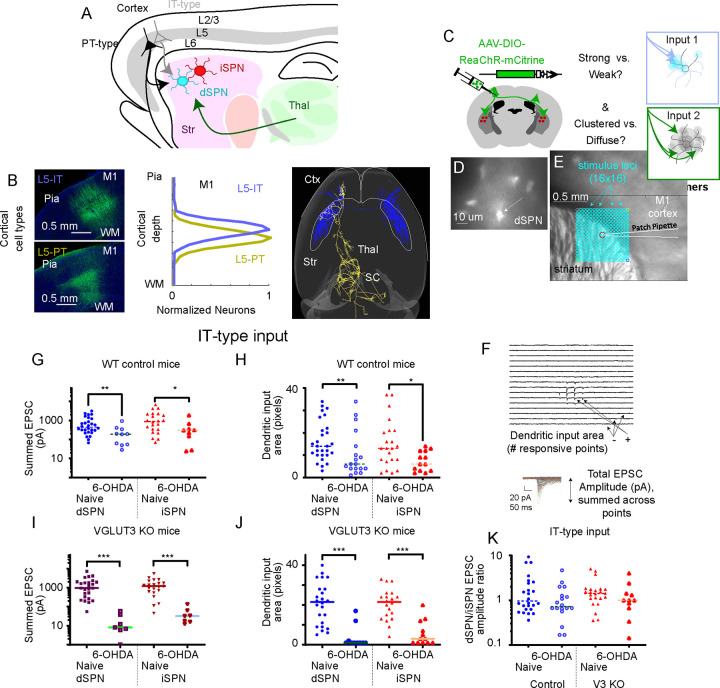
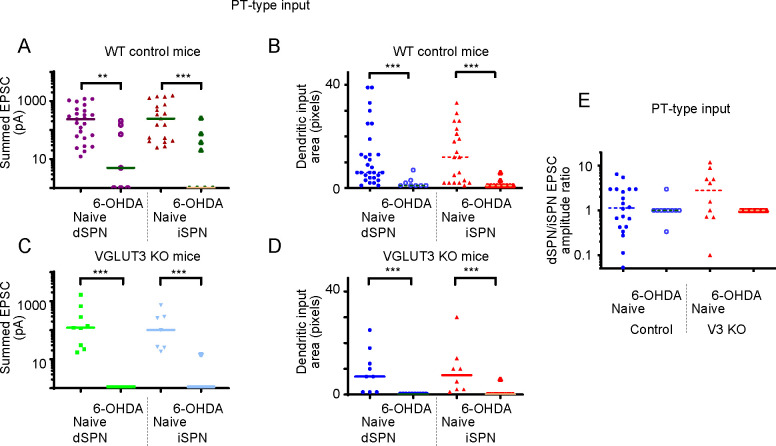
The cardinal symptoms of Parkinson's disease (PD) such as bradykinesia and akinesia are debilitating, and treatment options remain inadequate. The loss of nigrostriatal dopamine neurons in PD produces motor symptoms by shifting the balance of striatal output from the direct (go) to indirect (no-go) pathway in large part through changes in the excitatory connections and intrinsic excitabilities of the striatal projection neurons (SPNs). Here, we report using two different experimental models that a transient increase in striatal dopamine and enhanced D1 receptor activation, during 6-OHDA dopamine depletion, prevent the loss of mature spines and dendritic arbors on direct pathway projection neurons (dSPNs) and normal motor behavior for up to 5 months. The primary motor cortex and midline thalamic nuclei provide the major excitatory connections to SPNs. Using ChR2-assisted circuit mapping to measure inputs from motor cortex M1 to dorsolateral dSPNs, we observed a dramatic reduction in both experimental model mice and controls following dopamine depletion. Changes in the intrinsic excitabilities of SPNs were also similar to controls following dopamine depletion. Future work will examine thalamic connections to dSPNs. The findings reported here reveal previously unappreciated plasticity mechanisms within the basal ganglia that can be leveraged to treat the motor symptoms of PD.

Keywords: Direct Pathway; Dopamine; Motor Function; Parkinson’s disease; Plasticity; Spiny Projection Neuron; Striatum.


Conflict of interest statement

Declaration of interests The authors declare no competing interests.

Figures

Figure 1.
Figure 1.. Specificity of spine density phenotypes to dSPNs and duration of normal motor behavior in VGLUT3 KO mice.
(A) At baseline during the night, VGLUT3 KO mice (red solid bar) show enhanced density of immature (long/thin and stubby) spines on dSPNs compared to WT controls (black solid bar). After dopamine depletion, mature (mushroom) spine densities are significantly decreased in WT mice (blacked solid vs striped bars) but are preserved in VGLUT3 KO mice (red solid vs striped bars) across the circadian cycle. Densities of all other spine types are decreased significantly after dopamine depletion in both WT and VGLUT3 KO mice. Significant interaction by 2-way ANOVA (genotype × condition) for all spine types and time points (except stubby spines during the day; main effect p<0.0001). (B) iSPN spine densities are similar at baseline in VGLUT3 KO and WT mice and all spines are decreased similarly by depletion in both genotypes. Two-way ANOVA (genotype × condition), no significant interaction, main effect for condition is reported. (C) Representative images of DiI filled dSPN dendrites during the night from WT (black) and VGLUT3 KO (red) mice. (D) Experimental paradigm measuring preserved motor behavior in VGLUT3 KO mice following dopamine depletion. CT = cylinder test. Unilateral dorsal striatal 6-OHDA (6 μg) injection. Magenta line indicates time of spine density measurement at baseline. (E) VGLUT3 KO mice (red dots) do not show significant ipsilateral paw dominance until 20 weeks post-depletion. WT mice (gray dots) show ipsilateral dominance at 1 week. Purple and green dotted lines indicate 50% (normal) and 70% (Parkinsonian) ipsilateral paw reaches, respectively. One-way repeated measures ANOVA with Bonferroni post hoc comparison to baseline *p<0.05, **p<0.01, ***p<0.001, ****p<0.0001, ns = not significant.
Figure 2.
Figure 2.. Elevated striatal dopamine signaling through D1 receptors during dorsal striatal dopamine depletion is required for preserved d morphology and motor behavior.
(A) Experimental paradigm for testing the role of enhanced striatal D1 receptor signaling on motor behavior and SPN morphology in a model of PD. CT=cylinder test. (B) Locations of bilateral cannula placement in dorsal striatum of the three cohorts. CC=corpus callosum CPu= caudate putamen, LV= lateral ventricle, AP= anterior posterior (C) The dose of D1 receptor antagonist (SCH23390, 30 μg in 1 ul) delivered directly into the dorsal striatum of VGLUT3 KO mice was optimized to suppress locomotor activity to WT levels. Significant interaction by 2-way ANOVA (cohort × hour) with Bonferroni multiple comparisons. (D) One week after 6-OHDA injection, VGLUT3 KO mice infused with SCH23390 (purple striped bar) developed ipsilateral paw dominance similar to control WT mice infused with saline (black striped bar), while control VGLUT3 KO mice infused with saline (red striped bar) continued to show bilateral paw reaches as expected. Significant interaction by 2way ANOVA (cohort × condition) with Bonferroni multiple comparisons. (E) Percent decrease in dorsal striatal TH immunoreactivity one week after 6-OHDA injection is similar across all three animal groups, Kruskal-Wallis test. (F) At baseline, dSPN spine densities were similar between cohorts. After dopamine depletion, mature (mushroom) spine densities of VGLUT3 KO (D1 antagonist infused) were decreased similarly to the WT (saline infused), while control VGLUT3 KO (saline infused) showed the expected preserved mushroom spine densities. Significant interaction by 2-way ANOVA (cohort × condition) with Bonferroni multiple comparisons. (G) Baseline iSPN spine densities were similar between cohorts. After depletion, spine densities were significantly decreased across cohorts. All measurements taken during the day. No interaction by 2-way ANOVA (cohort × condition). Significant main effects of condition. *p<0.05, **p<0.01, ***p<0.005, ****p<0.0001, ns = not significant.
Figure 3.
Figure 3.. eDREADD+CNO mice show normal motor behavior following 6-OHDA mediated dorsal striatal dopamine depletion.
(A) Experimental paradigm for transiently elevating dopamine (eDREADD+CNO) in the preservation of bilateral paw reaching behavior after dorsal striatal dopamine depletion. CT0= cylinder test at baseline, CT1= cylinder test 1 week after dorsal striatal 6-OHDA injection. Magenta line indicates baseline spine density collection (data shown in Figure 3). (B) Left: Illustration of Cre-dependent eDREADD (hM3Dq) viral construct and brain sites for bilateral injection of AAV8 eDREADD and CTB-Alexa488 in DATCre mice. Middle: Confocal image eDREADD-mCherry (magenta) in midbrain dopamine neurons and CTBAlexa488 (cyan) in SNpr to back-label dSPNs. Right: Magnified confocal image. VTA-ventral tegmental area; SNpc-substantia nigra pars compacta; SNpr-substantia nigra pars reticulata. Scale bars = 500 μm. (C) Locomotor activity is significantly elevated after CNO injection (0.1 mg/kg, i.p.) in eDREADD expressing mice (eDREADD+CNO mice, orange line) compared to control mice (dark and light blue lines). Significant interaction by 2-way ANOVA (genotype × condition). Bonferroni multiple comparison post-hoc. (D) No difference between eDREADD+CNO mice (orange bar) and controls (light and dark blue bars) in percent loss of TH immunoreactivity in the dorsal striatum 1 week after 6-OHDA injection. Kruskal-Wallis test (E) eDREADD+CNO mice (orange bars) show preserved bilateral paw reaches one week after 6-OHDA injection, while control mice show ipsilateral paw dominance (light and dark bars). No significant interaction by 2-way ANOVA (paw × condition) in eDREADD+CNO mice. Significant interaction and Bonferroni multiple comparisons for controls. *<0.05, **p<0.01, ***p<0.005, ****p<0.001.
Figure 4.
Figure 4.. eDREADD+CNO mice recapitulate the morphological changes observed in SPNs of VGLUT3 KO mice after dorsal striatal dopamine depletion.
(A) At baseline, immature (long/thin) d spine density in eDREADD+CNO mice (orange solid bars) is enhanced compared to control eDREADD+saline (light blue solid bars) only during the night. After depletion, mature (mushroom) spine density is preserved in eDREADD+CNO mice (orange solid vs striped bars) but not in control (light blue solid vs striped bars) across the circadian cycle. mCherry+CNO control located in Extended data S3 for illustrative purposes. Significant interaction by 2-way ANOVA (cohort × condition) mushroom and long/thin spines. Bonferroni multiple comparisons. No interaction stubby and long/thin spines during the day. Significant main effect for condition. (B) Depletion decreased iSPN spine densities to the same extent in eDREADD+CNO mice (orange bar) and control (light and dark blue bars). No interaction by 2-way ANOVA (cohort × condition). Significant main effect for condition. (C) Number of intersections by dSPN and iSPN dendrites in dorsal striatum is similar across cohorts at baseline (left). No interaction by 2-way ANOVA (cohort × intersection). After dopamine depletion, intersections by dSPNs in eDREADD+CNO mice (light orange dots, right) are significantly enhanced compared to control cohorts (light purple and light blue dots). Significant interaction by 2-way ANOVA (cohort × intersection). Bonferroni multiple comparisons. Black symbols compare eDREADD+CNO mice to mCherry+CNO controls, grey symbols compare eDREADD+CNO mice to eDREADD+Saline controls. *p<0.05; ●p<0.01, ■p<0.001, p<0.0001. (D) eDREADD+CNO mice (dark and light orange dots), but not controls (dark and light purple and blue dots) show preserved total dendritic length of dSPNs after dopamine depletion. Significant interaction by 2-way ANOVA (cohort × condition). Bonferroni multiple comparisons. Total dendritic length of iSPNs is decreased significantly within all cohorts after depletion. No interaction by 2-way ANOVA (animal group × condition). *p<0.05, **p<0.01, ***p<0.005, ****p<0.001, ns = not significant.
Figure 5.
Figure 5.. Quantification of Cell Type-Specific Corticostriatal Connection Strength
(A) Layer 5 IT-type (gray) and PT-type (black) neurons project to dSPN (blue) and iSPN (red) in striatum. Thalamus (green) also excites these targets. (B) Cre-driver mouse lines label IT-type neurons (top, PL56-Cre) and PT-type neurons (bottom, KJ18-Cre) with AAV-DIO-EGFP. Image shows cell bodies in forelimb M1, with pia and white matter (WM) marked for reference. The laminar distribution of labeled neurons in these mouse lines is shown in the center. At right, example reconstructed axons of a single IT-type neuron (blue) and a single PT-type neuron (gold) are shown from above, with targets in cortex (ctx), striatum (str), thalamus (thal), and superior colliculus (SC) shown. (C) Stereotaxic AAV injection of Cre-dependent opsin makes IT-type (green; or PT-type, not shown) axons excitable for recording input to dSPN (transgenically labeled with Drd1a-tdTomato) or in neighboring iSPN cells. Experiments test whether input is strong or weak and clustered or diffuse. (D) 60x fluorescence image of tdTomato+ dSPN in a PL56-Cre+, Drd1a-tdTomato+ striatal brain slice. (E) 4x brightfield image of coronal brain slice. dSPN soma (center, red circle) shown with teal points for input mapping with sCRACM. 16×16 array of points are spaced at 50 mm. (F) Responses to 1 ms, 1 mW 470 nm laser stimuli displayed in relative location in the dendritic arbor. Non-responsive points are flat. Inset shows mean responses at each point aligned (mean of 2–5 sweeps). Total EPSC amplitude and number of input points is quantified. (G) Total EPSC amplitude on a log scale to dSPN and iSPN from IT-type neurons in naive conditions and following 6-OHDA depletion. (H) Dendritic input area to dSPN and iSPN from IT-type neurons, plotted as for EPSC strength. (I,J) Total EPSC amplitude on a log scale and dendritic input area to dSPN and iSPN from IT-type neurons in naive conditions and following 6-OHDA depletion for VGLUT3 KO mice. (I) (K) dSPN/iSPN input ratio for summed EPSC amplitude. Data are compared by Mann-Whitney. *, p<0.05; **, p<0.01, ***, p<0.001.
Figure 6.
Figure 6.. Quantification of Cell Type-Specific Corticostriatal Connection Strength from PT-type corticostriatal inputs
(A) Total EPSC amplitude on a log scale to dSPN and iSPN from PT-type neurons in naive conditions and following 6-OHDA depletion. (B) Dendritic input area to dSPN and iSPN from PT-type neurons, plotted as for EPSC strength. (C) Total EPSC amplitude on a log scale and dendritic input area to dSPN and iSPN from PT-type neurons in non-depleted conditions and following 6-OHDA depletion for VGLUT3 KO mice. (D) dSPN/iSPN input ratio for summed EPSC amplitude. Data are compared by Mann-Whitney. *, p<0.05; **, p<0.01, ***, p<0.001.

Similar articles

References

    1. Ade K.K., Wan Y., Chen M., Gloss B., and Calakos N. (2011). An Improved BAC Transgenic Fluorescent Reporter Line for Sensitive and Specific Identification of Striatonigral Medium Spiny Neurons. Front Syst Neurosci 5, 32. 10.3389/fnsys.2011.00032 - DOI - PMC - PubMed
    1. Albin R.L., Young A.B., and Penney J.B. (1989). The functional anatomy of basal ganglia disorders. 12, 336–375. - PubMed
    1. Armbruster B.N., Li X., Pausch M.H., Herlitze S., and Roth B.L. (2007). Evolving the lock to fit the key to create a family of G protein-coupled receptors potently activated by an inert ligand. PNAS 104, 5163–5168. - PMC - PubMed
    1. Baquet Z.C., Gorski J.A., and Jones K.R. (2004). Early striatal dendrite deficits followed by neuron loss with advanced age in the absence of anterograde cortical brain-derived neurotrophic factor. J Neurosci 24, 4250–4258. 10.1523/JNEUROSCI.3920-03.2004. - DOI - PMC - PubMed
    1. Baydyuk M., and Xu B. (2014). BDNF signaling and survival of striatal neurons. Front Cell Neurosci 8, 254. 10.3389/fncel.2014.00254. - DOI - PMC - PubMed

Publication types