[Preprint]. 2024 May 28:2024.02.22.581667.
doi: 10.1101/2024.02.22.581667.

Prediction of neural activity in connectome-constrained recurrent networks

Affiliations

Prediction of neural activity in connectome-constrained recurrent networks

Manuel Beiran et al. bioRxiv. .

Abstract

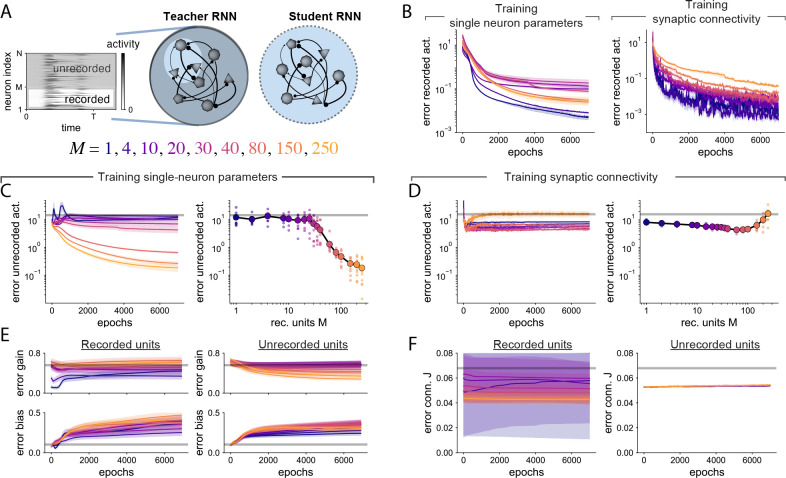
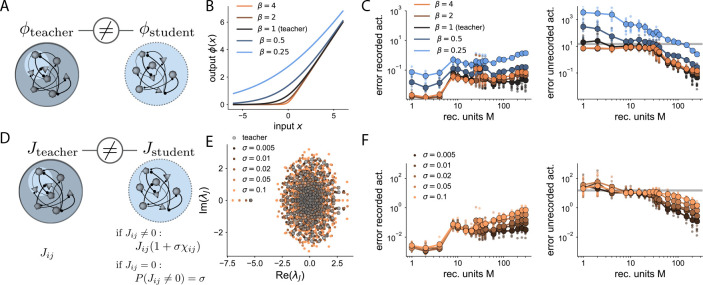
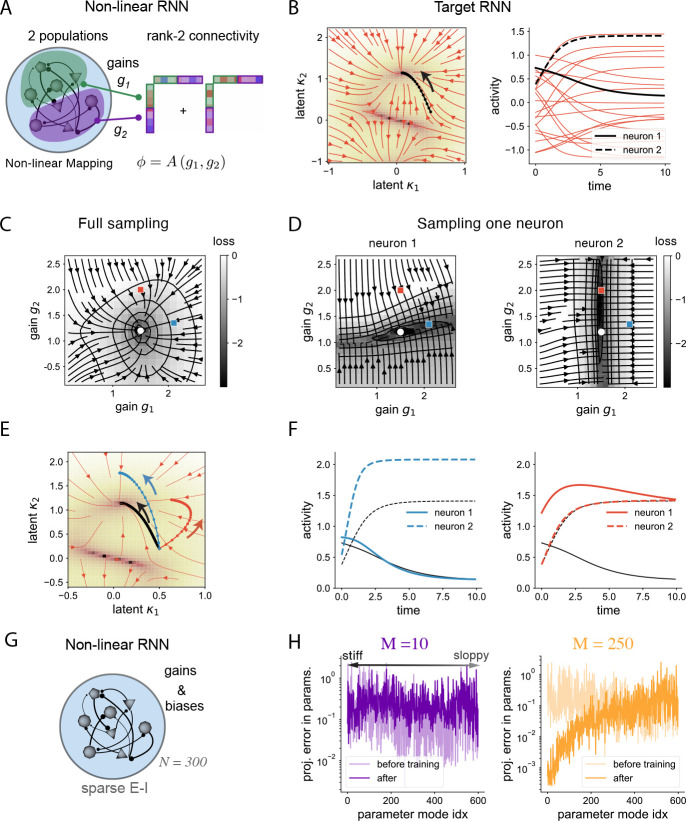
We develop a theory of connectome-constrained neural networks in which a "student" network is trained to reproduce the activity of a ground-truth "teacher," representing a neural system for which a connectome is available. Unlike standard paradigms with unconstrained connectivity, here the two networks have the same connectivity but different biophysical parameters, reflecting uncertainty in neuronal and synaptic properties. We find that a connectome is often insufficient to constrain the dynamics of networks that perform a specific task, illustrating the difficulty of inferring function from connectivity alone. However, recordings from a small subset of neurons can remove this degeneracy, producing dynamics in the student that agree with the teacher. Our theory can also prioritize which neurons to record from to most efficiently predict unmeasured network activity. Our analysis shows that the solution spaces of connectome-constrained and unconstrained models are qualitatively different and provides a framework to determine when such models yield consistent dynamics.


Figures

Figure 1:
Figure 1:. Task-constrained networks with the same connectivity.
A A teacher RNN is trained to generate two different readout responses based on two different output pulses. B Properties of the teacher RNN. The teacher RNN has heterogeneous single neuron parameters (gains and biases of single neuron activation functions, left), sparse connectivity with connection probability p=0.5 (right), and neurons connect through either excitatory (red) or inhibitory (blue) synapses. C Student networks with the same connectivity as the teacher are trained to produce the teacher’s output. Error in the readout (training loss, MSE) as a function of training epochs. Each colored line corresponds to a different student network. D Error (mismatch in neural activity) between teacher and student RNNs. Gray line, for reference, corresponds to the average error in activity when the student reproduces the teacher’s activity but with shuffled neuron identities. E Error in gains and biases vs. training epochs. F Readout of teacher and student networks after training, for the two trial types (top and bottom). Teacher and student networks both solve the task. G Neural activity of an example excitatory (left) and inhibitory (right) neuron. Teacher and student neurons exhibit different single-neuron dynamics.
Figure 2:
Figure 2:. Transition in the prediction of the activity of unrecorded neurons when training single-neuron parameters.
A The student RNN is trained to mimic the activity of M recorded neurons in a teacher RNN. B Error in recorded activity (loss) vs. training epochs for students with trained single neuron parameters (left) and students with trained connectivity (right). Lines correspond to different numbers of recorded neurons M and show mean and SEM over 10 random seeds. All students successfully reproduce the recorded activity of the teacher after learning. C Left: Error between teacher and students in the activity of the NM unrecorded neurons vs. training epochs. Right: Error in unrecorded neuronal activity after training, as a function of number of recorded neurons M. Error is substantially reduced when recording from M>30 neurons. D Analogous to Panel D, but training synaptic weights instead. The error in the activity of unrecorded neurons remains high across values of M. E Error in gains and biases vs. training epochs. Left: Parameters of recorded neurons. Right: Parameters of unrecorded neurons. F Analogous to panel E for connectivity weights between recorded neurons (left) and between unrecorded neurons (right).
Figure 3:
Figure 3:. Prediction of unrecorded neurons’ activity depends on the geometry of dynamics, not network size.
A Set of teacher RNNs with variable network size N but fixed rank of the connectivity matrix (see Methods). B Teachers of different size produce the same low-dimensional dynamics. Left: Dynamics projected on the top two principal components (PCs). All RNNs generate a limit cycle largely constrained to a 2D linear subspace. Right: Variance screeplot. C Error in the activity of unrecorded neurons, after training. We measured the correlation distance between activity in the teacher and student. Empirical average and SEM for each network size (10 networks per condition). Gray line sets represents the baseline error corresponding to shuffled neuronal identities. D Set of teacher RNNs with variable network size N with random (full-rank) connectivity. E Left: Networks generate high-dimensional chaotic dynamics. Sample activity of four units for networks of different sizes. Right: Variance scree plot. Larger networks generate higher dimensional dynamics. F Error in the activity of unrecorded neurons after training. Larger networks require recording from a larger number of neurons M to predict unrecorded activity. Inset: Number of neurons M* needed to predict unrecorded activity above a certain threshold (set to 0.2; dotted line), as a function of network size.
Figure 4:
Figure 4:. Model mismatch between teacher and student.
A Mismatch in activation functions of teacher and student neurons. B The activation function is a smooth rectification but with different degrees of smoothness, parameterized by a parameter β. Teacher RNN from Fig. 2. C Errors in the activity of recorded (left) and unrecorded (right) neurons for different values of model mismatch between teacher and student. Within a large range of mismatch we observe a decrease in the error in unrecorded neurons when M>30. D Mismatch in the connectivity between teacher and student, mimicking errors in connectome reconstruction. E Eigenvalues of the teacher and student connectivity matrices, for different levels of connectivity mismatch. F Errors in the activity of recorded (left) and unrecorded (right) neurons for different levels of mismatch in the connectivity.
Figure 5:
Figure 5:. Linear teacher-student model
A Left: The activity of a neuron is a linear mapping A(J), which depends on the connectivity matrix J, of the single neuron parameters b. Right: Neuronal activation functions are linear with heterogeneous biases. B Singular values of the connectivity matrix, which is random and has rank D=60. C Errors in activity and biases as a function of the number of recorded neurons. D Single neuron biases evolve over training through gradient descent. Parameter modes are described as stiff or sloppy based on the effect of changes along each mode near the optimal solution. E Singular value decomposition of the mapping A determines stiff and sloppy parameter modes. Stiffer modes are learned more quickly. F Effective singular value decomposition when recording from a subset of M neurons. Inset shows the maximum angle between the M stiffest modes and the M sub-sampled parameter modes. G-H Evolution of errors in activity and biases for D>M=10 and D<M=160, for 10 different initializations of parameters. Error in biases is projected along one stiff (1st) and one sloppy (50th) parameter mode.
Figure 6:
Figure 6:. Loss landscape in nonlinear networks.
A We study a rank-two RNN with two populations. Neurons in each population share the same gains and network statistics. B Dynamics of the target network. Left: Phase-space in the two-dimensional latent space. Right: Activity as a function of time for 20 sampled neurons. For illustrative purposes, neurons 1 and 2 are selected based on their alignment with the two latent variables. C The loss landscape of the full network depends only on the gains of each population, g1 and g2. White dot indicates the parameters of the teacher RNN. D Loss landscape when recording the activity of neuron 1 (left) or neuron 2 (right). Blue and red squares correspond respectively to solutions where the training loss is close to zero. E Target trajectory (black) and dynamics of the teacher RNN. Blue and red trajectories correspond to the solutions found in D. F Predicted activity for neurons 1 and 2 for the solutions found in D. Left: Error in the activity of the recorded neuron (neuron 1) is small, while error for the unrecorded neuron (neuron 2) is large. Right: Similar to left, but when neuron 2 is recorded and neuron 1 is unrecorded. G Full-rank non-linear RNN, same as in Fig. 1. H Average squared error in parameters projected on the different stiff and sloppy parameter modes. The stiff and sloppy dimensions are determined by approximating the full-sampled loss function around the teacher’s values (see Methods). Average over 10 realizations.
Figure 7:
Figure 7:. Optimal selection of recorded neurons.
A Recording from specific subsets of neurons (right) in the teacher RNN leads to different performance. B We linearized the mapping from changes in single neuron parameters to changes in neural activity. C Teacher RNN with linear single-neuron activation functions, unknown biases, and connectivity with rank D=60 (as in Fig. 5). D Error in activity of unrecorded neurons as a function of number of recorded neurons M. Lines correspond to theoretical prediction, dots to numerical simulation (mean ± SEM). We selected neurons following the estimated best ranking (red), 5 different random rankings (black), and the worst ranking (blue). E Error in recorded neurons for the same networks. F - H Analogous to C-E but for a nonlinear network. The teacher is the RNN from Fig. 2 with sparse E-I connectivity. Single-neuron parameters are both gains and biases. The linearization in the mapping from parameters to activity assumes homogeneous single-neuron parameters (see Methods).

References

    1. Das A., Fiete I. R., Systematic errors in connectivity inferred from activity in strongly recurrent networks, Nature Neuroscience 2020 23:10 23 (10) (2020) 1286–1296. - PubMed
    1. Haber A., Schneidman E., Learning the Architectural Features That Predict Functional Similarity of Neural Networks (2022).
    1. Levina A., Priesemann V., Zierenberg J., Tackling the subsampling problem to infer collective properties from limited data, Nature Reviews Physics 2022 4:12 4 (12) (2022) 770–784.
    1. Liang T., Brinkman B. A. W., Statistically inferred neuronal connections in subsampled neural networks strongly correlate with spike train covariance, bioRxiv (2023) 2023.02.01.526673. - PubMed
    1. Dinc F., Shai A., Schnitzer M., Tanaka H., CORNN: Convex optimization of recurrent neural networks for rapid inference of neural dynamics (nov 2023). arXiv:2311.10200.

Publication types