[Preprint]. 2024 Dec 24:2024.05.27.595950.
doi: 10.1101/2024.05.27.595950.

Distinct mechanisms of non-autonomous UPRER mediated by GABAergic, glutamatergic, and octopaminergic neurons

Affiliations

Distinct mechanisms of non-autonomous UPRER mediated by GABAergic, glutamatergic, and octopaminergic neurons

Aeowynn J Coakley et al. bioRxiv. .

Abstract

The capacity to deal with stress declines during the aging process, and preservation of cellular stress responses is critical to healthy aging. The unfolded protein response of the endoplasmic reticulum (UPRER) is one such conserved mechanism, which is critical for the maintenance of several major functions of the ER during stress, including protein folding and lipid metabolism. Hyperactivation of the UPRER by overexpression of the major transcription factor, xbp-1s, solely in neurons drives lifespan extension as neurons send a neurotransmitter-based signal to other tissue to activate UPRER in a non-autonomous fashion. Previous work identified serotonergic, dopaminergic, and tyraminergic neurons in this signaling paradigm. To further expand our understanding of the neural circuitry that underlies the non-autonomous signaling of ER stress, we activated UPRER solely in glutamatergic, octopaminergic, and GABAergic neurons in C. elegans and paired whole-body transcriptomic analysis with functional assays. We found that UPRER-induced signals from glutamatergic neurons increased expression of canonical protein homeostasis pathways and octopaminergic neurons promoted pathogen response pathways; while minor, statistically significant changes were observed in lipid metabolism-related genes with GABAergic UPRER activation. These findings provide further evidence for the distinct role neuronal subtypes play in driving the diverse response to ER stress.

Keywords: Aging; ER; neurons; stress.


Conflict of interest statement

Competing Financial Interests All authors of the manuscript declare that they have no competing interests.

Figures

Fig. 1.
Fig. 1.. Dopaminergic and serotonergic xbp-1s together do not recapitulate pan-neuronal xbp-1s overexpression.
A comparison of differentially expressed genes (p-value ≤ 0.01) between worms expressing xbp-1s pan-neuronally (rab-3p), and in either (A) dopaminergic (dat-1p) neurons, (B) serotonergic (tph-1p) neurons, or (C) concurrently in both dopaminergic and serotonergic (dat-1/tph-1p) neurons. For a complete list of differentially expressed genes see Table S3. For a complete list of genes represented in Venn Diagrams, see Table S4. (D) Heat map of differentially expressed genes in worms expressing xbp-1s pan-neuronally with corresponding expression levels in serotonin, dopamine, and both serotonin and dopaminergic xbp-1s expressing animals. Warmer colors indicate increased expression, and cooler colors indicate decreased expression. See Table S5 for a list of gene names and expression values. (E) Schematic of each neuronal type explored in this study: glutamatergic, eat-4p (n = 79, location: head, pharynx, ventral nerve cord and body, tail), octopaminergic, tbh-1p (n = 2, location: head), GABAergic, unc-25p (n = 32, location: head, ventral nerve cord and body, tail). (F) qPCR of transcripts of glutamatergic xbp-1s (green), octopaminergic xbp-1s (yellow), and GABAergic xbp-1s (pink) animals grown on empty vector from hatch. RNA was isolated in day 1 adults and data are compared using a standard curve with data represented as relative fold change against control. Each dot represents a biological replicate averaged across three technical replicates per sample. Lines represent geometric mean with geometric standard deviations.
Fig. 2.
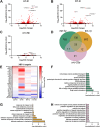
Fig. 2.. Glutamatergic, octopaminergic, and GABAergic xbp-1s modulate distinct transcriptional pathways.
Volcano plots of whole-body genome-wide changes in gene expression upon xbp-1s overexpression in (A) glutamatergic, (B) octopaminergic, and (C) GABAergic neurons. Red dots indicate significantly differentially expressed genes with p-value ≤ 0.01. See Table S3. (D) Comparison of differentially expressed genes (p-value ≤ 0.01) between worms expressing xbp-1s in glutamatergic, octopaminergic, and GABAergic neurons. For a complete list of differentially expressed genes see Table S4. (E) Heat map of XBP-1s target gene expression under neuronal, glutamatergic, octopaminergic, and GABAergic xbp-1s. Warmer colors indicate increased expression, and cooler colors indicate decreased expression. See Table S5. Top ten most enriched gene ontology terms of differentially expressed genes upon xbp-1s overexpression in (F) glutamatergic, (G) octopaminergic, and (H) GABAergic neurons. See Table S6.
Fig. 3.
Fig. 3.. Octopaminergic xbp-1s, but not glutamatergic or GABAergic xbp-1s, is sufficient to extend lifespan.
(A) Lifespan measurements of control (blue) and a mixed population of both “normal” and “stunted” growth octopaminergic xbp-1s (yellow, tbh-1p, mixed) animals. (B) Lifespan measurements of control (blue) and octopaminergic xbp-1s animals. Octopaminergic xbp-1s animals were separated into normal size (yellow, tbh-1p) and stunted growth (purple, tbh-1p, small). (C) Lifespan measurements of control (blue, light blue) and octopaminergic xbp-1s animals (tbh-1, yellow, orange) grown on either EV or xbp-1 RNAi. (D) Lifespan measurements of control (blue, light blue), glutamatergic xbp-1s animals (eat-4p, green), and GABAergic xbp-1s (unc-25p, pink) animals. Lifespans were scored every 2 days and data is representative of 3 biological replicates (N). Sample size (n) is written next to each condition followed by significance measured using Log-Rank testing: n.s. = not significant, * = p < 0.05, *** = p < 0.001. All statistical analysis is available in Table S7.
Fig. 4.
Fig. 4.. Glutamatergic, octopaminergic, and GABAergic xbp-1s enhance pathogen resistance and increases pathogen apathy.
(A) Heat map of immune response (GO:0006955) gene expression under pan-neuronal (rgef-1p), glutamatergic (eat-4p), octopaminergic (tbh-1p), and GABAergic (unc-25p) xbp-1s overexpression. Warmer colors indicate increased expression, and cooler colors indicate decreased expression. See Table S6. (B) Survival analysis of control (N2, blue), glutamatergic xbp-1s (green, eat-4p), octopaminergic xbp-1s (yellow, tbh-1p), or GABAergic xpb-1s (pink, unc-25p) on PA14 fast kill assay plates for 2, 4, 6, and 8 hours. Each fast kill assay is comprised of 3 technical replicates per biological replicate and at least 3 biological replicates per condition. Results were analyzed via two-way ANOVA test; **(p<0.01) ***(p<0.001) ****(p<0.0001). (C) Pathogen avoidance behavior of control (N2, blue), glutamatergic xbp-1s (green, eat-4p), octopaminergic xbp-1s (yellow, tbh-1p), or GABAergic xpb-1s (pink, unc-25p) during “forced” food choice assays measured at 1, 2, 3, 6, and 8 hour time points. Each forced food choice assay is comprised of 3 technical replicates per biological replicate and at least 3 biological replicates per condition. Results were analyzed via two-way ANOVA test; **(p<0.01) ***(p<0.001) ****(p<0.0001). (D) Representative brightfield and fluorescent images of adult worms grown on bacteria expressing mCherry. Animals are moved to OP50 plates for two hours to remove mCherry expressing bacteria from the intestine before imaging. Any remaining mCherry signal after OP50 clarification are signs of bacterial colonization. (E) Quantification of the percent of animals displaying intestinal bacterial colonization was performed across 2 technical replicates for each of 3 biological replicates for a total of 6 replicates. Lines represent mean and standard deviation. * = p ≤ 0.05, ** = p ≤ 0.01, ns = p > 0.05 using a Mann-Whitney test.
Fig. 5.
Fig. 5.. Glutamatergic, octopaminergic, and GABAergic xbp-1s results in depletion of lipids.
(A) Heat map of lipid homeostasis (GO:0055088) gene expression under pan-neuronal (rgef-1p), glutamatergic (eat-4p), octopaminergic (tbh-1p), and GABAergic (unc-25p) xbp-1s overexpression. Warmer colors indicate increased expression, and cooler colors indicate decreased expression. See Table S6. (B) Representative fluorescent micrographs of day 3 adult animals of control, glutamatergic xbp-1s (eat-4p), octopaminergic xbp-1s (tbh-1p), and GABAergic xpb-1s (unc-25p) taken on a stereomicroscope and on a confocal microscope (bottom). All images are contrast matched. Scale bar represents 10 um. (C) Representative images of day 3 adult animals of control, glutamatergic xbp-1s (eat-4p), octopaminergic xbp-1s (tbh-1p), and GABAergic xpb-1s (unc-25p) of ORO-stained lipids. Quantification of lipid staining as non-lipid depletion (black) and lipid depletion (gray). (D) Representative fluorescent micrographs of day 3 adult mRuby::HDEL of control, glutamatergic xbp-1s (eat-4p), and GABAergic xbp-1s (unc-25p), animals (top) or day 3 adult mCherry::HDEL of control and octopaminergic xbp-1s (tbh-1p), animals (bottom). Images are representative of three independent biological replicates and are independently contrast enhanced for each individual image. Scale bar represents 10 µm.
Fig. 6.
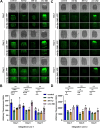
Fig. 6.. Glutamatergic, octopaminergic, and GABAergic xbp-1s enhance proteostasis.
(A) Representative images of protein aggregation in animals expressing intestinal polyglutamine repeats (vha-6p::polyQ40::YFP) in glutamatergic (eat-4p), octopaminergic (tbh-1p), or GABAergic (unc-25p) xbp-1s animals. All animals were imaged on day 1, 5, and 9 of adulthood. Images were captured using a Leica M205 stereo microscope. (B) Quantification of fluorescence integrated density normalized to area was performed across 2 technical replicates each of 3 biological replicates for a total of 6 replicates. Lines represent mean and standard deviation. * = p ≤ 0.05, ** = p ≤ 0.01, ns = p > 0.05 using a Mann-Whitney test. (C) Representative images of a second distinct integration line of glutamatergic, octopaminergic, or GABAergic xbp-1s animals expressing intestinal polyglutamine repeats (vha-6p::polyQ40::YFP) grown on EV or xbp-1s RNAi and imaged as per (A). (D) Quantification of fluorescence integrated density normalized to area was performed across 3 biological replicates. A Shapiro-Wilk test was used to determine normality and a student’s t-test was used to assess significance.

References

    1. Dutta N., Garcia G. & Higuchi-Sanabria R. Hijacking Cellular Stress Responses to Promote Lifespan. Front. Aging 3, 860404 (2022). - PMC - PubMed
    1. Taylor R. C. & Dillin A. XBP-1 Is a Cell-Nonautonomous Regulator of Stress Resistance and Longevity. Cell 153, 1435–1447 (2013). - PMC - PubMed
    1. Higuchi-Sanabria R. et al. Divergent Nodes of Non-autonomous UPRER Signaling through Serotonergic and Dopaminergic Neurons. Cell Reports 33, 108489 (2020). - PMC - PubMed
    1. Özbey N. P. et al. Tyramine Acts Downstream of Neuronal XBP-1s to Coordinate Inter-tissue UPRER Activation and Behavior in C. elegans. Developmental Cell 55, 754–770.e6 (2020). - PMC - PubMed
    1. Imanikia S., Sheng M., Castro C., Griffin J. L. & Taylor R. C. XBP-1 Remodels Lipid Metabolism to Extend Longevity. Cell Reports 28, 581–589.e4 (2019). - PMC - PubMed

Publication types