[Preprint]. 2024 May 29:2024.05.28.596257.
doi: 10.1101/2024.05.28.596257.

Piezo1 ion channels are capable of conformational signaling

Affiliations

Piezo1 ion channels are capable of conformational signaling

Amanda H Lewis et al. bioRxiv. .

Update in

Abstract

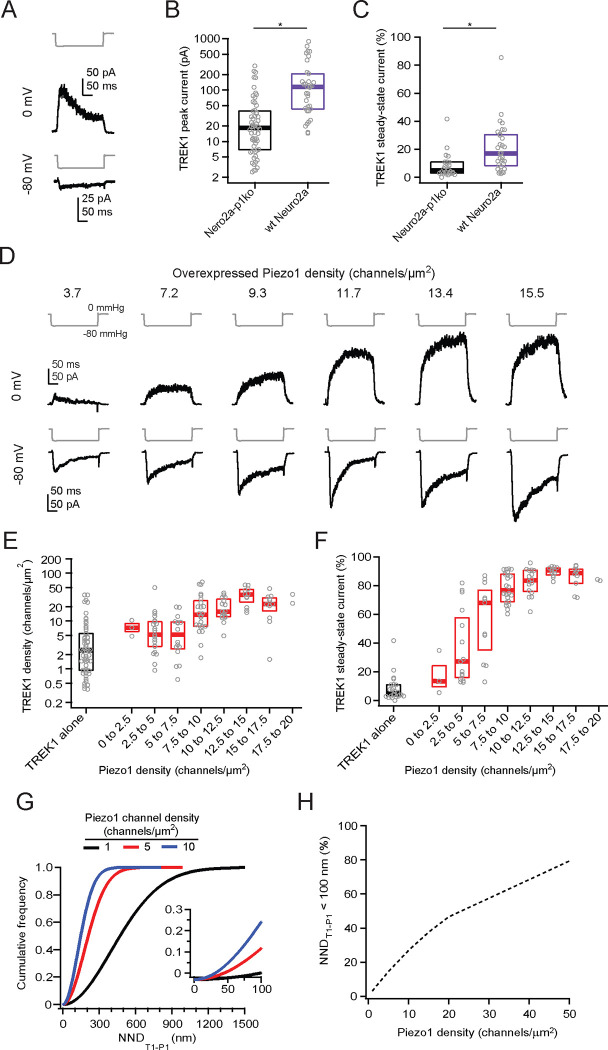
Piezo1 is a mechanically activated ion channel that senses forces with short latency and high sensitivity. Piezos undergo large conformational changes, induce far-reaching deformation onto the membrane, and modulate the function of two-pore potassium (K2P) channels. Taken together, this led us to hypothesize that Piezos may be able to signal their conformational state to other nearby proteins. Here, we use chemical control to acutely restrict Piezo1 conformational flexibility and show that Piezo1 conformational changes, but not ion permeation through it, are required for modulating the K2P channel TREK1. Super-resolution imaging and stochastic simulations further reveal that both channels do not co-localize, which implies that modulation is not mediated through direct binding interactions; however, at high Piezo1 densities, most TREK1 channels are within the predicted Piezo1 membrane footprint, suggesting the footprint may underlie conformational signaling. We speculate that physiological roles originally attributed to Piezo1 ionotropic function could, alternatively, involve conformational signaling.


Conflict of interest statement

Declaration of Interests The authors declare no competing interests.

Figures

Figure 1.
Figure 1.. Piezo1 potentiates TREK1 peak and steady-state currents.
A, Pressure protocol (gray) and currents from representative cell-attached patches from Neuro2A-Piezo1ko cells expressing Piezo1 (blue), TREK1 (black), or TREK1 + Piezo1 (red). Pressure step was to −80 mmHg and voltage was 0 mV (top) or −80 mV (bottom). B, Mean pressure-response curves at 0 mV, generated from full pressure step protocol. n=58 (TREK1), n=25 (Piezo1), n=121 (TREK1 + Piezo1). C, Box-and-whisker plot for peak outward current elicited by a pressure step to −80 mmHg at 0 mV. D, as in B, for inward currents at −80 mV. E, as in C, for currents at −80 mV F, Fold potentiation of TREK1 peak currents as a function of pressure. G, TREK1 steady-state current at −80 mmHg for cells expressing TREK1 (black, n=24) or TREK1 + Piezo1 (red, n=106). H, TREK1 10–90% rise time at 0 mV for cells expressing TREK1 (black, n=24) or TREK1 + Piezo1 (red, n=106). Significance assessed with a Mann-Whitney U test; **p < 0.0001. Error bars are ±SEM.
Figure 2.
Figure 2.. Fly Piezo potentiates TREK1 to a greater extent than mouse Piezo1.
A, Pressure protocol (gray) and currents recorded from Neuro2A-Piezo1ko cells expressing TREK1 (black), TREK1 + mouse Piezo1 (red), or TREK1 + fly Piezo (blue). Pressure step was to −80 mmHg and voltage was 0 mV (top) or −80 mV (bottom). B, Mean pressure-response curves at 0 mV, generated from full pressure step protocols for TREK1 (black, n=58), TREK1 and mouse Piezo1 (red, n=121), and TREK1 + fly Piezo (blue, n=85). C, as in B, for inward currents at −80 mV. D, Box-and-whisker plots for peak outward currents elicited by a pressure step to −80 mmHg at 0 mV. E, Box-and-whisker plots for TREK1 steady-state current at −80 mmHg for cells expressing TREK1 (black, n=24), TREK1 + mouse Piezo1 (red, n=106), and TREK1 + fly Piezo (n=79). F, Fold potentiation of TREK1 peak currents by mouse Piezo1 (red) and fly Piezo (blue). Significance assessed with a Mann-Whitney U test; **p < 0.0001. Error bars are ±SEM.
Figure 3.
Figure 3.. Piezo1 modulation of TREK1 is independent of ion permeation.
A, Pressure protocol (gray) and currents recorded from Neuro2A-Piezo1ko cells expressing TREK1 (gray), or TREK1 + Piezo1 (pink) using a Ca2+-free pipette solution, or from cells expressing Piezo19K + TREK1 using a standard pipette solution (purple). Pressure steps were to −80 mmHg and holding potential was either 0 mV (top) or −80 mV (bottom). B, Mean pressure-response curves at 0 mV, generated from full pressure protocols. n=58 (TREK1), n=13 (TREK1 no calcium), n=121 (TREK1 + Piezo1), n=22 (TREK1 + Piezo1 no calcium), n=24 (TREK1 + Piezo19K). C, as in B, for currents at −80 mV. D, Box-and-whisker plots for peak outward current elicited by a pressure step to −80 mmHg at 0 mV. E, Box-and-whisker plots for TREK1 steady-state current at −80 mmHg for cells expressing TREK1 (black, n=24), TREK1 with no calcium (gray, n=5), TREK1 + Piezo1 (red, n=106), TREK1 + Piezo1 no calcium (pink, n=20), and TREK1 + Piezo19K (purple, n=22). F, Fold potentiation of TREK1 peak currents by mouse Piezo1 (red), mouse Piezo1 no calcium (pink), and Piezo19K (purple). Significance assessed with a Mann-Whitney U test; *p < 0.001 and **p < 0.0001. Error bars are ±SEM.
Figure 4.
Figure 4.. Piezo1 conformational flexibility is specifically required for TREK1 modulation.
A, Left, top-down view of a structural model of mouse Piezo1 (PDB: 6B3R) highlighting residues R1761 and E2257 at the base of the cap domain. Inset, magnified to show interacting side chains. Right, highlighting residues A2328 and P2382. B, Pressure protocol (gray) and currents recorded from Neuro2A-Piezo1ko cells expressing TREK1 + Piezo1RE-CC in the absence (dark cyan) and presence (light cyan) of 10 mM DTT in the patch pipette. Pressure step was to −80 mmHg and voltage was 0 mV (top) or −80 mV (bottom). C, Same as in B for cells expressing TREK1 + Piezo1AP-CC. D, Mean pressure-response curves at −80 mV, generated from full pressure protocols, for cells expressing TREK1 (black, −DTT, n=58; gray, +DTT, n=13) and cells expressing TREK1 + Piezo1 (red, −DTT, n=121; pink, +DTT, n=24). E, as in D, for currents at 0 mV. F, As in D for cells expressing TREK1 + Piezo1RE-CC (dark cyan, −DTT, n=23; light cyan, + DTT, n=21) and cells expressing TREK1 + Piezo1AP-CC (dark purple, −DTT, n=26; light purple, +DTT, n=26). G, As in F, for currents at 0 mV. H, Box-and-whisker plots for peak outward currents at 0 mV and −80 mmHg. I, Box-and-whisker plots for TREK1 steady-state current at −80 mmHg for TREK1 (black, −DTT, n=24; gray, +DTT, n=4), TREK1 + Piezo1 (red, −DTT, n=106; pink, +DTT, n=20), TREK1 + Piezo1RE-CC (dark cyan, −DTT, n=11; light cyan, +DTT, n=16) and TREK1 + Piezo1AP-CC (dark purple, −DTT, n=10; light purple, +DTT, n=22). J, Fold potentiation of TREK1 peak currents by mouse Piezo1 (black), Piezo1RE-CC (cyan) and Piezo1AP-CC +DTT (purple). Significance assessed with a Mann-Whitney U test; *p < 0.001. Error bars are ±SEM.
Figure 5.
Figure 5.. TREK1 channels do not co-localize with Piezo1 channels.
A, Top left, Representative STED image from a Neuro2A-Piezo1Myc cell (cyan puncta) overexpressing TREK1HA (magenta puncta). Scale bar is 1 μm. Top right, inset showing outlines (white, yellow) of identified puncta. Scale bar is 500 nm. Bottom panels show schematized centers of mass for both Piezo1 (cyan) and TREK1 (magenta) puncta. B, Cumulative frequency distribution of Piezo1-TREK1 nearest neighbor distances (NNDP1-T1) for the image shown in A (n=344 Piezo1 puncta). C, Histogram of NNDP1-T1 for all images (n=3 cells, 580 puncta).
Figure 6.
Figure 6.. TREK1 potentiation scales with Piezo1 density.
A, Pressure protocols (gray) and currents recorded from wild-type Neuro2A cells expressing TREK1. Pressure step was to −80 mmHg and voltage was 0 mV (top) or −80 mV (bottom). B, Peak TREK1 current amplitudes for wild-type Neuro2A cells (n=34) or Neuro2A-Piezo1ko cells (n=58) overexpressing TREK1. C, TREK1 steady-state current at −80 mmHg for wild-type Neuro2A cells (n=31) or Neuro2A-Piezo1ko cells (n=24) overexpressing TREK1. D, Pressure protocols (gray) and currents recorded from Neuro2A-Piezo1ko cells overexpressing TREK1 + Piezo1 at indicated Piezo1 channel densities. Pressure step was to −80 mmHg and voltage was 0 mV (top) or −80 mV (bottom). E, TREK1 channel density as a function of Piezo1 channel density in Neuro2A-Piezo1ko cells overexpressing both channels. F, TREK1 steady-state current at −80 mmHg as a function of Piezo1 channel density. G, Cumulative frequency distributions of nearest-neighbor distances of spatially randomly distributed TREK1 channels to randomly distributed Piezo1 channels (NNDT1-P1) at Piezo1 channel densities of 1, 5, and 10 channels/μm2. H, Proportion of randomly distributed TREK1 channels with a Piezo1 channel within 100 nm (NNDT1-P1 < 100 nm) as a function of Piezo1 channel density. *p < 0.001.
Figure 7.
Figure 7.. TREK1 channels are enriched within the predicted Piezo1 footprint.
A, Top left, Representative STED image from a Neuro2A-Piezo1ko cell overexpressing TREK1HA (magenta) + Piezo1Myc(cyan). Scale bar is 1 μm. Top right, inset showing outlines (white, yellow) of identified puncta. Scale bar is 500 nm. Bottom panels show schematized centers of mass for both Piezo1 (cyan) and TREK1 (magenta) puncta. B, Schematic illustrating calculation of local Piezo density (count of cyan puncta) and nearest neighbor (NNDT1-P1, yellow highlighted punctum) for a central TREK1 punctum (magenta) within a radius of 564 nm (1/√π). C, NNDT1-P1 as a function of local Piezo density for the image shown in A. N=895 puncta. Red dashed line represents median of 1,000 simulations of randomly distributed TREK1 channels (n=894,158 puncta). D, Median NNDT1-P1 as a function of local Piezo1 density for 9 cells. E, Median NNDT1-P1 as a function of local Piezo1 density for all empirical puncta (n=3,950 puncta, N=9 cells) and simulated puncta (n=3,944,121 puncta). F, Histogram of NNDT1-P1 for all puncta (n=3,950 puncta). G-I, As in F, for TREK1 puncta with a local Piezo1 density of 1, 5 and 10 Piezo puncta/μm2. N=321, 451, and 133 puncta, respectively.

References

    1. Lewis A.H., and Grandl J. (2015). Mechanical sensitivity of Piezo1 ion channels can be tuned by cellular membrane tension. eLife 4. 10.7554/eLife.12088. - DOI - PMC - PubMed
    1. Coste B., Mathur J., Schmidt M., Earley T.J., Ranade S., Petrus M.J., Dubin A.E., and Patapoutian A. (2010). Piezo1 and Piezo2 are essential components of distinct mechanically activated cation channels. Science 330, 55–60. 10.1126/science.1193270. - DOI - PMC - PubMed
    1. Chen X., Wanggou S., Bodalia A., Zhu M., Dong W., Fan J.J., Yin W.C., Min H.K., Hu M., Draghici D., et al. (2018). A Feedforward Mechanism Mediated by Mechanosensitive Ion Channel PIEZO1 and Tissue Mechanics Promotes Glioma Aggression. Neuron 100, 799–815 e797. 10.1016/j.neuron.2018.09.046. - DOI - PubMed
    1. Hu J., Chen Q., Zhu H., Hou L., Liu W., Yang Q., Shen H., Chai G., Zhang B., Chen S., et al. (2023). Microglial Piezo1 senses Abeta fibril stiffness to restrict Alzheimer’s disease. Neuron 111, 15–29 e18. 10.1016/j.neuron.2022.10.021. - DOI - PubMed
    1. Hill R.Z., Loud M.C., Dubin A.E., Peet B., and Patapoutian A. (2022). PIEZO1 transduces mechanical itch in mice. Nature 607, 104–110. 10.1038/s41586-022-04860-5. - DOI - PMC - PubMed

Publication types