[Preprint]. 2025 May 29:2024.05.25.595864.
doi: 10.1101/2024.05.25.595864.

Photoreceptor loss does not recruit neutrophils despite strong microglial activation

Affiliations

Photoreceptor loss does not recruit neutrophils despite strong microglial activation

Derek Power et al. bioRxiv. .

Update in

Abstract

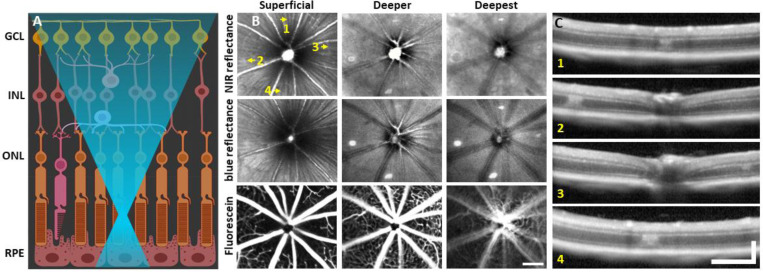
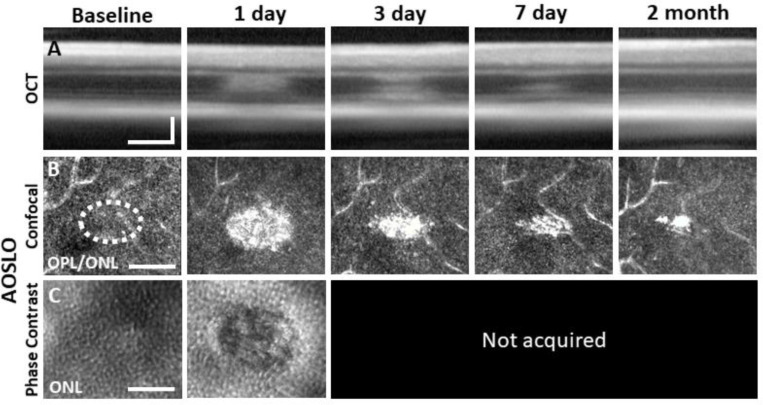
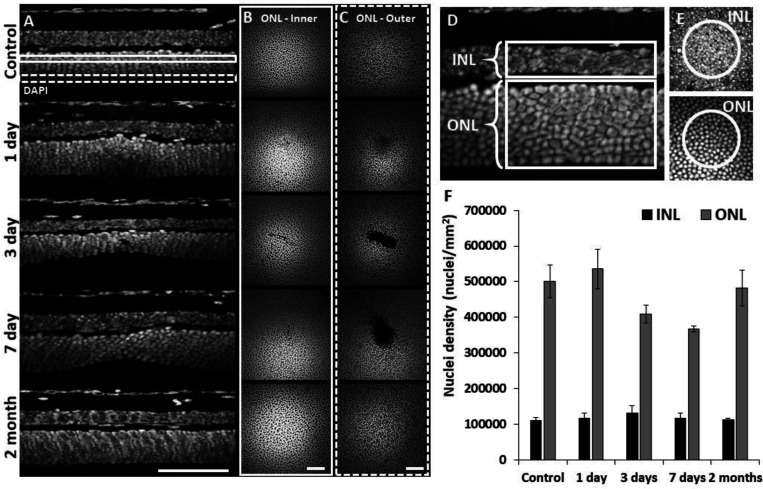
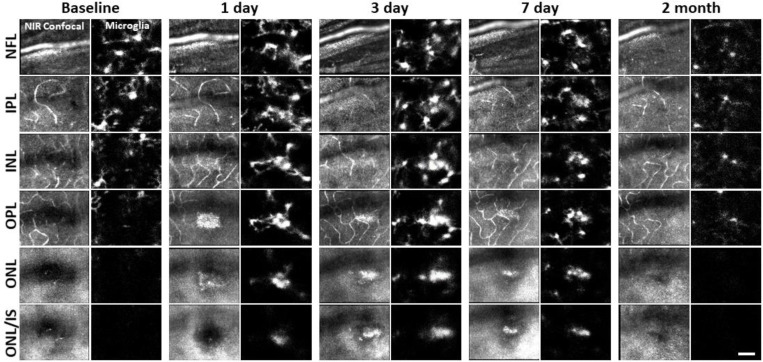
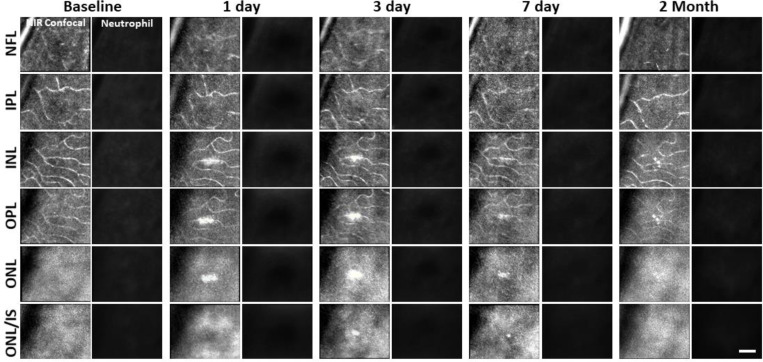
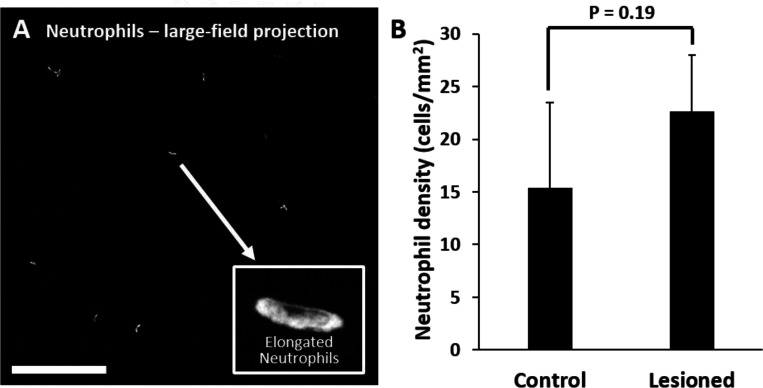
In response to central nervous system (CNS) injury, tissue resident immune cells such as microglia and circulating systemic neutrophils are often first responders. The degree to which these cells interact in response to CNS damage is poorly understood, and even less so, in the neural retina which poses a challenge for high resolution imaging in vivo. In this study, we deploy fluorescence adaptive optics scanning light ophthalmoscopy (AOSLO) to study microglia and neutrophils in mice. We simultaneously track immune cell dynamics using label-free phase-contrast AOSLO at micron-level resolution. Retinal lesions were induced with 488 nm light focused onto photoreceptor (PR) outer segments. These lesions focally ablated PRs, with minimal collateral damage to cells above and below the plane of focus. We used in vivo (AOSLO, SLO and OCT) imaging to reveal the natural history of the microglial and neutrophil response from minutes-to-months after injury. While microglia showed dynamic and progressive immune response with cells migrating into the injury locus within 1-day after injury, neutrophils were not recruited despite close proximity to vessels carrying neutrophils only microns away. Post-mortem confocal microscopy confirmed in vivo findings. This work illustrates that microglial activation does not recruit neutrophils in response to acute, focal loss of PRs, a condition encountered in many retinal diseases.


Conflict of interest statement

Portions of this work were funded by a collaborative grant from Genentech, Inc. (Elstrott) to examine the extent to which immune cells could be studied in the deep retina using adaptive optics. Schallek also has six patents held through the University of Rochester on adaptive optics technology.

Figures

Figure 1.
Figure 1.
Laser injury assessed with commercial SLO and OCT. (A) 488 nm light is focused onto the photoreceptor outer segments using AOSLO. Created with Biorender.com. (B) 30° SLO images of NIR reflectance, blue reflectance and fluorescein angiography of a mouse retina 1 day after laser exposure. Three focal planes are shown. NIR and blue reflectance reveal small hyperreflective regions below the superficial plane. Fluorescein reveals intact vasculature with no sign of leakage. Arrows indicate regions with imparted laser damage (1–4). (C) OCT B-scans passing through laser-exposed regions indicated in B. Exposures produced a focal hyperreflective band within the ONL with adjacent retina appearing healthy. OCT images were spatially averaged (~30 μm, 3 B-scans). Scale bars = 200 μm horizontal, 200 μm vertical.
Figure 2.
Figure 2.
Laser damage temporally tracked with AOSLO and OCT. Laser-exposed retina was tracked with OCT (A), confocal (B) and phase-contrast (C) AOSLO for baseline, 1, 3, 7 day and 2 month time points. OCT and confocal AOSLO display a hyperreflective phenotype that was largest/brightest at 1 day and became nearly invisible by 2 months. Dashed oval indicates region targeted for laser injury. Phase-contrast AOSLO revealed disrupted photoreceptor soma’s 1 day after laser injury. Phase contrast data was not acquired for remaining time points due to development of cataract which obscured the phase contrast signal. OCT images were spatially averaged (~30 μm, 8 B-scans). Scale bars = 40 μm horizontal, 100 μm vertical.
Figure 3.
Figure 3.
Retinal histology confirms photoreceptor ablation and preservation of inner retinal cells. Cross sectional view (A) and en-face (B+C) images of DAPI-stained whole-mount retinas at laser injury locations over time. By 1 day, ONL becomes thicker at lesion location, but thinner by 3 and 7 days. By 2 months, the ONL appeared similar to that of control. The inner (B, solid rectangle) and outer (C, dashed rectangle) stratum of ONL show axial differences in ONL loss. Most cell loss was seen in the outer aspect of the ONL (C). Scale bars = 40 μm. (D) Cross section of DAPI-stained retina displaying INL and ONL regions for quantification. Each analysis region was 50 μm across and encompassed the entire depth of the INL or ONL. (E) En-face images show 50 μm diameter circles used for analysis. (F) Nuclei density for control and post-injury time points. ONL nuclei were reduced at 3 and 7 days (p = 0.17 and 0.07 respectively) while INL density remained stable (n = 10 mice, 3 unique regions per time point). Error bars display mean ± 1 SD.
Figure 4.
Figure 4.
Motion-contrast images reveal vascular perfusion status in response to laser damage. A single location was tracked over time at three vascular plexuses using AOSLO. Retinal vasculature remained perfused for all time points tracked and at all depths. White oval indicates damage location. Scale bar = 40 μm.
Figure 5.
Figure 5.
Microglial response 1 day after laser injury imaged in vivo with fluorescence SLO and AOSLO. (A) Left: Deep-focus NIR SLO fundus image (55° FOV) of laser-injured retina. White arrowheads point to damaged locations showing hyperreflective regions. Inset scale bar = 40 μm. Right: Fluorescence fundus image from same location. Fluorescent CX3CR1-GFP microglia are distributed across the retina and show congregations at laser-damaged locations. Scale bar = 200 μm. (B) Magnified SLO images of microglia at laser-damaged and control locations (indicated in A, right, white boxes). Control location displays distributed microglial whereas microglia at the lesion location are bright and focally aggregated. (C) Fluorescence AOSLO images show greater detail of cell morphology at the same scale. In control locations microglia showed ramified morphology and distributed concentration whereas damage locations revealed dense aggregation of many microglia that display less ramification. Scale bars = 40 μm.
Figure 6.
Figure 6.
Microglial response to laser injury tracked with AOSLO. Simultaneously acquired NIR confocal and fluorescence AOSLO images across different retinal depths. Data are from one CX3CR1-GFP mouse tracked for 2 months. Microglia swarm to hyperreflective locations within 1 day. Microglia maintain an aggregated density for days and resolve by 2 months after damage. Scale bar = 40 μm.
Figure 7.
Figure 7.
Neutrophil morphology imaged in vivo using AOSLO. (A) Phase-contrast, motion-contrast and fluorescence AOSLO reveal the impact of passing neutrophils on single capillaries. A rare and exemplary event shows a neutrophil transiently impeding capillary blood flow for minutes in healthy retina. Scale bar = 40 μm. (B) In-vivo AOSLO and ex-vivo fluorescence microscopy show neutrophils in two states. Neutrophils within capillaries displayed elongated, tubular morphology. Extravasated neutrophils were more spherical. Bottom images show extravasated neutrophils in response to an EIU model for comparison (not laser damage model). Scale bar = 20 μm.
Figure 8.
Figure 8.
Neutrophil response to laser injury tracked with AOSLO. A single retinal location was tracked in a Catchup mouse from baseline to 2 months after lesion. Location of the lesion is apparent at 1 and 3 days post injury with diminishing visibility after 1 week. We did not observe stalled, aggregated or an accumulation of neutrophils at any time point. This evaluation was confirmed at multiple depths ranging from the NFL to the ONL. Scale bar = 40 μm.
Figure 9.
Figure 9.
Neutrophil and microglial behavior after laser injury, as observed through ex vivo confocal microscopy. (A) En-face max intensity projection images of inner and outer (separated by approximate INL center) retinal microglia/neutrophils in Ly-6G-647-stained CX3CR1-GFP retinas. Microglia display focal aggregation in the outer retina for 1, 3 and 7 day time points that is resolved by 2 months. Neutrophils do not aggregate or colocalize to the injury location at any time point. Z-stacks were collected from 5 mice for the indicated time points. (B) Cross-sectional views of en-face z-stacks presented in A, including DAPI nuclear label. White dotted line indicates 100 μm region expanded below. Microglia migrate into the ONL by 1, 3 and 7 days post-laser injury and return to an axial distribution similar to that of control by 2 months. The few neutrophils detected remained within the inner retina. Scale bars = 40 μm. (C) Orthogonal view of DAPI-stained retina with Ly-6G-647-labelled overlay 1 day post-laser-injury. In a rare example, 2 neutrophils are found within the IPL/OPL layers despite a nearby outer retinal laser lesion. Scale bar = 20 μm. (D) Magnified 3D cubes representing cell 1 and 2 in C. Cell 1 displays pill-shaped morphology and cell 2 is localized to a putative capillary branch-point. Each are confined within vessels suggesting they do not extravasate in response to laser injury.
Figure 10.
Figure 10.
Quantification of neutrophils in laser damaged retinas assessed with ex vivo confocal microscopy over a wide-field. (A) Representative image (maximum intensity projection) displays neutrophils quantified using large-field (796 × 796 μm) z-stacks for control or 1 day after injury time points. In both control and laser injured retinas, neutrophils were sparse and confined to locations within capillaries suggesting they were the native fraction of circulating neutrophils at time of death. Inset displays expanded image of a single neutrophil. Scale bar = 200 μm. (B) Neutrophils quantified and displayed as the number of neutrophils per retinal area. The difference in number of neutrophils in control vs lesioned retinas was not statistically significant (p = 0.19). Error bars display mean + 1 SD.

Similar articles

References

    1. Stone J. et al. Mechanisms of photoreceptor death and survival in mammalian retina. Progress in Retinal and Eye Research 18, 689–735 (1999). - PubMed
    1. García-Ayuso D., Di Pierdomenico J., Vidal-Sanz M. & Villegas-Pérez M. P. Retinal Ganglion Cell Death as a Late Remodeling Effect of Photoreceptor Degeneration. Int J Mol Sci 20, 4649 (2019). - PMC - PubMed
    1. Boycott B. B. & Hopkins J. M. Microglia in the retina of monkey and other mammals: its distinction from other types of glia and horizontal cells. Neuroscience 6, 679–688 (1981). - PubMed
    1. Silverman S. M. & Wong W. T. Microglia in the Retina: Roles in Development, Maturity, and Disease. Annual Review of Vision Science 4, 45–77 (2018). - PubMed
    1. Wang X. et al. Requirement for Microglia for the Maintenance of Synaptic Function and Integrity in the Mature Retina. J. Neurosci. 36, 2827–2842 (2016). - PMC - PubMed

Publication types