

Whole-genome resequencing reveals genomic variation and dynamics in Ethiopian indigenous goats
- PMID: 38854428
- PMCID: PMC11156998
- DOI: 10.3389/fgene.2024.1353026
Whole-genome resequencing reveals genomic variation and dynamics in Ethiopian indigenous goats
Abstract
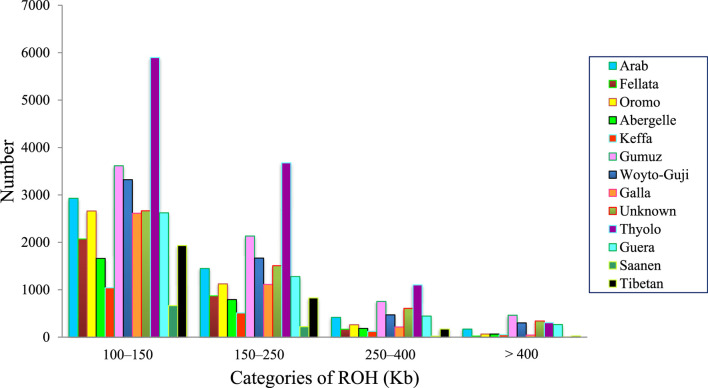
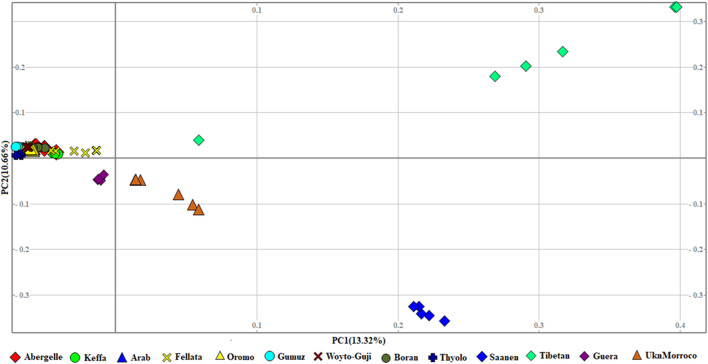
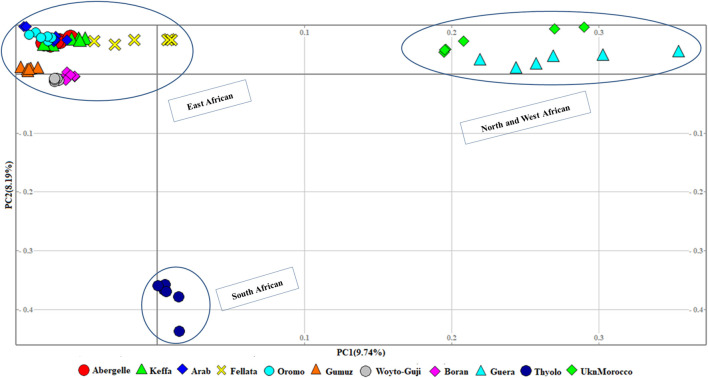
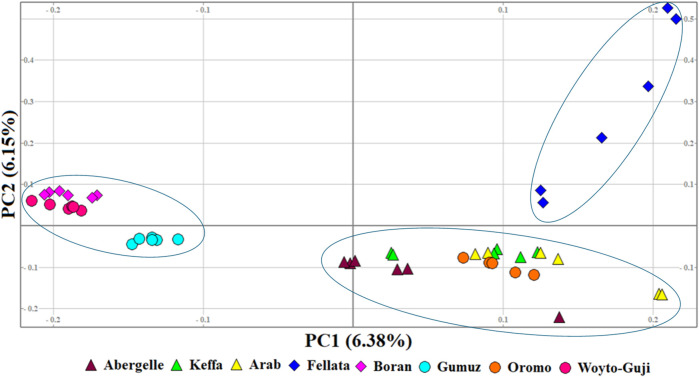
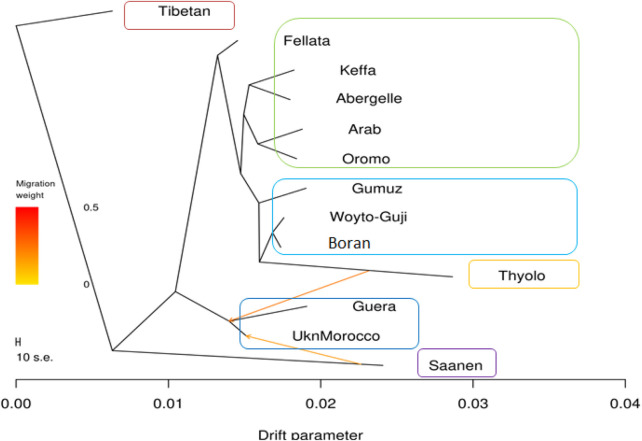
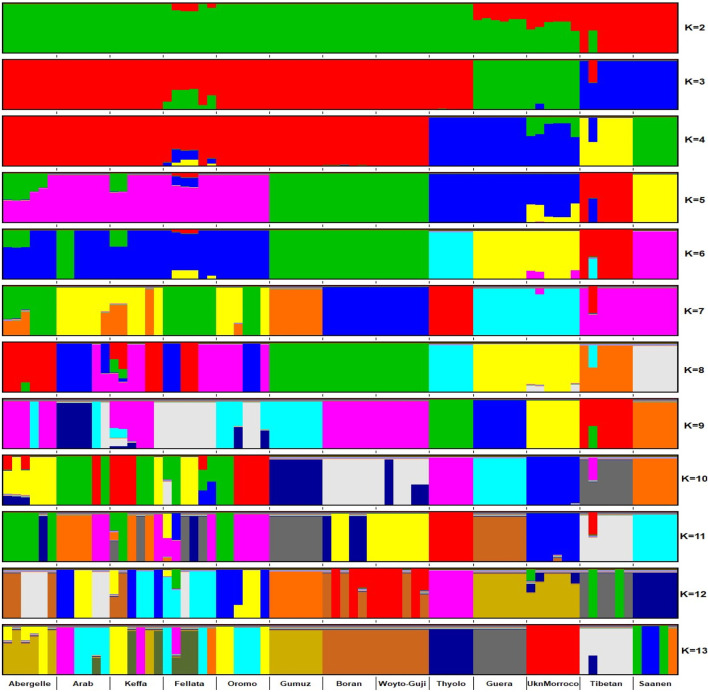
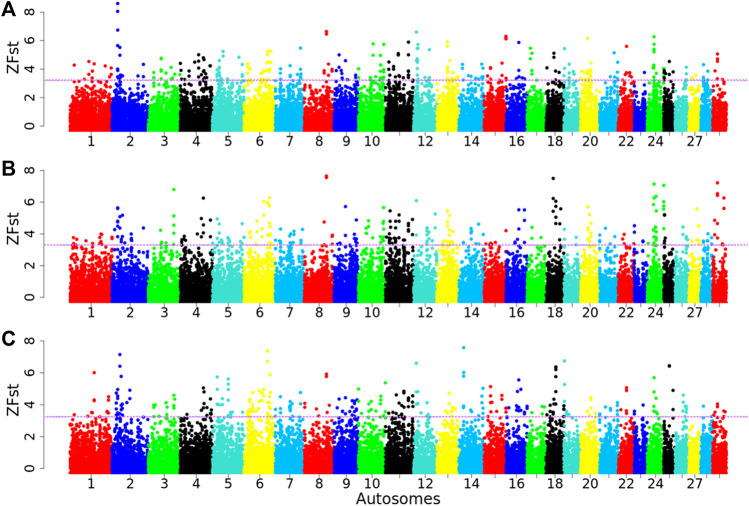
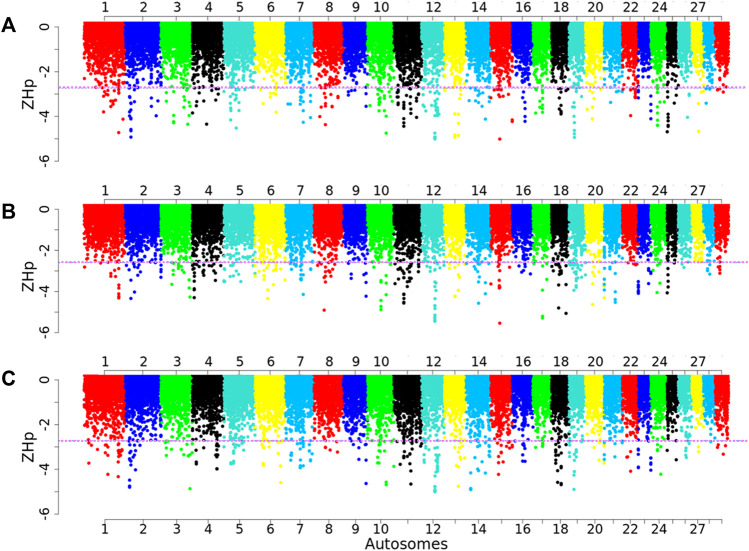
Ethiopia has about 52 million indigenous goats with marked phenotypic variability, which is the outcome of natural and artificial selection. Here, we obtained whole-genome sequence data of three Ethiopian indigenous goat populations (Arab, Fellata, and Oromo) from northwestern Ethiopia and analyzed their genome-wide genetic diversity, population structure, and signatures of selection. We included genotype data from four other Ethiopian goat populations (Abergelle, Keffa, Gumuz, and Woyto-Guji) and goats from Asia; Europe; and eastern, southern, western, and northern Africa to investigate the genetic predisposition of the three Ethiopian populations and performed comparative genomic analysis. Genetic diversity analysis showed that Fellata goats exhibited the lowest heterozygosity values (Ho = 0.288 ± 0.005 and He = 0.334 ± 0.0001). The highest values were observed in Arab goats (Ho = 0.310 ± 0.010 and He = 0.347 ± 4.35e-05). A higher inbreeding coefficient (FROH = 0.137 ± 0.016) was recorded for Fellata goats than the 0.105 ± 0.030 recorded for Arab and the 0.112 ± 0.034 recorded for Oromo goats. This indicates that the Fellata goat population should be prioritized in future conservation activities. The three goat populations showed the majority (∼63%) of runs of homozygosity in the shorter (100-150 Kb) length category, illustrating ancient inbreeding and/or small founder effects. Population relationship and structure analysis separated the Ethiopian indigenous goats into two distinct genetic clusters lacking phylogeographic structure. Arab, Fellata, Oromo, Abergelle, and Keffa represented one genetic cluster. Gumuz and Woyto-Guji formed a separate cluster and shared a common genetic background with the Kenyan Boran goat. Genome-wide selection signature analysis identified nine strongest regions spanning 163 genes influencing adaptation to arid and semi-arid environments (HOXC12, HOXC13, HOXC4, HOXC6, and HOXC9, MAPK8IP2), immune response (IL18, TYK2, ICAM3, ADGRG1, and ADGRG3), and production and reproduction (RARG and DNMT1). Our results provide insights into a thorough understanding of genetic architecture underlying selection signatures in Ethiopian indigenous goats in a semi-arid tropical environment and deliver valuable information for goat genetic improvement, conservation strategy, genome-wide association study, and marker-assisted breeding.
Keywords: Africa; Capra hircus; genome dynamics; pooled heterozygosity; population differentiation; whole genome.
Copyright © 2024 Sheriff, Ahbara, Haile, Alemayehu, Han and Mwacharo.
Conflict of interest statement
The authors declare that the research was conducted in the absence of any commercial or financial relationships that could be construed as a potential conflict of interest. The author(s) declared that they were an editorial board member of Frontiers, at the time of submission. This had no impact on the peer review process and the final decision.
Figures
Similar articles
-
Molecular characterization of Ethiopian indigenous goat populations.Trop Anim Health Prod. 2012 Aug;44(6):1239-46. doi: 10.1007/s11250-011-0064-2. Epub 2012 Jan 12. Trop Anim Health Prod. 2012. PMID: 22237413
-
Whole Genome Resequencing Reveals Selection Signatures Associated With Important Traits in Ethiopian Indigenous Goat Populations.Front Genet. 2019 Nov 28;10:1190. doi: 10.3389/fgene.2019.01190. eCollection 2019. Front Genet. 2019. PMID: 31850061 Free PMC article.
-
Production systems and breeding practices of Arab and Oromo goat keepers in northwestern Ethiopia: implications for community-based breeding programs.Trop Anim Health Prod. 2020 May;52(3):1467-1478. doi: 10.1007/s11250-019-02150-3. Epub 2019 Dec 5. Trop Anim Health Prod. 2020. PMID: 31807983
-
Genomic advancements in goat breeding: enhancing productivity, disease resistance, and sustainability in India's rural economy.Mamm Genome. 2025 May 28. doi: 10.1007/s00335-025-10138-8. Online ahead of print. Mamm Genome. 2025. PMID: 40434651 Review.
-
A Review on Indigenous Goats of East Africa: A Case for Conservation and Management.Biology (Basel). 2024 Jun 5;13(6):419. doi: 10.3390/biology13060419. Biology (Basel). 2024. PMID: 38927299 Free PMC article. Review.
Cited by
-
Genomic Tools for Medicinal Properties of Goat Milk for Cosmetic and Health Benefits: A Narrative Review.Int J Mol Sci. 2025 Jan 22;26(3):893. doi: 10.3390/ijms26030893. Int J Mol Sci. 2025. PMID: 39940662 Free PMC article. Review.
-
Schistosoma japonicum in Ethiopia: Is there a need for tuning schistosomiasis surveillance in Africa?PLoS Negl Trop Dis. 2025 Aug 13;19(8):e0013425. doi: 10.1371/journal.pntd.0013425. eCollection 2025 Aug. PLoS Negl Trop Dis. 2025. PMID: 40802857 Free PMC article.
-
Examination of Runs of Homozygosity Distribution Patterns and Relevant Candidate Genes of Potential Economic Interest in Russian Goat Breeds Using Whole-Genome Sequencing.Genes (Basel). 2025 May 24;16(6):631. doi: 10.3390/genes16060631. Genes (Basel). 2025. PMID: 40565522 Free PMC article.
References
-
- Abegaz S. K., Mwai O., Grum G., Haile A., Rischkowsky B., Solomon G., et al. (2014). “Review of goat research and development projects in Ethiopia,” in ILRI project report (Nairobi, Kenya: International Livestock Research Institute; ).
-
- Alfonzo E. P. M., Barbosa Da Silva M. V. G., Dos Santos Daltro D., Stumpf M. T., Dalcin V. C., Kolling G., et al. (2016). Relationship between physical attributes and heat stress in dairy cattle from different genetic groups. Int. J. Biometeorol. 60, 245–253. 10.1007/s00484-015-1021-y - DOI - PubMed
LinkOut - more resources
Full Text Sources
Miscellaneous