. 2024 Jun:8:100074.
doi: 10.1016/j.jmccpl.2024.100074. Epub 2024 Apr 7.

Monitoring mitochondrial calcium in cardiomyocytes during coverslip hypoxia using a fluorescent lifetime indicator

Affiliations

Monitoring mitochondrial calcium in cardiomyocytes during coverslip hypoxia using a fluorescent lifetime indicator

Yusuf Mastoor et al. J Mol Cell Cardiol Plus. 2024 Jun.

Abstract

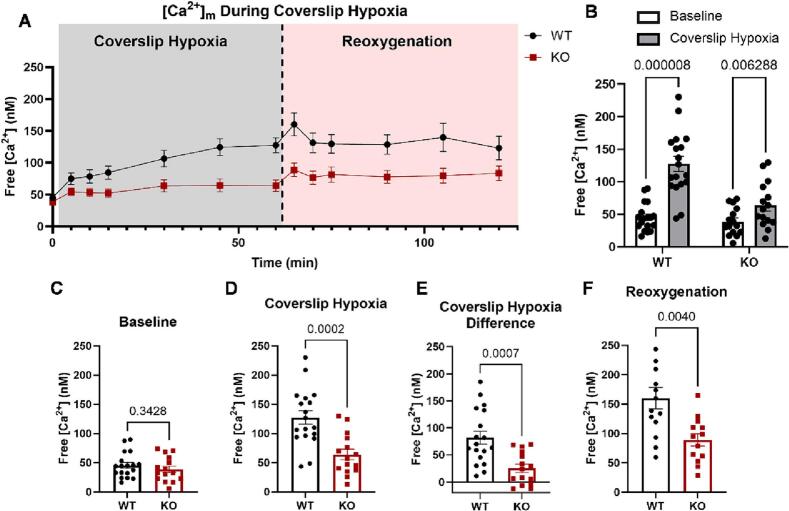
An increase in mitochondrial calcium via the mitochondrial calcium uniporter (MCU) has been implicated in initiating cell death in the heart during ischemia-reperfusion (I/R) injury. Measurement of calcium during I/R has been challenging due to the pH sensitivity of indicators coupled with the fall in pH during I/R. The development of a pH-insensitive indicator, mitochondrial localized Turquoise Calcium fluorescence Lifetime Sensor (mito-TqFLITS), allows for quantifying mitochondrial calcium during I/R via fluorescent lifetime imaging. Mitochondrial calcium was monitored using mito-TqFLITS, in neonatal mouse ventricular myocytes (NMVM) isolated from germline MCU-KO mice and MCUfl/fl treated with CRE-recombinase to acutely knockout MCU. To simulate ischemia, a coverslip was placed on a monolayer of NMVMs to prevent access to oxygen and nutrients. Reperfusion was induced by removing the coverslip. Mitochondrial calcium increases threefold during coverslip hypoxia in MCU-WT. There is a significant increase in mitochondrial calcium during coverslip hypoxia in germline MCU-KO, but it is significantly lower than in MCU-WT. We also found that compared to WT, acute MCU-KO resulted in no difference in mitochondrial calcium during coverslip hypoxia and reoxygenation. To determine the role of mitochondrial calcium uptake via MCU in initiating cell death, we used propidium iodide to measure cell death. We found a significant increase in cell death in both the germline MCU-KO and acute MCU-KO, but this was similar to their respective WTs. These data demonstrate the utility of mito-TqFLITS to monitor mitochondrial calcium during simulated I/R and further show that germline loss of MCU attenuates the rise in mitochondrial calcium during ischemia but does not reduce cell death.

Keywords: calcium; cardioprotection; cell death; fluorescent lifetime imaging; ischemia-reperfusion; mitochondria.


Conflict of interest statement

Declaration of interests The authors declare that they have no known competing financial interests or personal relationships that could have appeared to influence the work reported in this paper.

Figures

Fig. 1
Fig. 1
TqFLITS, a pH-insensitive indicator, localizes to the mitochondria. (A) Representative confocal microscopy images of TqFLITS localized to the nucleus, cytosol, and mitochondria of transfected HEK293 cells. Scale bar = 20 μm. (B) Lifetime of HEK293 cells with nuclear (n = 3), cytosolic (n = 3), and mitochondrial (n = 2) TqFLITS at baseline and after ionomycin treatment. Two cells were chosen per frame for each biological replicate, and the measured intensity-weighted lifetimes were averaged. (C) Decay curve of HEK293 cells expressing mito-TqFLITS with and without ionomycin treatment. (D) Calcium calibration curve for mito-TqFLITS at pH 7.2 (n = 3) and at pH 6.4 (n = 4) in iPSC-derived cardiomyocytes. (E) Western blot of isolated NMVMs demonstrating no expression of MCU in MCU-KO cells (n = 2). (F) Colocalization of MitoTracker Deep Red with mito-TqFLITS in isolated MCU-WT and MCU-KO NMVMs. Scale bar = 20 μm. Data represented as mean ± SEM and statistical significance for (B) determined via unpaired t-test. (For interpretation of the references to colour in this figure legend, the reader is referred to the web version of this article.)
Fig. 2
Fig. 2
MCU-KO mitigated the increase in mito-TqFLITS lifetime during coverslip hypoxia and reoxygenation. (A) Representative fast FLIM images and scale bar of MCU-WT and MCU-KO NMVM expressing mito-TqFLITS during coverslip hypoxia. Scale bar = 30 μm. (B) Intensity weighted lifetime of mito-TqFLITS throughout coverslip hypoxia and reoxygenation. Coverslip hypoxia was induced after baseline for 60 min, after which reoxygenation was induced. MCU-WT n = 18, MCU KO, n = 15 biological replicates (C) Intensity weighted lifetime for MCU-WT and MCU-KO NMVM at baseline and after 60 min of coverslip hypoxia. Intensity weighted lifetime of MCU-WT and MCU-KO NMVM at (D) baseline and (E) 60 min of coverslip hypoxia. (F) Difference in intensity weighted lifetime between MCU-WT and MCU-KO NMVM from baseline to 60 min of coverslip hypoxia. (G) Intensity weighted lifetime of MCU-WT and MCU-KO NMVM at five minutes of reoxygenation. Data represented as mean ± SEM and statistical significance for (C) determined via a Wilcoxon matched-pairs signed rank test and for (D-G) via a Mann-Whitney test.
Fig. 3
Fig. 3
MCU-KO mitigated the increase in mitochondrial calcium during coverslip hypoxia and reoxygenation. (A) Free calcium concentrations of MCU-WT and MCU-KO NMVM throughout coverslip hypoxia and reoxygenation. MCU-WT n = 18, MCU KO n = 15 biological replicates (B) Free calcium concentrations for MCU-WT and MCU-KO NMVM at baseline and after 60 min of coverslip hypoxia. Free calcium concentrations of MCU-WT and MCU-KO NMVM at (C) baseline and (D) 60 min of coverslip hypoxia. (E) Difference in free calcium concentrations between MCU-WT and MCU-KO NMVM from baseline to 60 min of coverslip hypoxia. (F) Free calcium concentration of MCU-WT and MCU-KO NMVM at five minutes of reoxygenation. Data represented as mean ± SEM and statistical significance for (B) determined a Wilcoxon matched-pairs signed rank test and for (C—F) via a Mann-Whitney test.
Fig. 4
Fig. 4
MCU-KO did not alter cell death during coverslip hypoxia and reoxygenation. (A) Representative confocal microscopy images of MCU-WT and MCU-KO labeled for nuclei (Hoechst, blue) and dead cells (Propidium Iodide, red) and loaded with mito-TqFLITS (cyan) throughout coverslip hypoxia. Scale bar = 30 μm. (B) Percent of PI-positive nuclei throughout coverslip hypoxia. MCU WT n = 6, MCU KO n = 6 biological replicates. Percent of PI-positive nuclei at (C) 60 min of coverslip hypoxia and (D) 60 min of reoxygenation. (E) Percent of PI-positive nuclei from baseline to 60 min of coverslip hypoxia. (F) Percent of PI-positive nuclei from baseline to 60 min of reoxygenation. Data represented as mean ± SEM and statistical significance for (C, D) determined via a Wilcoxon matched-pairs signed rank test and for (E, F) via a Mann-Whitney test. (For interpretation of the references to colour in this figure legend, the reader is referred to the web version of this article.)
Fig. 5
Fig. 5
Acute MCU-KO did not alter mito-TqFLITS lifetime during coverslip hypoxia and reoxygenation. (A) Western blot of isolated MCUfl/fl NMVMs treated with either adenovirus expressing CRE-recombinase (Ad-CRE, MCUfl/fl KO) or β-galactosidase (Ad-βgal, MCUfl/fl WT) demonstrating decreased expression of MCU in MCUfl/fl KO cells (n = 2). (B) Intensity weighted lifetime of mito-TqFLITS throughout coverslip hypoxia and reoxygenation. Coverslip hypoxia was induced after baseline for 60 min, after which reoxygenation was induced. MCUfl/fl WT n = 6, MCUfl/fl KO, n = 7 biological replicates. (C) Intensity weighted lifetime for MCUfl/fl WT and MCUfl/fl KO NMVM at baseline and after 60 min of coverslip hypoxia. Intensity weighted lifetime of MCUfl/fl WT and MCUfl/fl KO NMVM at (E) baseline and (F) 60 min of coverslip hypoxia. (G) Difference in intensity weighted lifetime between MCUfl/fl WT and MCUfl/fl KO NMVM from baseline to 60 min of coverslip hypoxia. (H) Intensity weighted lifetime of MCUfl/fl WT and MCUfl/fl KO NMVM at five minutes of reoxygenation. Data represented as mean ± SEM and statistical significance for (D) determined via a Wilcoxon matched-pairs signed rank test and for (E-H) a Mann-Whitney test.
Fig. 6
Fig. 6
Acute MCU-KO did not alter mitochondrial calcium accumulation during coverslip hypoxia and reoxygenation. (A) Free calcium concentrations of MCUfl/fl WT and MCUfl/fl KO NMVM throughout coverslip hypoxia and reoxygenation. MCUfl/fl WT n = 6, MCUfl/fl KO n = 7 biological replicates (B) Free calcium concentrations for MCUfl/fl WT and MCUfl/fl KO NMVM at baseline and after 60 min of coverslip hypoxia. Free calcium concentrations of MCUfl/fl WT and MCUfl/fl KO NMVM at (C) baseline and (D) 60 min of coverslip hypoxia. (E) Difference in free calcium concentrations between MCU-WT and MCU-KO NMVM from baseline to 60 min of coverslip hypoxia. (F) Free calcium concentration of MCU-WT and MCU-KO NMVM at five minutes of reoxygenation. Data represented as mean ± SEM and statistical significance for (B) determined via a Wilcoxon matched-pairs signed rank test and for (C—F) a Mann-Whitney test.
Fig. 7
Fig. 7
Acute MCU-KO did not alter cell death during coverslip hypoxia and reoxygenation. (A) Representative confocal microscopy images of MCUfl/fl WT and MCUfl/fl KO NMVM labeled for nuclei (Hoechst, blue) and dead cells (Propidium Iodide, red) and loaded with mito-TqFLITS (cyan) throughout coverslip hypoxia and reoxygenation. Scale bar = 30 μm. (B) Percent of PI-positive nuclei throughout coverslip hypoxia and reoxygenation. MCUfl/fl WT n = 6, MCUfl/fl KO n = 7 biological replicates. Percent of PI-positive nuclei at (C) 60 min of coverslip hypoxia and (D) 60 min of reoxygenation. (E) Percent of PI-positive nuclei from baseline to 60 min of coverslip hypoxia. (F) Percent of PI-positive nuclei from baseline to 60 min of reoxygenation. Data represented as mean ± SEM and statistical significance for (C, D) determined via a Wilcoxon matched-pairs signed rank test and for (E, F) via a Mann-Whitney test. (For interpretation of the references to colour in this figure legend, the reader is referred to the web version of this article.)

Similar articles

Cited by

References

    1. Murphy E., Perlman M., London R.E., Steenbergen C. Amiloride delays the ischemia-induced rise in cytosolic free calcium. Circ Res. 1991;68(5):1250–1258. - PubMed
    1. Steenbergen C., Murphy E., Levy L., London R.E. Elevation in cytosolic free calcium-concentration early in myocardial-ischemia in perfused rat-heart. Circ Res. 1987;60(5):700–707. - PubMed
    1. Garcia-Dorado D., Ruiz-Meana M., Inserte J., Rodriguez-Sinovas A., Piper H.M. Calcium-mediated cell death during myocardial reperfusion. Cardiovasc Res. 2012;94(2):168–180. - PubMed
    1. Halestrap A.P. Calcium, mitochondria and reperfusion injury: a pore way to die. Biochem. Soc. T. 2006;34:232–237. - PubMed
    1. Pan X., Liu J., Nguyen T., Liu C.Y., Sun J.H., Teng Y.J., et al. The physiological role of mitochondrial calcium revealed by mice lacking the mitochondrial calcium uniporter. Nat Cell Biol. 2013;15(12):1464-+. - PMC - PubMed