. 2024 Jun 7;6(3):e00194.
doi: 10.1097/BS9.0000000000000194. eCollection 2024 Jul.

High percentage of bone marrow CD8+ tissue-resident-like memory T cells predicts inferior survival in patients with acute myeloid leukemia

Affiliations

High percentage of bone marrow CD8+ tissue-resident-like memory T cells predicts inferior survival in patients with acute myeloid leukemia

Letong Cai et al. Blood Sci. .

Abstract

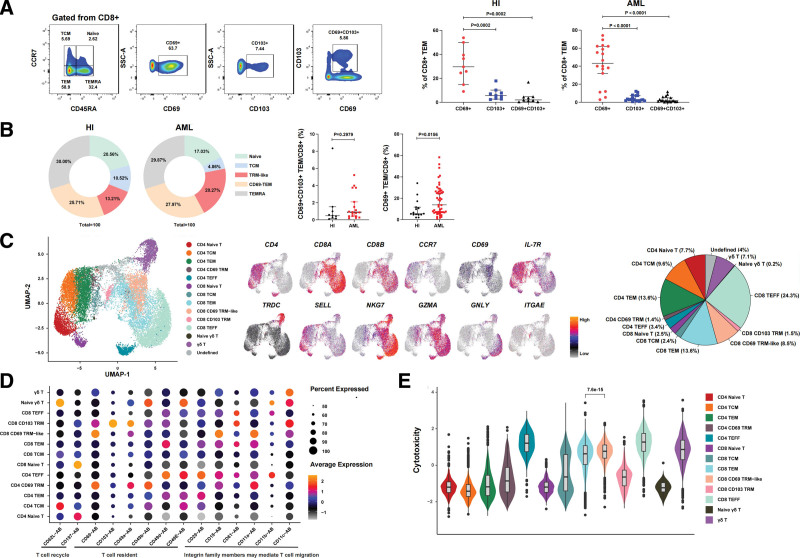
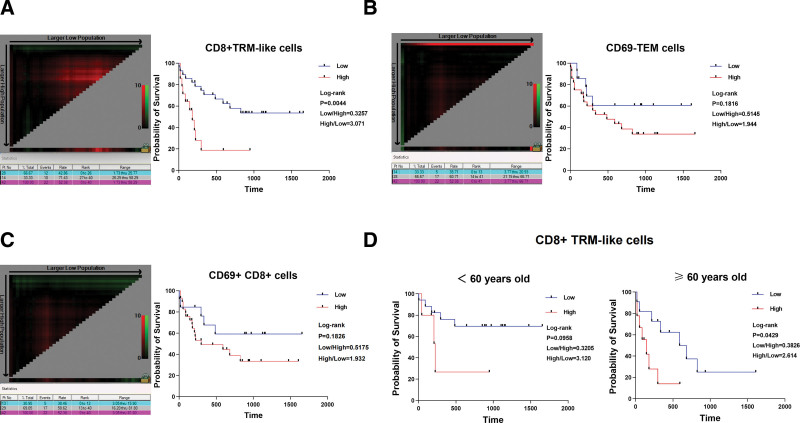
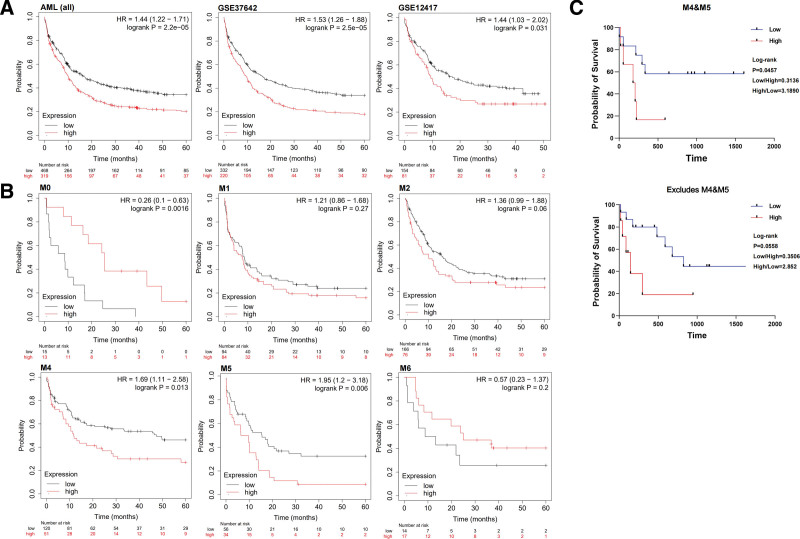
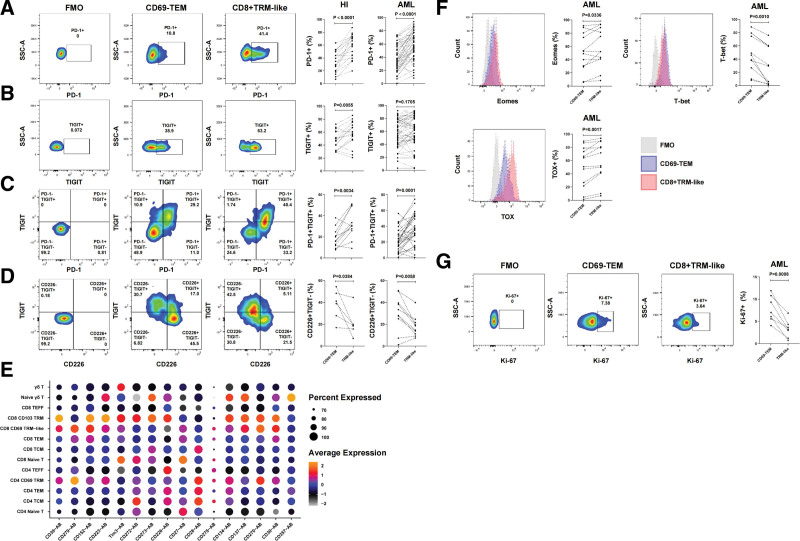
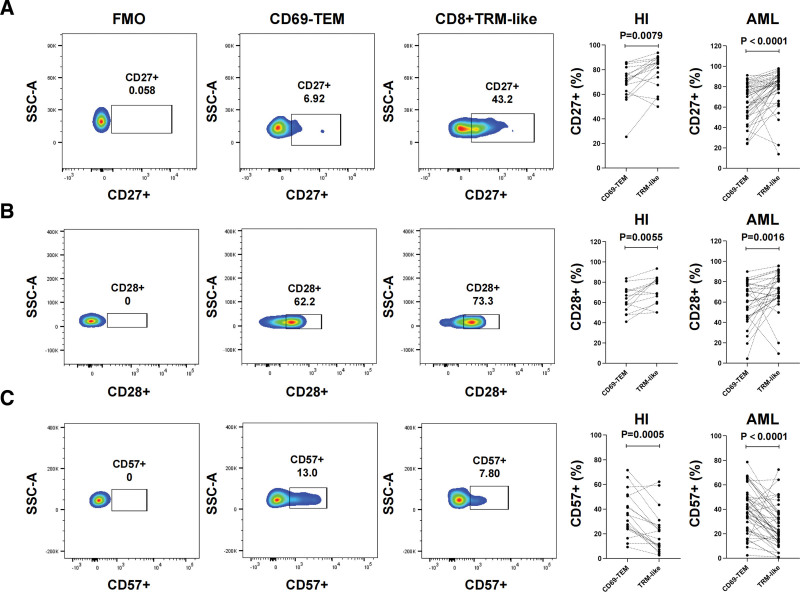
Tissue-resident memory T (TRM) cells infiltrating solid tumors could influence tumor progression and the response to immune therapies. However, the proportion and prognostic value of TRM cells in the bone marrow (BM) of patients with acute myeloid leukemia (AML) are unclear. In this study, we used flow cytometry to assay the phenotype of 49 BM samples from patients newly diagnosed with AML (ND-AML). We found that the BM CD8+ effector memory (TEM) cells highly expressed CD69 (CD8+ TRM-like T cells), and their percentage was significantly increased in patients with ND-AML compared with that in healthy individuals (HI). The high percentage of CD8+ TRM-like subset was associated with poor overall survival in our ND-AML cohort. The Kaplan-Meier Plotter database verified a significantly reduced survival rate among patients with high expression of CD8+ TRM-like T cell characteristic genes (CD8A, CD69, and TOX), especially the M4 and M5 subtypes. Phenotypic analysis revealed that the BM CD8+ TRM-like subpopulation exhibited exhausted T cell characteristics, but its high expression of CD27 and CD28 and low expression of CD57 suggested its high proliferative potential. The single-cell proteogenomic dataset confirmed the existence of TRM-like CD8+ T cells in the BM of patients with AML and verified the high expression of immune checkpoints and costimulatory molecules. In conclusion, we found that the accumulation of BM CD8+ TRM-like cells could be an immune-related survival prediction marker for patients with AML.

Keywords: Acute myeloid leukemia; Bone marrow; CD69; Tissue-resident-like memory T cells.


Conflict of interest statement

Conflict of interest: The authors declare that they have no conflict of interest.

Figures

Figure 1.
Figure 1.
CD8+ TRM-like cells increased in the bone marrow of newly diagnosed AML patients. (A) Flow cytometry gating plots show that CD8+ T cells are first separated into differentiation stage by CD45RA and CCR7 (naive [CCR7+CD45RA+], TCM [CCR7+CD45RA], TEM [CCR7CD45RA], and TEMRA [CCR7CD45RA+]). The CD69+, CD103+, and CD69+CD103+populations in TEM were further analyzed. The scatter plot shows that the CD8+ TEM cell subpopulation in the patients with ND-AML and HI significantly expressed CD69 but not CD103. The number (n) of samples included in each subset analysis was as follows: HI (n = 9); AML (n = 18). (B) Proportion of naive, TCM, TRM-like, CD69 TEM, and TEMRA cells in the BM CD8+ T cell subsets of patients with ND-AML and HIs. The scatter plot shows that compared with that of HIs, the BM of patients with ND-AML contains a higher proportion of CD69+ CD8+ TEM cells. The number (n) of samples included in each subset analysis was as follows: HI (n [CD69+CD103+ TEM] = 9, n [CD69+ TEM] = 15), AML (n [CD69+CD103+ TEM] = 18, n [CD69+ TEM] = 49). (C) Left: UMAP visualization of BM T cell single cell clusters for single-cell proteogenomic dataset. Different cell types were depicted with distinct colors. Middle: Projection of marker genes expression levels for BM T cells. Right: Proportion of different T cell subsets in BM. (D) Bubble plot of selected functional antibody AB for each cell cluster of T cells. Color scale indicates the mean of normalized expression of marker genes in each cell type, and dot size is proportional to the percentage of cells within each cell cluster expressing antibody. (E) Violin plots with boxplot insert of cytotoxic functional scores for each subtype of T cells. P values were calculated by Wilcoxon rank sum test (2-sided). Unpaired t test and Mann–Whitney U test were used for unpaired sample analysis. DN = newly diagnosed, HI = healthy individual, ns = not significant, TEM = effector memory T cell, TEMRA = effector memory T cell re-expressing CD45RA, TCM = central memory T cell, TRM-like = tissue-resident-like T cell, UMAP = uniform manifold approximation and projection.
Figure 2.
Figure 2.
High proportion of CD8+ TRM-like subpopulation in the bone marrow is associated with poor prognosis. (A) The figure on the left shows the truncation value of the CD8+ TRM-like subset using X-tile. OS analysis of high and low proportions of CD8+ TRM-like subpopulations in the BM of patients with ND-AML. A high proportion of subpopulations was significantly associated with poor prognosis. The number (n) of samples included in each subset was as follows: n = 42, low (n = 28, range: 1.73–25.77) and high (n = 14, range: 26.25–58.29). (B) The figure on the left shows the truncation value of the CD69 TEM subset using X-tile. OS analysis of high and low proportions of CD69 TEM subpopulations in the BM of patients with ND-AML. The high or low proportion of subpopulations was shown to be independent of patient survival. The number (n) of samples included in each subset was as follows: n = 42, low (n = 14, range: 3.77–20.93) and high (n = 28, range: 21.15–66.71). (C) The figure on the left shows the truncation value of the CD69+CD8+ subset using X-tile. OS analysis of high and low proportions of CD69+CD8+ T cell subpopulations in the BM of patients with ND-AML. The high or low proportion of subpopulations was shown to be independent of patient survival. The number (n) of samples included in each subset analysis was as follows: n = 42, low (n = 13, range: 3.05–15.90) and high (n = 29, range: 16.20–81.80). (D) OS analysis of high and low proportions of CD8+ TRM-like subgroups in the BM of patients with ND-AML who are 60 y old or older. The CD8+ TRM-like subset was significantly associated with poor prognosis in patients aged 60 y and older. The number (n) of samples included in each subset analysis was as follows: <60 y old (n = 22, low [n = 17], high [n = 5]), ≥60 y old (n = 20, low [n = 11], high [n = 9]). Log-rank (Mantel–Cox) test was used for sample analysis. BM = bone marrow, ND = newly diagnosed, ns = not significant, OS = overall survival, TEM = effector memory T cell, TRM-like = tissue-resident-like T cell.
Figure 3.
Figure 3.
High expression levels of CD8A, CD69, and TOX genes in the bone marrow associated with poor prognosis of patients with AML. (A–B) The AML dataset of “Kaplan–Meier Plotter” was used to analyze the correlation of the expression of CD8A, CD69, and TOX with patient OS. (A) The results of no typing or different databases, (B) the results of M0–M6 typing (excluding M3). (C) The collected ND-AML samples were used to analyze the correlation between the expression of CD8+ TRM-like subgroups and patient OS. The number (n) of samples included in each subset analysis was as follows: M4&M5, n = 19; excludes M4&M5, n = 23. Log-rank (Mantel–Cox) test was used for sample analysis. AML = acute myeloid leukemia, HR = hazard ratio, ND = newly diagnosed, ns = not significant, OS = overall survival, TRM-like = tissue-resident-like T cell.
Figure 4.
Figure 4.
Bone marrow CD8+ TRM-like subset shows T cell exhaustion phenotype and stay in quiescent state. (A–D) Flow cytometry was used to analyze the expression of PD-1 (A), TIGIT (B), PD-1+TIGIT+ (C), and TIGITCD226+ (D) in the CD69 TEM and CD8+ TRM-like cell subsets in the BM of HIs and patients with ND-AML. Compared with CD69 TEM, the CD8+ TRM-like subset highly expressed PD-1 and TIGIT in the BM of HIs and patients with AML. The number (n) of samples included in each subset was as follows: HI (n [PD-1+] = 18, n [TIGIT+] = 18, n [PD-1+TIGIT+] = 11, n [CD226+TIGIT] = 6), AML (n [PD-1+] =48, n [TIGIT+] = 49, n [PD-1+TIGIT+] = 30, n [CD226+TIGIT] = 10). (E) Bubble plot of selected functional antibody AB for each cell cluster of T cells. Color scale indicates the mean of normalized expression of marker genes in each cell type, and dot size is proportional to the percentage of cells within each cell cluster expressing antibody. (F–G) Flow cytometry was used to detect the distribution and frequency of Eomes, T-bet, TOX (F), and Ki-67 (G) on the CD69 TEM and CD8+ TRM-like cell subsets in the BM of patients with ND-AML. Compared with CD69 TEM, the CD8+ TRM-like subset expressed Eomes and TOX and lowly expressed T-bet. The CD8+ TRM-like subset lowly expressed Ki-67. The number (n) of samples included in each analysis was as follows: Eomes, n = 12, T-bet, n = 11, TOX, n = 12, Ki-67, n = 8. Paired t test was used for paired sample analysis. AML = acute myeloid leukemia, BM = bone marrow, HI = healthy individual, ND = newly diagnosed, ns = not significant, PD-1 = programmed death receptor-1, TEM = effector memory T cell, TIGIT = T cell immunoreceptor with Ig and ITIM domains, TRM-like = tissue-resident-like T cell.
Figure 5.
Figure 5.
Frequency of CD27, CD28, and CD57 expression on the bone marrow CD8+ TRM-like subset of HIs and patients with ND-AML. (A–C) Flow cytometry was used to detect the distribution and frequency of CD27 (A), CD28 (B), and CD57 (C) on the CD69 TEM and CD8+ TRM-like cell subsets in the BM of HIs and patients with ND-AML. Compared with CD69 TEM, the CD8+ TRM-like subset expressed CD27 and CD28 and low expression of CD57. The number (n) of samples included in each subset analysis is shown as follows, HI (n [CD27+] = 17, n [CD28+] = 14, n [CD57+] = 18), AML (n [CD27+] = 41, n [CD28+] = 32, n [CD57+] = 47). Wilcoxon test and paired t test were used for paired sample analysis. AML = acute myeloid leukemia, HI = healthy individual, ND = newly diagnosed, ns = not significant, TEM = effector memory T cell, TRM-like = tissue-resident-like T cell.

Similar articles

Cited by

References

    1. American Cancer Society. Cancer Facts & Figures 2024 . Last revised: January 17, 2024. Available from: https://www.cancer.org/cancer/types/acute-myeloid-leukemia/about/key-sta....
    1. Huang S, Zhao Y, Lai W, et al. . Higher PD-1/Tim-3 expression on IFN-γ + T cells is associated with poor prognosis in patients with acute myeloid leukemia. Cancer Biol Ther 2023;24(1):2278229. - PMC - PubMed
    1. Tian C, Chen Z. Immune therapy: a new therapy for acute myeloid leukemia. Blood Sci 2023;5(1):15–24. - PMC - PubMed
    1. Wang JY, Wang L. CAR-T cell therapy: where are we now, and where are we heading? Blood Sci 2023;5(4):237–248. - PMC - PubMed
    1. Zhou Y-J, Li G, Wang J, et al. . PD-L1: expression regulation. Blood Sci 2023;5(2):77–91. - PMC - PubMed