Review
. 2023 Oct 10;4(1):20230019.
doi: 10.1002/EXP.20230019. eCollection 2024 Feb.

Manipulating calcium homeostasis with nanoplatforms for enhanced cancer therapy

Affiliations
Review

Manipulating calcium homeostasis with nanoplatforms for enhanced cancer therapy

Yanlin Feng et al. Exploration (Beijing). .

Abstract

Calcium ions (Ca2+) are indispensable and versatile metal ions that play a pivotal role in regulating cell metabolism, encompassing cell survival, proliferation, migration, and gene expression. Aberrant Ca2+ levels are frequently linked to cell dysfunction and a variety of pathological conditions. Therefore, it is essential to maintain Ca2+ homeostasis to coordinate body function. Disrupting the balance of Ca2+ levels has emerged as a potential therapeutic strategy for various diseases, and there has been extensive research on integrating this approach into nanoplatforms. In this review, the current nanoplatforms that regulate Ca2+ homeostasis for cancer therapy are first discussed, including both direct and indirect approaches to manage Ca2+ overload or inhibit Ca2+ signalling. Then, the applications of these nanoplatforms in targeting different cells to regulate their Ca2+ homeostasis for achieving therapeutic effects in cancer treatment are systematically introduced, including tumour cells and immune cells. Finally, perspectives on the further development of nanoplatforms for regulating Ca2+ homeostasis, identifying scientific limitations and future directions for exploitation are offered.

Keywords: Ca2+ inhibition; Ca2+ overload; calcium homeostasis regulation; cancer therapy; immunotherapy.


Conflict of interest statement

The authors declare no conflicts of interest.

Figures
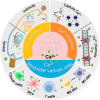
FIGURE 1
FIGURE 1
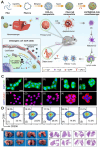
Schematic illustration of different strategies for regulating Ca2+ balance in cancer treatment (Ca2+ overload/inhibition), and the applications of Ca2+‐related nanomaterials in different cells (cancer cells, immune cells) to regulate their Ca2+ balance for achieving therapeutic effects in cancer treatment.
FIGURE 2
FIGURE 2
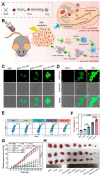
CaCo3 as intelligent carrier to deliver different types of cargos. (A) Scheme illustration of the biomineralization processes of DNA@CaCO3 with cGAS‐STING activating abilities to inhibit tumour recurrence. (B) TEM image of DNA@CaCO3 microparticles. (C) pH‐responsive decomposition properties of DNA@CaCO3 microparticles and (D) time‐dependent release curves of DNA from DNA@CaCO3 microparticles. (E) Western blotting of the proteins correlated with cGAS‐STING‐TBK1‐IRF3 signalling pathways. (F) Tumour growth curves of B16 tumours in C57BL/6 mice and (G) CT26 tumours in BALB/c mice. Reproduced with permission.[ 39 ] Copyright 2023, American Chemical Society.
FIGURE 3
FIGURE 3
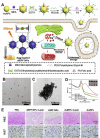
CaCO3 based nanoplatform for Ca2+ overload. (A) Scheme of CaCO3@PDA@CUR@CDDP‐based synergistic Ca2+ overload and chemotherapy. (B) Mitochondrial Ca2+ concentrations quantification after treated with various Ca2+ nanomodulators. (C) Tumour growth curves of MCF‐7‐tumour‐bearing nude mice. Reproduced with permission.[ 45 ] Copyright 2021, John Wiley & Sons. (D) Schematic diagram of the synthesis process of CaCO3@COF‐BODIPY‐2I@GAG NMs. (E) Molecular structure of DMTP, TPB, BODIPY‐2I, GAG, AND TPB‐DMTP‐COF (1). (F) Synergistic induction of intracellular Ca2+ overload by singlet oxygen (1O2) and exogenous Ca2+ delivery. Note: (A) CD44‐mediated cellular uptake; (B) CaCO3 decomposition in lysosomes; (C) BODIPY‐2I induce 1O2 production under green LED. (D) Mitochondrial impairment. (E) Cell blebbing induced by oncosis. Reproduced with permission.[ 46 ] Copyright 2020, John Wiley & Sons.
FIGURE 4
FIGURE 4
CaO2‐based nanoplatform for Ca2+ overload and CDT. (A) Schematic illustration of the synthesis process of CaO2‐CuO2@HA NC and (B) antitumour properties of CaO2‐CuO2@HA NC for Ca2+ overload and CDT. Reproduced with permission.[ 54 ] Copyright 2022, American Chemical Society. (C) Schematic illustration of the synthesis process of CaZFCP and (D) therapeutic mechanism of pH‐responsive CaZFCP for Ca2+ overload, CDT and PDT. (E) Hypoxia‐inducible factor‐1α (HIF‐1α) staining of tumour tissues after treated with PBS, ZFCP, and CaZFCP. Reproduced with permission.[ 55 ] Copyright 2021, John Wiley & Sons.
FIGURE 5
FIGURE 5
CaH2‐based nanoplatform for Ca2+ overload, H2 therapy and acidic TME modulation. (A) Schematic illustration of the application of nano‐CaH2 for mouse xenograft and interventional transarterial embolization (TAE) therapy of rabbit liver tumours through the combination of Ca2+ overload, H2 immunotherapy and neutralization of acidic tumour microenvironment. (B) Mitochondrial dysfunction and ATP generation inhibition. (C) Intracellular Ca2+ content after different treatment. (D) characterization of ICD. (E) Tumour volume monitoring. (F) pH values inside the tumours. (G) CTL infiltration, (H) quantification of Treg cells, and (I) the polarization of macrophages within the primary and distant tumours after different treatments. Reproduced with permission.[ 60 ] Copyright 2022, Elsevier.
FIGURE 6
FIGURE 6
CaP‐based nanoplatform for Ca2+ overload. (A) Schematic illustration of dual enhanced Ca2+ nanogenerator (DECaNG) synergized with Ca2+ overload and PTT. DECaNG induces tumour cell apoptosis both (B) in vitro and (C) in vivo. Reproduced with permission.[ 70 ] Copyright 2018, American Chemical Society. (D) Schematic illustration of the anti‐tumour mechanism of RGD‐CaPO/DOX in tumour cells and peritoneal cavity of mice. (E) Western blotting of the proteins correlated with endoplasmic reticulum stress. (F) Fluorescent images to detection the intracellular Ca2+. (G) Survival proportions of mice after different treatments. (H) Hematoxylin−eosin (H&E) and terminal deoxynucleotidyl transferase dUTP nick end labelling (TUNEL) images of tumour tissues after different treatments. Reproduced with permission.[ 67 ] Copyright 2022, American Chemical Society.
FIGURE 7
FIGURE 7
CaS‐based nanoplatform for Ca2+ overload. (A) Schematic illustration of the preparation process of ZnPP@PAA‐CaS and (B) ZnPP@PAA‐CaS mediated Ca2+ overload and signalling cascade antitumour immunotherapy. (C) characterization of ICD. (D) The polarization of macrophages. (1) blank; (2) PAA‐Ca; (3) ZnPP; (4) PAA‐CaS; (5) ZnPP@PAA‐CaS. (E) Digital photos of metastatic nodules in lungs after different treatments and corresponding H&E staining images. All groups: (1) blank; (2) PAA‐Ca; (3) ZnPP; (4) αPD‐1; (5) PAA‐CaS; (6) ZnPP@PAA‐CaS; (7) PAA‐CaS + αPD‐1; (8) ZnPP@PAA‐CaS + αPD‐1. Reproduced with permission.[ 71 ] Copyright 2021, American Chemical Society.
FIGURE 8
FIGURE 8
CaF2‐based nanoplatform for Ca2+ overload. (A) Schematic illustration for the underlying mechanism of US‐amplified CaF2 nanozyme for Ca2+‐overload‐assisted catalytic tumour therapy. (B) Intracellular Ca2+ ions in 4T1 cancer cells and H22 cancer cells. (C) H&E, Ki‐67, and TUNEL staining images of 4T1‐tumour and H22‐tumour sections from the tumour‐bearing mice in different treatment groups. Reproduced with permission.[ 76 ] Copyright 2019, John Wiley & Sons.
FIGURE 9
FIGURE 9
Other forms of Ca2+‐based nanomaterials for Ca2+ overload (CaxCoO2). (A) Schematic diagram of the synthesis procedure of CCO@ss‐SiO2‐Ce6 and (B) tumour therapy of synergistic induction of CCO@ss‐SiO2‐Ce6 heat‐enhanced Ca2+ overload and PDT/PTT. (C) Intracellular ROS generation in HepG2 cells treated with CCO@ss‐SiO2‐Ce6 under 660 nm laser irradiation. (D) Cell viability of HepG2 cells after incubated with different concentrations of CCO@ss‐SiO2‐Ce6. (E) Tumour volume, (F) body weight, and (G) H&E staining images of tumour slices from mice treated with various treatments after 15 days. Reproduced with permission.[ 77 ] Copyright 2021, American Chemical Society.
FIGURE 10
FIGURE 10
Other forms of Ca2+‐based nanomaterials for Ca2+ overload (Ca2+‐based MOF). (A) Schematic illustration for the synthesis process of PCa and (B) mechanism of PCa for amplified Ca2+ overload and activated immunotherapy. Fluorescent images to detect the (C) intracellular Ca2+ concentration and (D) ROS generation. (E, F) BMDC maturation analysis by flow cytometry. (G) Tumour growth curves and (H) photographs of collected tumours at the end of treatment after various treatments. Reproduced with permission.[ 78 ] Copyright 2023, American Chemical Society.
FIGURE 11
FIGURE 11
Plasma membrane damage to trigger Ca2+ overload. (A) Schematic diagram of the preparation process of CMA‐nPS and (B) their capacity to generate abundant ROS and introduce intracellular Ca2+ overload for enhanced antitumour efficiency. (C) Fluorescent images to detect cell membrane integrity and (D) intracellular Ca2+ concentration. (E) TEM images of H1299 cells after different treatments to observe mitochondrial integrity. (F) H&E and TUNEL staining images of H1299 tumour‐bearing mice after different treatments. Reproduced with permission.[ 79 ] Copyright 2022, John Wiley & Sons.
FIGURE 12
FIGURE 12
NO to trigger Ca2+ overload. (A) Schematic illustration of intracellular calcium stores modulated by NO for Ca2+ overload‐initiated cancer therapy. (B) Aggregation quenching effect of 2 nitroimidazole (2nIm) molecules (top). The photochemical activity of 2nIm could be improved by ZIF‐82 (low). (C) Mechanisms of NO activating RyRS. Fluorescent images to detect (D) intracellular Ca2+ concentration and (E) ROS generation. Reproduced with permission.[ 82 ] Copyright 2021, John Wiley & Sons.
FIGURE 13
FIGURE 13
PA chelating to capture Ca2+ for Ca2+ inhibition. (A) Schematic illustration of the synthesis of CePA and their antitumour mechanism through PA‐chelated Ca2+ for overcoming drug resistance and chemotherapy. (B, C) Intracellular Ca2+ concentration after different treatments. (D) H&E staining and (E) immunofluorescence staining of ROS, (F) P‐gp and Dox. Reproduced with permission.[ 90 ] Copyright 2022, Springer.
FIGURE 14
FIGURE 14
EGTA chelating to capture Ca2+ for Ca2+ inhibition. (A) Schematic illustration of the synthesis of AEPF NPs and their antitumour performance via EGTA‐captured Ca2+ and photothermal therapy. (B) TEM images of AEPF NPs in Ca2+ solution before adding esterase. (C) TEM images of AEPF NPs in Ca2+ solution after adding esterase. (D) UV–vis spectrum and corresponding photographs of AEPF NPs solution with and without Ca2+ and esterase. (E) H&E and Ki‐67 staining images of tumour sections in different treatment groups. Reproduced with permission.[ 94 ] Copyright 2021, Elsevier.
FIGURE 15
FIGURE 15
Knockdown of T‐type Ca2+ channel for Ca2+ inhibition. (A) Schematic illustration of the synthesis process of MSNCs and their application in tumour therapy through downregulation of T‐type Ca2+ channel expression, reduction in intracellular Ca2+ concentration, and chemotherapy. Fluorescent images to detect (B) Cav 3.1 and Cav 3.2 T‐type Ca2+ channels and (C) intracellular Ca2+ concentration. (D) H&E and TUNEL staining images of tumour sections after different treatments. Reproduced with permission.[ 23 ] Copyright 2019, American Chemical Society.
FIGURE 16
FIGURE 16
Ca2+ inducing ICD of cancer cells to produce tumor‐associated antigens. (A) Schematic illustration of US‐augmented collaborative Ca2+ overload and immunotherapy utilizing PEGCaCUR. (B) Fluorescent images to detect mitochondrial membrane potential. (C) Immunofluorescence staining of intratumoural CD4 (red fluorescence) and CD8 (green fluorescence) T cells after different treatments. (D) H&E and TUNEL staining images of tumour sections after different treatments. (E) H&E‐staining of lung sections at the end of different treatments. Tumour metastasis was indicated by red arrows. Reproduced with permission.[ 29 ] Copyright 2021, American Chemical Society.
FIGURE 17
FIGURE 17
Ca2+ mediating autophagy of DCs to promote the presentation of antigens. (A) Schematic illustration of HOCN overcoming multiple barriers in DCs’ antigen cross‐presentation for chemo‐immunotherapy by neutralizing tumour acidity, inducing autophagy in DCs, and promoting Ca2+ overload to enhance DAMPs released from tumour cells. (B) Tumour growth curves and (C) representative tumour tissues from each group after different treatments. (D) DC maturation rates and (E) CD8+ and CD4+ T lymphocytes were examined by flow cytometry. Reproduced with permission.[ 30 ] Copyright 2020, American Chemical Society.
FIGURE 18
FIGURE 18
Ca2+ functioning as a vaccine adjuvant to enhance T cell responses. (A) Schematic illustration of the fabrication of Fe/Se‐CaP nanohybrid and their antitumour mechanisms involving GSH depletion, ROS generation, and vaccine adjuvant functions. Fluorescent images to detect (B) intracellular GSH level and (C) ROS generation. (D) Western blotting of apoptosis‐associated proteins. (E) Schematic illustration of the cell apoptosis mechanism. (F) Immunofluorescence staining of intratumoural CD4 (yellow fluorescence) and CD8 (red fluorescence) T cells after different treatments. Intratumoural IL‐12p70 (G), IFN‐γ (H), and TNF‐α (I) expression examined by enzyme‐linked immunosorbent assay (ELISA). Reproduced with permission.[ 113 ] Copyright 2022, Elsevier.
FIGURE 19
FIGURE 19
Ca2+ regulation of macrophage M1 polarization. (A) Schematic illustration of the synthesis of OMV@CaP. (B) Ca2+ release profile at different pH values. (C) pH value changes inside tumour tissues after different treatments. (D) Macrophage polarization analysis by flow cytometry. Intratumoural (E) IL‐12, (F) IL‐6, (G) TNF‐α, and (H) IFN‐γ expression were examined by ELISA. Reproduced with permission.[ 123 ] Copyright 2020, John Wiley & Sons.

References

    1. Berridge M. J., Lipp P., Bootman M. D., Nat. Rev. Mol. Cell Biol. 2000, 1, 11. - PubMed
    1. Clapham D. E., Cell 2007, 131, 1047. - PubMed
    1. Berridge M. J., Physiol. Rev. 2016, 96, 1261. - PubMed
    1. De Stefani D., Rizzuto R., Pozzan T., Annu. Rev. Biochem. 2016, 85, 161. - PubMed
    1. Giorgi C., Danese A., Missiroli S., Patergnani S., Pinton P., Trends Cell Biol. 2018, 28, 258. - PubMed

LinkOut - more resources