

ROP Prediction Method Based on PCA-Informer Modeling
- PMID: 38854564
- PMCID: PMC11154915
- DOI: 10.1021/acsomega.3c10339
ROP Prediction Method Based on PCA-Informer Modeling
Abstract
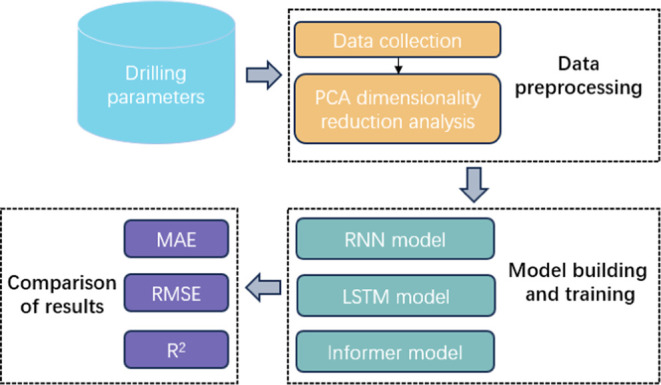
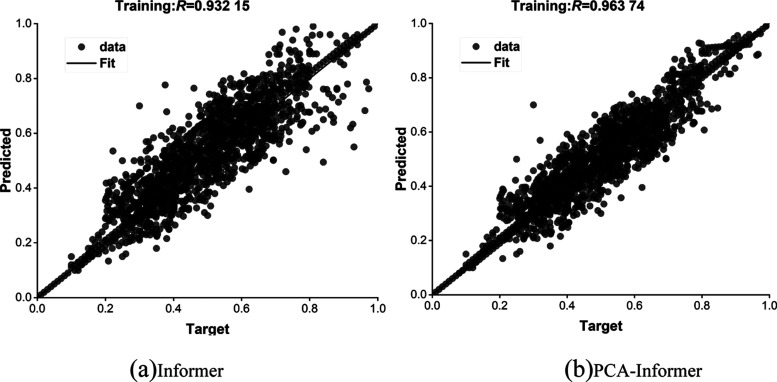
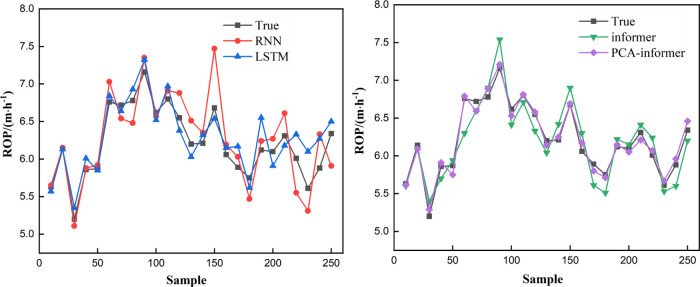
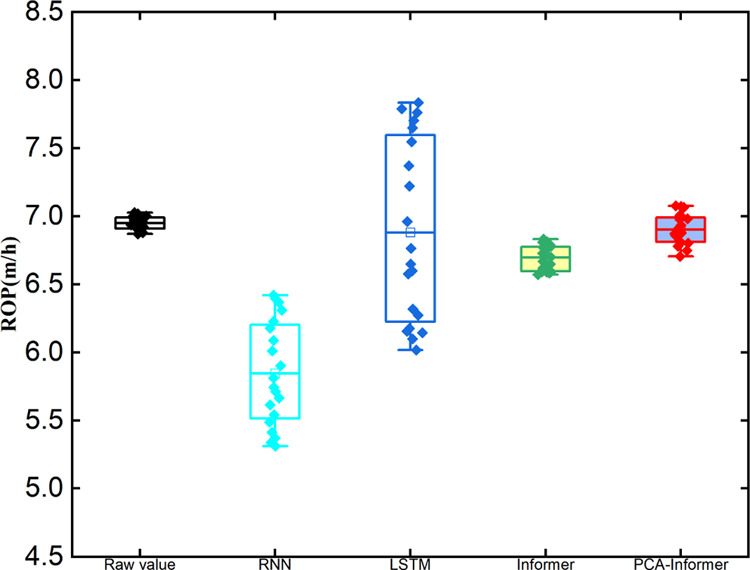
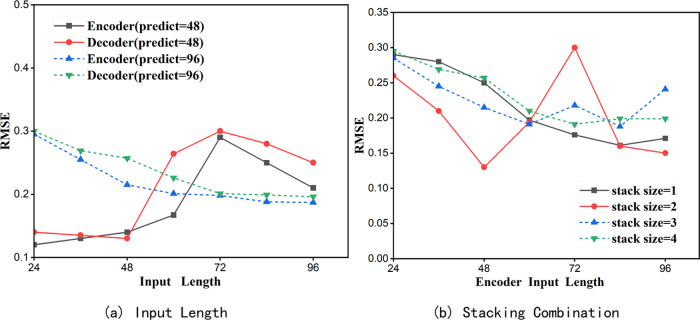
Increasing the rate of penetration (ROP) is an effective means to improve the drilling efficiency. At present, the efficiency and accuracy of intelligent prediction methods for the rate of penetration still need to be improved. To improve the efficiency and accuracy of rate of penetration prediction, this paper proposes a ROP prediction model based on Informer optimized by principal component analysis (PCA). We take the Taipei Basin block oilfield as an example. First, we use principal component analysis to extract data features, transforming the original data into low-dimensional feature data. Second, we use the PCA-optimized data to build an Informer model for predicting ROP. Finally, combined with actual data and using the recurrent neural network (RNN) and long short-term memory (LSTM) as baselines, we perform algorithm performance comparative analysis using root-mean-square error (RMSE), mean absolute error (MAE), and coefficient of determination (R 2). The results show that the average MAE, RMSE, and R 2 of the PCA-Informer model are 9.402, 0.172, and 0.858, respectively. Compared with other methods, it has a larger R 2 and smaller RMSE and MAPE, indicating that this method significantly outperforms existing methods and provides a new solution to improve the rate of penetration in actual drilling operations.
© 2024 The Authors. Published by American Chemical Society.
Conflict of interest statement
The authors declare no competing financial interest.
Figures
Similar articles
-
An Advanced Long Short-Term Memory (LSTM) Neural Network Method for Predicting Rate of Penetration (ROP).ACS Omega. 2022 Dec 21;8(1):934-945. doi: 10.1021/acsomega.2c06308. eCollection 2023 Jan 10. ACS Omega. 2022. PMID: 36643527 Free PMC article.
-
Real-time prediction of ROP based on GRU-Informer.Sci Rep. 2024 Jan 25;14(1):2133. doi: 10.1038/s41598-024-52261-7. Sci Rep. 2024. PMID: 38272964 Free PMC article.
-
Drilling Rate of Penetration Prediction Based on CBT-LSTM Neural Network.Sensors (Basel). 2024 Oct 30;24(21):6966. doi: 10.3390/s24216966. Sensors (Basel). 2024. PMID: 39517863 Free PMC article.
-
Enhanced Air Quality Prediction Using a Coupled DVMD Informer-CNN-LSTM Model Optimized with Dung Beetle Algorithm.Entropy (Basel). 2024 Jun 21;26(7):534. doi: 10.3390/e26070534. Entropy (Basel). 2024. PMID: 39056897 Free PMC article.
-
A rate of penetration (ROP) prediction method based on improved dung beetle optimization algorithm and BiLSTM-SA.Sci Rep. 2024 Oct 28;14(1):25856. doi: 10.1038/s41598-024-75703-8. Sci Rep. 2024. PMID: 39468121 Free PMC article.
Cited by
-
An optimized informer model design for electric vehicle SOC prediction.PLoS One. 2025 Mar 11;20(3):e0314255. doi: 10.1371/journal.pone.0314255. eCollection 2025. PLoS One. 2025. PMID: 40068111 Free PMC article.
References
-
- Hegde C.; Daigle H.; Gray K. E. Performance comparison of algorithms for real-time rate-of-penetration optimization in drilling using data-driven models. SPE J. 2018, 23, 1706–1722. 10.2118/191141-PA. - DOI
-
- Oyedere M.; Gray K. ROP and TOB optimization using machine learning classification algorithms. J. Nat. Gas Sci. Eng. 2020, 77, 10323010.1016/j.jngse.2020.103230. - DOI
-
- Ashrafi S. B.; Anemangely M.; Sabah M.; Ameri M. J. Application of hybrid artificial neural networks for predicting rate of penetration (ROP): A case study from Marun oil field. J. Pet. Sci. Eng. 2019, 175, 604–623. 10.1016/j.petrol.2018.12.013. - DOI
-
- Brenjkar E.; Delijani E. B. Computational prediction of the drilling rate of penetration (ROP): A comparison of various machine learning approaches and traditional models. J. Pet. Sci. Eng. 2022, 210, 11003310.1016/j.petrol.2021.110033. - DOI
-
- Mazen A. Z.; Rahmanian N.; Mujtaba I.; Hassanpour A. Prediction of Penetration Rate for PDC Bits Using Indices of Rock Drillability, Cuttings Removal, and Bit Wear. SPE Drill. Completion 2021, 36, 320–337. 10.2118/204231-PA. - DOI
LinkOut - more resources
Full Text Sources