. 2024 May 24:17:1398447.
doi: 10.3389/fnmol.2024.1398447. eCollection 2024.

Automated quantification of photoreceptor outer segments in developing and degenerating retinas on microscopy images across scales

Affiliations

Automated quantification of photoreceptor outer segments in developing and degenerating retinas on microscopy images across scales

Suse Seidemann et al. Front Mol Neurosci. .

Abstract

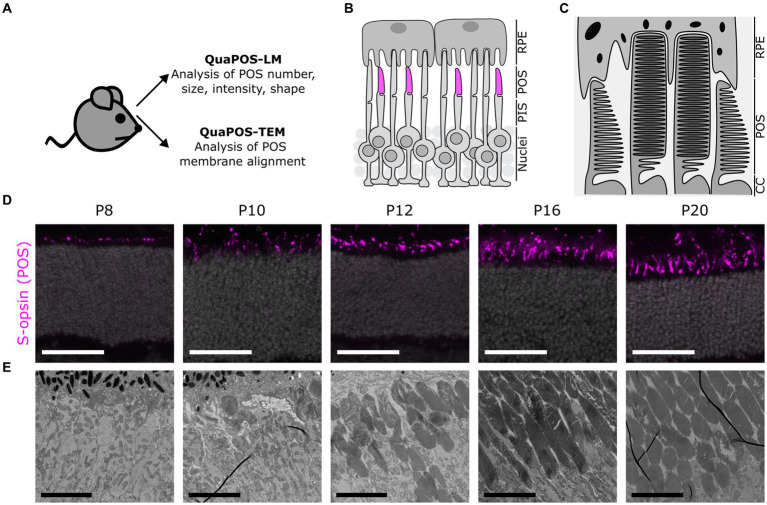
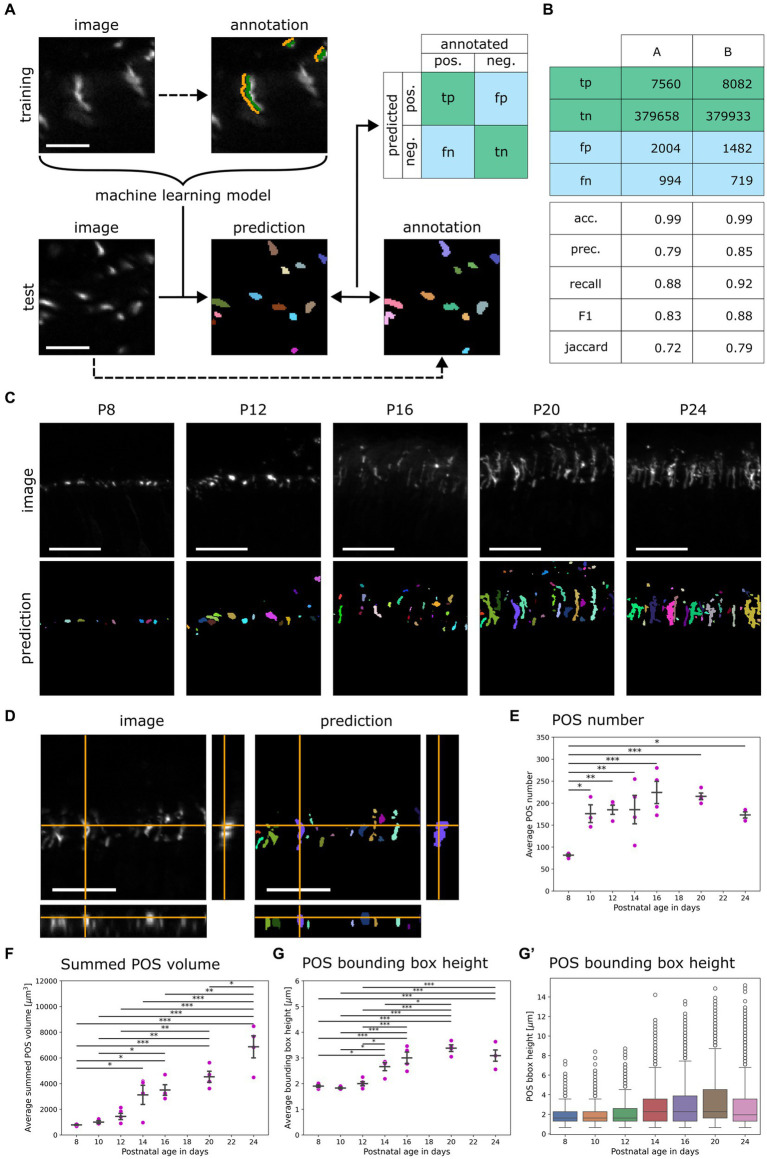
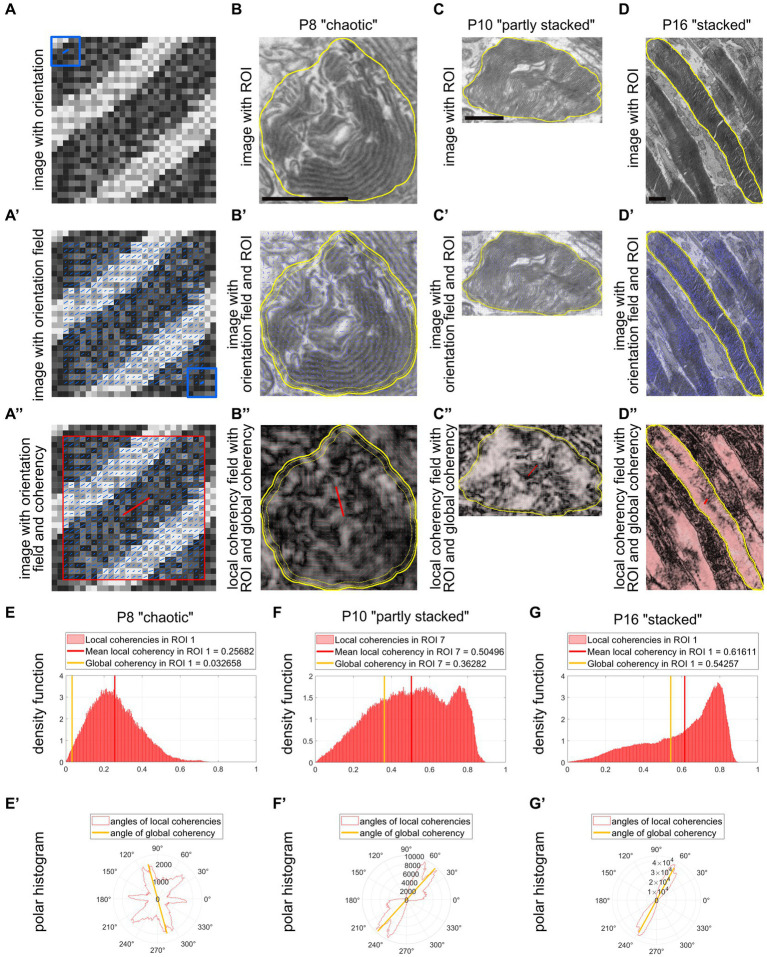
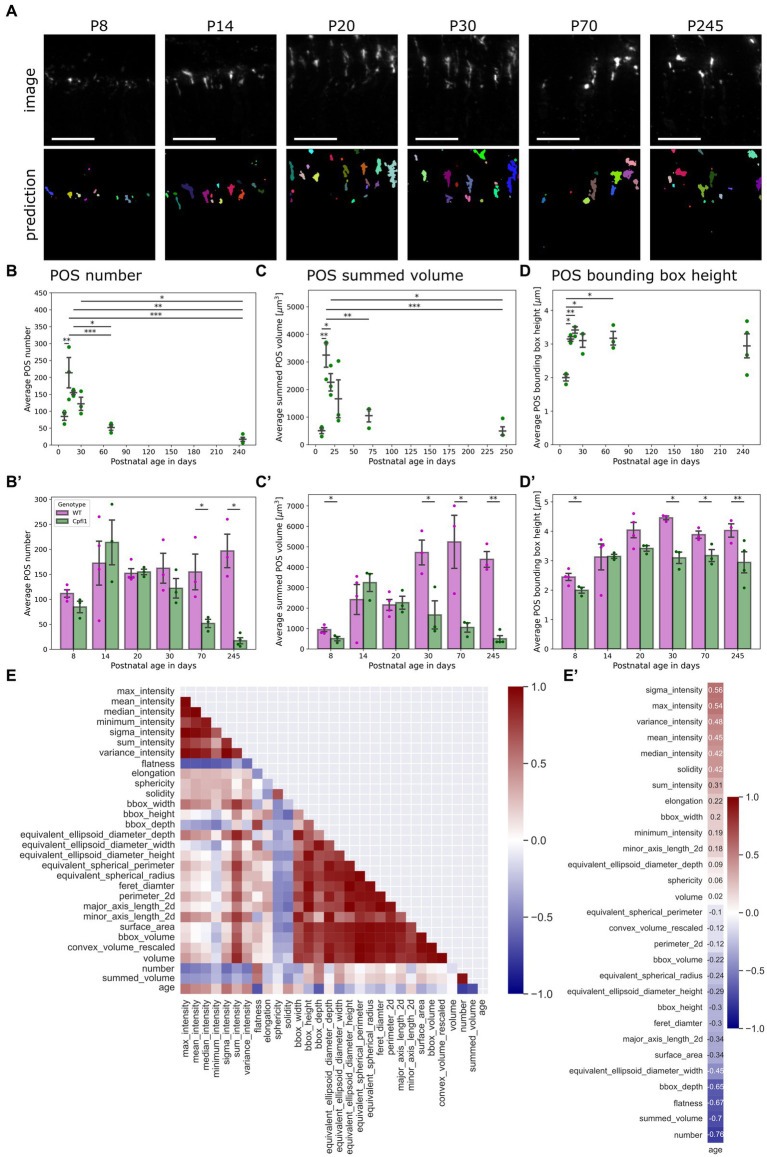
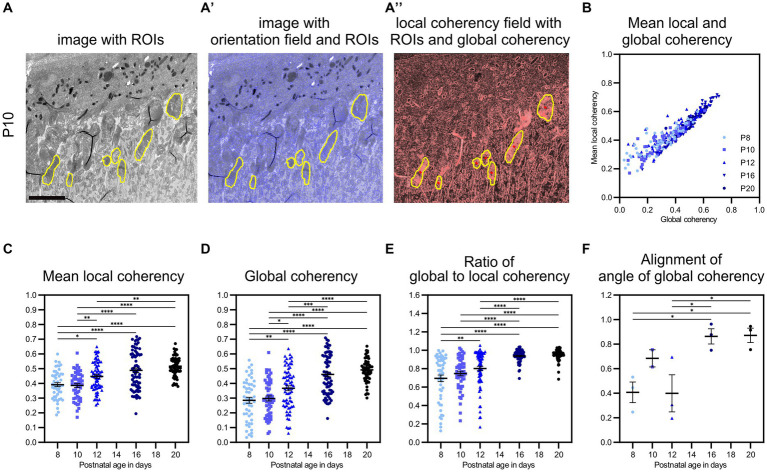
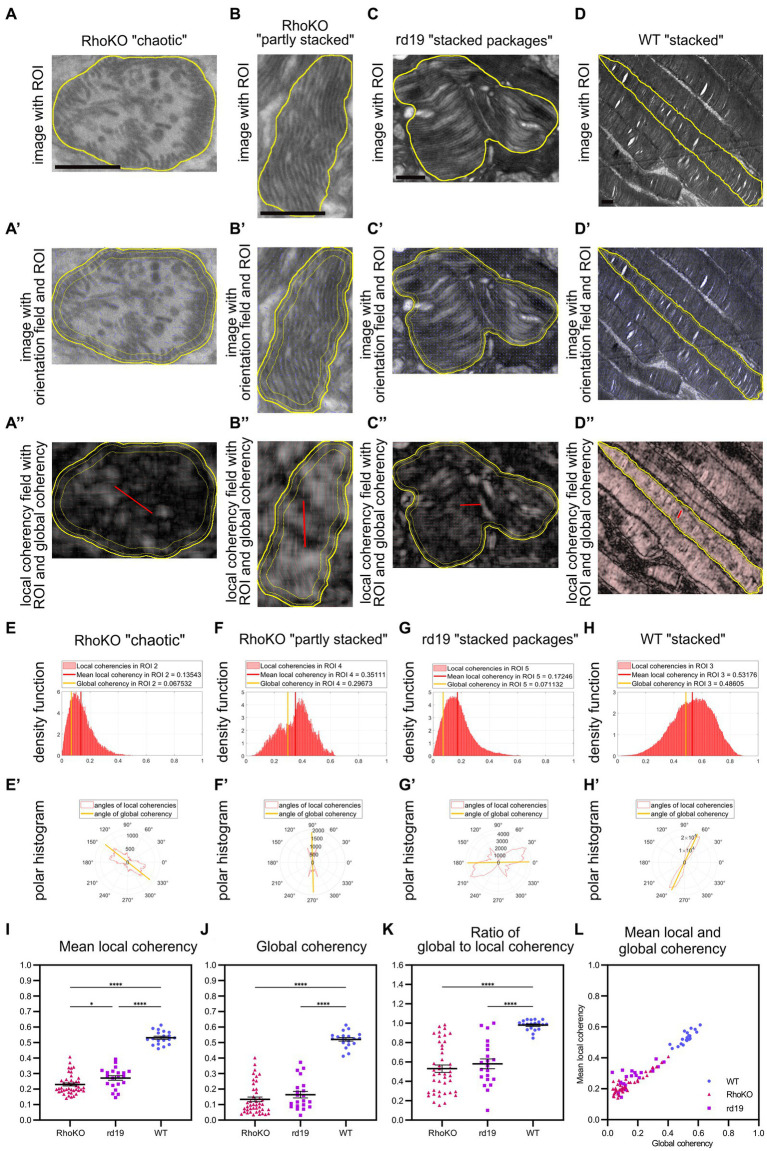
The functionality of photoreceptors, rods, and cones is highly dependent on their outer segments (POS), a cellular compartment containing highly organized membranous structures that generate biochemical signals from incident light. While POS formation and degeneration are qualitatively assessed on microscopy images, reliable methodology for quantitative analyses is still limited. Here, we developed methods to quantify POS (QuaPOS) maturation and quality on retinal sections using automated image analyses. POS formation was examined during the development and in adulthood of wild-type mice via light microscopy (LM) and transmission electron microscopy (TEM). To quantify the number, size, shape, and fluorescence intensity of POS, retinal cryosections were immunostained for the cone POS marker S-opsin. Fluorescence images were used to train the robust classifier QuaPOS-LM based on supervised machine learning for automated image segmentation. Characteristic features of segmentation results were extracted to quantify the maturation of cone POS. Subsequently, this quantification method was applied to characterize POS degeneration in "cone photoreceptor function loss 1" mice. TEM images were used to establish the ultrastructural quantification method QuaPOS-TEM for the alignment of POS membranes. Images were analyzed using a custom-written MATLAB code to extract the orientation of membranes from the image gradient and their alignment (coherency). This analysis was used to quantify the POS morphology of wild-type and two inherited retinal degeneration ("retinal degeneration 19" and "rhodopsin knock-out") mouse lines. Both automated analysis technologies provided robust characterization and quantification of POS based on LM or TEM images. Automated image segmentation by the classifier QuaPOS-LM and analysis of the orientation of membrane stacks by QuaPOS-TEM using fluorescent or TEM images allowed quantitative evaluation of POS formation and quality. The assessments showed an increase in POS number, volume, and membrane coherency during wild-type postnatal development, while a decrease in all three observables was detected in different retinal degeneration mouse models. All the code used for the presented analysis is open source, including example datasets to reproduce the findings. Hence, the QuaPOS quantification methods are useful for in-depth characterization of POS on retinal sections in developmental studies, for disease modeling, or after therapeutic interventions affecting photoreceptors.

Keywords: cone; electron microscopy; fluorescence microscopy; photoreceptor outer segment; retinal degeneration; retinal development; segmentation; supervised machine learning.


Conflict of interest statement

The authors declare that the research was conducted in the absence of any commercial or financial relationships that could be construed as a potential conflict of interest.

Figures

Figure 1
Figure 1
Assessment of photoreceptor outer segments during postnatal mouse development using light (LM) and transmission electron microscopy (TEM) images. (A) Experimental outline to develop quantification methods for the analysis of POS on LM and TEM images. Eyes were collected from WT mice (C57BL/6JRj) and processed for analysis of retinal sections via LM or TEM. (B) Schematic overview of photoreceptors and retinal pigment epithelial cells (RPE) in the outer retina. Photoreceptor inner segments (PIS) and outer segments (POS) extend apically toward the RPE. Cone POS were immunohistochemically labeled with S-opsin (magenta). (C) Ultrastructural scheme of POS as seen in TEM. POS consist of several membrane discs in rods and aligned plasma membrane evaginations in cones. (D) Immunohistochemical staining of S-opsin (magenta) and DAPI (gray) on cryosections at different postnatal development stages. Staining indicates a change in size, shape, and number of cone POS throughout postnatal development. Scale bar = 50 μm. (E) TEM images of POS at different postnatal development stages. Throughout postnatal development, POS increased in number and size. Later postnatal development stages indicated highly organized POS membrane stacks (scale bar = 5 μm).
Figure 2
Figure 2
Development of the random forest classifier QuaPOS-LM for quantification of S-cone POS. (A) A random forest pixel classifier to automatically distinguish POS from background was trained and validated. The background (orange) and the POS signal (green) of cones were sparsely annotated on LM images stained for S-opsin in a training dataset by a human. The dataset was used to train a machine learning (ML) model that automatically separated the signal of cone POS from its background. On a test dataset, manual annotations of two persons A and B were compared to the prediction of the ML model to compute a confusion matrix containing true positive (tp), true negative (tn), false positive (fp), and false negative (fn) pixel counts (scale bar = 10 μm). (B) The confusion matrix was computed with test annotations from two different people. The performance of the random forest classifier was estimated by calculating different scores. The accuracy (acc.), precision (prec.), recall, F1-score (F1), and Jaccard Index (Jaccard) were calculated with the obtained values from the confusion matrix. (C) QuaPOS-LM can be applied to predict the labels from S-opsin-stained croysections at different postnatal development stages (P8–P24; scale bar = 25 μm). (D) Inspecting the orthogonal view of an intensity image and its corresponding prediction showed that QuaPOS-LM can predict S-opsin-stained cone POS in 3D image stacks (scale bar = 25 μm). (E) POS number increased throughout postnatal development. The number of POS was estimated by the number of predicted labels in each image. The average number of POS per timepoint was computed from the average values of respective biological replicates (mean ± SEM, n = 3–5, N = 3, one-way ANOVA followed by post-hoc Tukey test, * p < 0.05, ** p < 0.01, *** p < 0.001). (F) The summed POS volume increased throughout postnatal development. The summed POS volume was determined in each image and averaged by the biological replicate. The average summed POS volume was computed from the biological replicates (mean ± SEM, n = 3–5, N = 3, one-way ANOVA followed by post-hoc Tukey test, * p < 0.05, ** p < 0.01, *** p < 0.001). (G,G′) The bounding box height increased throughout postnatal development. (G) The average POS bounding box height was determined in each image. Afterwards, the average per biological replicate was determined (mean ± SEM, n = 3–5, N = 3, one-way ANOVA followed by post-hoc Tukey test, * p < 0.05, ** p < 0.01, *** p < 0.001). (G′) A boxplot representation of the POS bounding box height. Here, all measured POS were pooled according to age, independent of the biological replicate. Whiskers represent the 1.5 interquartile range. An increase in the bounding box height was observed.
Figure 3
Figure 3
QuaPOS-TEM can efficiently quantify the coherency of POS disc membranes. (A,A′) Using electron microscopic micrographs, QuaPOS-TEM calculates the orientations (blue sticks) as nematic directors based on the image intensity gradient within a sliding window of 5 × 5 pixels (blue box) centered around the query point. This orientation field tracks the underlying membranous structures (A′). (A″) Subsequently, the coherency (degree of alignment) of the orientations is computed in a box of 25 × 25 pixels (red box, local alignment) or across complete ROIs (global alignment). The coherency is represented as a red stick with a certain length and direction. (B–D) POS of WT mice of different developmental ages (P8, P10, and P16) showed various membrane morphologies on TEM images. Scale bar = 1 μm. (B′–D′,B″–D″) Within selected ROIs (yellow contour), the orientation of the membranes was tracked and their coherency was computed. Local coherencies were visualized as thin red sticks of a certain length and angle and emphasized by background color (B″–D″). The higher the local coherency was, the longer the stick and the brighter the background. Global coherencies were shown as thick red sticks (B″–D″). (E–G) Density functions revealed the distribution of local coherencies (red areas) and the resulting mean local coherency (thick red line) and global coherency (thick orange line). The “chaotic” POS (E) showed low, the “partly stacked” POS (F) medium, and the “stacked” POS (G) high values. (E′,F′,G′) The directions of local coherencies within each ROI were plotted as polar histograms (red outlines) respecting the 180-degree symmetry and showed the computed angle of the global coherency (thick orange line). The polar histogram of the “chaotic” POS (E′) showed a variety of different coherency directions, while the “partly stacked” POS (F′) and “stacked” POS (G′) corresponded to narrow distributions of coherency angles.
Figure 4
Figure 4
QuaPOS-LM revealed a decrease in cone POS number and volume in a cone degeneration mouse model over time. (A) QuaPOS-LM predicted POS on a dataset of S-opsin-stained retinal images from cone photoreceptor function loss 1 mice (Cpfl1) over time (P8–P245) (Scale bar = 25 µm). (B,B′) Cpfl1 mice showed a decline in POS number with increasing age. (B) Analyzing the Cpfl1 dataset alone revealed an increase in POS number from P08–P14 and a decline until P245 (mean ± SEM, n = 3–4, N = 1, one-way ANOVA followed by a post-hoc Tukey test, * p < 0.05, ** p < 0.01, *** p < 0.001. (B′) In comparison to age-matched WT control animals, Cpfl1 mice showed a reduction of POS at P70 and P245 (mean ± SEM, n = 3–4, N = 1, independent t-test, * p < 0.05). (C,C′) Cpfl1 mice showed a reduction of the summed POS volume with increasing age. The summed POS volume was determined as the summed volume of each image. (C) Analyzing the Cpfl1 dataset alone revealed an increase in the summed POS volume from P8 to P14, followed by a decline until P245 (mean ± SEM, n = 3–4, N = 1, one-way ANOVA followed by a post-hoc Tukey test, * p < 0.05, ** p < 0.01, *** p < 0.001). (C′) Cpfl1 mice showed significant differences in the summed POS volume at P30, P70, and P245 in comparison to age-matched WT control animals (mean ± SEM, n = 3–4, N = 1, independent t-test, * p < 0.05, ** p < 0.01). (D) Cpfl1 animals showed an increase in the POS bounding box height from P8 to P24. Afterwards, the POS bounding box height remained at 3 μm (mean ± SEM, n = 3–4, N = 1, one-way ANOVA followed by a post-hoc Tukey test, * p < 0.05, ** p < 0.01, *** p < 0.001). (D′) In comparison to age-matched WT controls, Cpfl1 animals showed a significant decrease in the POS bounding box height at the ages P8, P30, P70, and P245 (mean ± SEM, n = 3–4, N = 1, independent t-test, * p < 0.05, ** p < 0.01). (E) A heatmap representation of the correlation matrix showed the relationships between all measured features. Pearson’s R correlation coefficients were calculated from averaged values, excluding P8. (E′) Correlation vector of the age alone, computed from the correlation matrix. The correlation vector showed the Pearson’s R correlation coefficient of all measured features with age.
Figure 5
Figure 5
QuaPOS-TEM showed increasing coherency of POS disc membranes during the postnatal development of wild-type mice. (A,A′,A″) On selected grayscale TEM images of C57BL/6JRj (WT) retinas from postnatal age P8 to P20 (exemplary images shown for P10), ROIs were selected manually before the orientation and coherency fields were calculated. Scale bar = 5 μm. (B–E) Whole images were analyzed automatically, and mean local coherency, global coherency, and the angle of global coherency were retrieved for all selected ROIs. The ratio of global and local coherency was calculated per ROI. Plots show the values of individual ROIs (mean ± SEM, n = 2–3 with 12–30 ROIs each). An increase in local and global coherency of POS membranes over time was observed. (F) The alignment of the angle of global coherency was computed per biological replicate (mean ± SEM n = 2–3). (C–F) One-way analyses of the variance revealed significant dependency on postnatal age for all analyzed measures (n = 2–3, one-way ANOVA followed by a post-hoc Tukey test, * p < 0.05, ** p < 0.01, *** p < 0.001, **** < 0.0001).
Figure 6
Figure 6
QuaPOS-TEM reveals defects in the coherency of POS membranes in the retinal degeneration mouse models RhoKO and rd19. (A–D) POS morphology is disturbed in RhoKO and rd19 retinas compared to WT mice on TEM images at 1 month of age. Scale bar = 0.5 μm. POS of RhoKO mice showed “chaotic” or “partly stacked” membrane morphology (A,B). POS of rd19 mice contained “stacked packages” of membranes (C). Control WT mice displayed POS with “stacked” membranes (D). (A′–D′,A″–D″) Within selected ROIs (yellow contour), the orientation of the membranes was tracked as orientation field (blue sticks), and their coherency was computed. Local coherencies were visualized as thin red sticks of a certain length and angle and emphasized by background color (A″–D″). Global coherencies were shown as thick red sticks (A″–D″). (E–H) Density functions revealed the distribution of local coherencies (red areas) and the resulting mean local coherency (thick red line) and global coherency (thick orange line). The POS with “chaotic” membranes (E) or “stacked packages” of membranes (G) showed low coherency, the one with “partly stacked” membranes (F) resulted in medium, and the POS with “stacked” membranes yielded (G) high coherency values. (E′–H′) The directions of local coherencies within each ROI were plotted as polar histograms (red outlines) respecting the 180-degree symmetry and showed the computed angle of the global coherency (thick orange line). The polar histogram of the “chaotic” (E′) and “stacked packages” (G′) POS showed a variety of different coherency directions, while the “partly stacked” POS (F′) and “stacked” POS (H′) corresponded to (more) narrow distributions of coherency angles. (I–L) Several ROIs of RhoKO, rd19, and WT were analyzed automatically on selected TEM images. Mean local coherency, global coherency, and the angle of global coherency were retrieved, and the ratio of global to local coherency was calculated per ROI. (J–L) Plots show values of individual ROIs (mean ± SEM, n = 1–2 with 19–22 ROIs each). One-way analyses of variance revealed significant dependency on mouse line for all analyzed measures (one-way ANOVA followed by a post-hoc Tukey test, * p < 0.05, ** p < 0.01, *** p < 0.001, **** < 0.0001).

Similar articles

References

    1. Aguirre G. D., Cideciyan A. V., Dufour V. L., Ripolles-García A., Sudharsan R., Swider M., et al. . (2021). Gene therapy reforms photoreceptor structure and restores vision in NPHP5-associated Leber congenital Amaurosis. Mol. Ther. 29, 2456–2468. doi: 10.1016/j.ymthe.2021.03.021, PMID: - DOI - PMC - PubMed
    1. Almedawar S., Vafia K., Schreiter S., Neumann K., Khattak S., Kurth T., et al. . (2020). MERTK-dependent Ensheathment of photoreceptor outer segments by human pluripotent stem cell-derived retinal pigment epithelium. Stem Cell Reports 14, 374–389. doi: 10.1016/j.stemcr.2020.02.004, PMID: - DOI - PMC - PubMed
    1. Assawachananont J., Mandai M., Okamoto S., Yamada C., Eiraku M., Yonemura S., et al. . (2014). Transplantation of embryonic and induced pluripotent stem cell-derived 3D retinal sheets into retinal degenerative mice. Stem Cell Reports 2, 662–674. doi: 10.1016/j.stemcr.2014.03.011, PMID: - DOI - PMC - PubMed
    1. Aswath A., Alsahaf A., Giepmans B. N. G., Azzopardi G. (2023). Segmentation in large-scale cellular Electron microscopy with deep learning: a literature survey. Med. Image Anal. 89:102920. doi: 10.1016/j.media.2023.102920, PMID: - DOI - PubMed
    1. Baden T., Euler T., Berens P. (2020). Understanding the retinal basis of vision across species. Nat. Rev. Neurosci. 21, 5–20. doi: 10.1038/s41583-019-0242-1, PMID: - DOI - PubMed

LinkOut - more resources