

Identification of a Prognostic Model Based on NK Cell-Related Genes in Multiple Myeloma Using Single-Cell and Transcriptomic Data Analysis
- PMID: 38854627
- PMCID: PMC11162243
- DOI: 10.2147/BLCTT.S461529
Identification of a Prognostic Model Based on NK Cell-Related Genes in Multiple Myeloma Using Single-Cell and Transcriptomic Data Analysis
Abstract
Background: Multiple myeloma (MM), an incurable plasma cell malignancy. The significance of the relationship between natural killer (NK) cell-related genes and clinical factors in MM remains unclear.
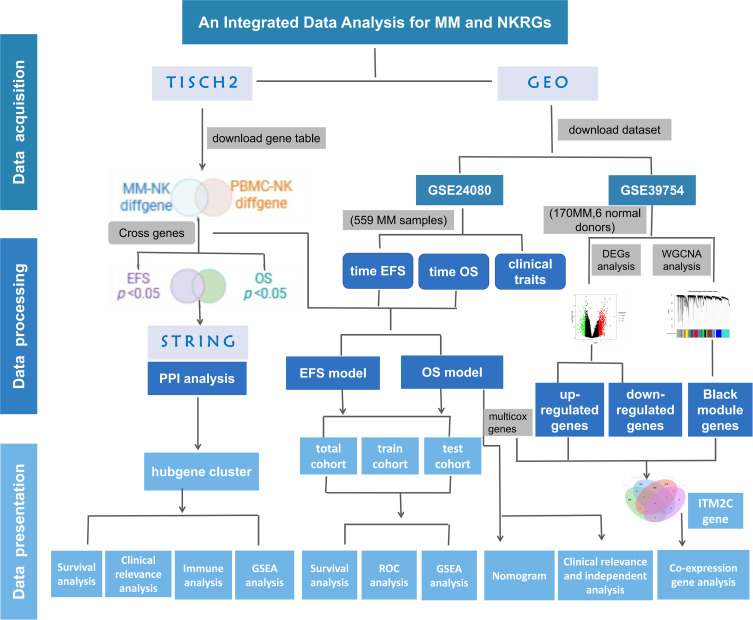
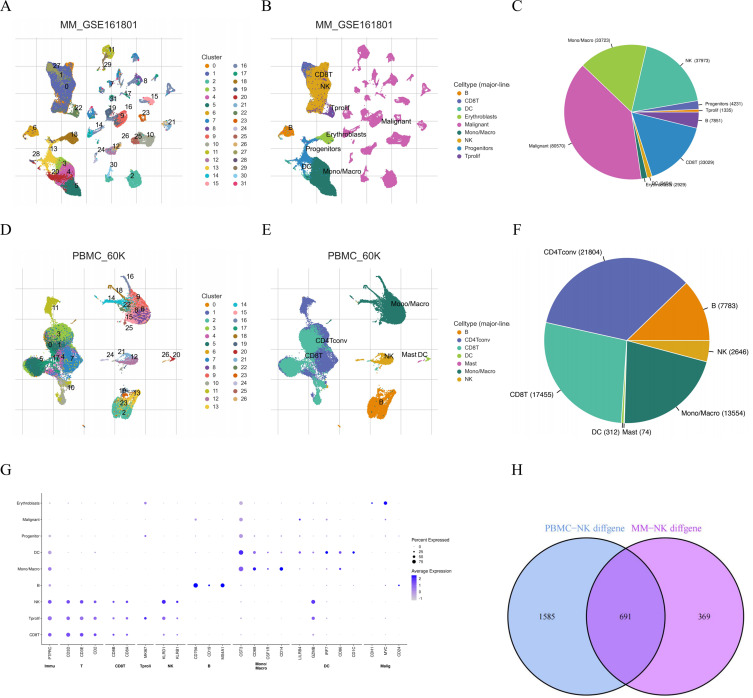
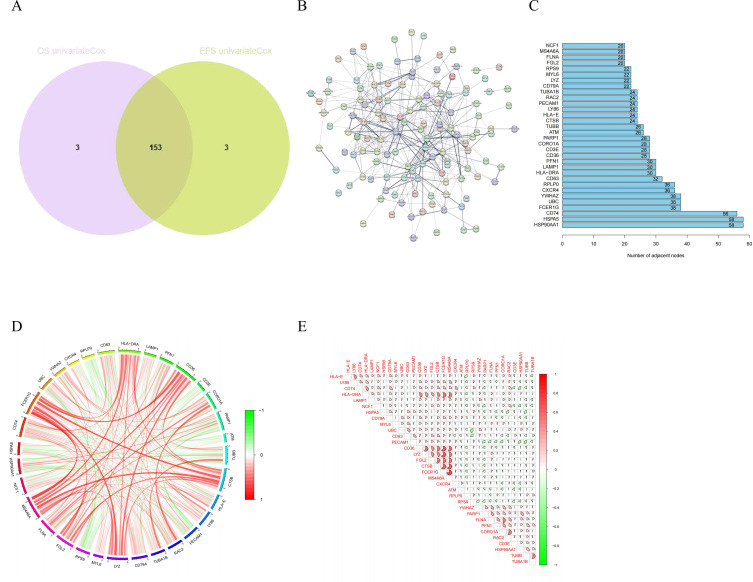
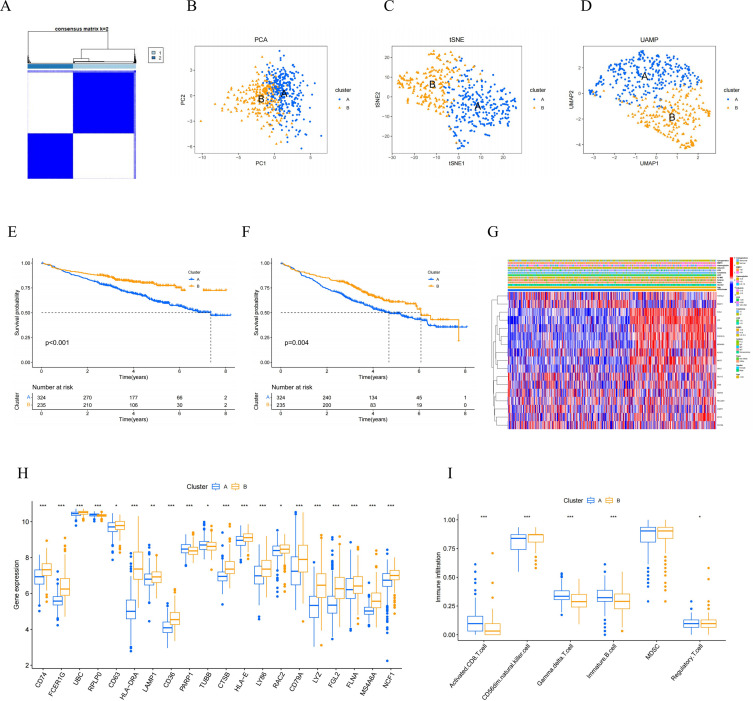
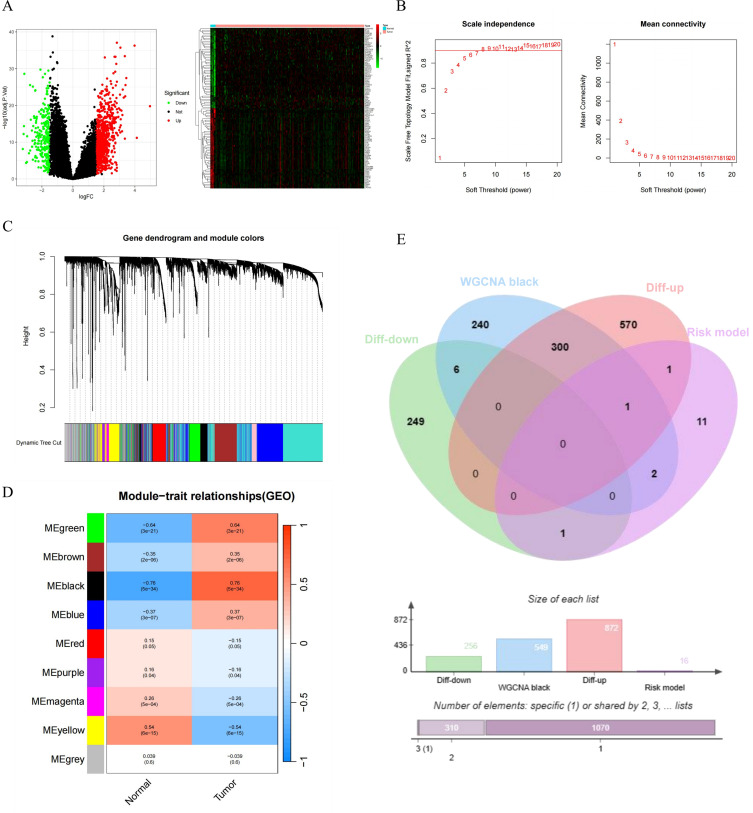
Methods: Initially, we extracted NK cell-related genes from peripheral blood mononuclear cells (PBMC) of healthy donors and MM samples by employing single-cell transcriptome data analysis in TISCH2. Subsequently, we screened NK cell-related genes with prognostic significance through univariate Cox regression analysis and protein-protein interaction (PPI) network analysis. Following the initial analyses, we developed potential subtypes and prognostic models for MM using consensus clustering and lasso regression analysis. Additionally, we conducted a correlation analysis to explore the relationship between clinical features and risk scores. Finally, we constructed a weighted gene co-expression network analysis (WGCNA) and identified differentially expressed genes (DEGs) within the MM cohort.
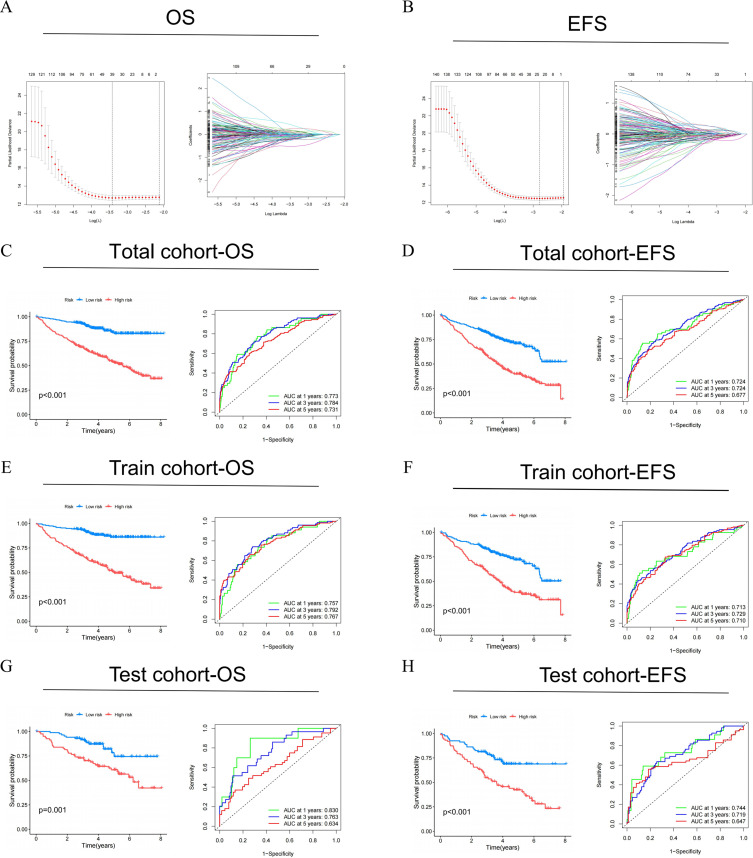
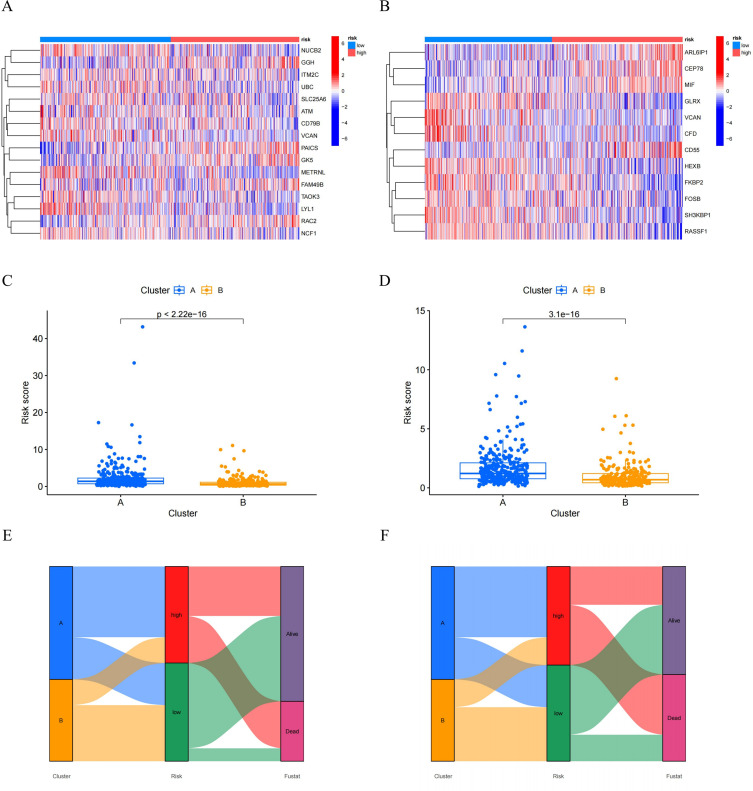
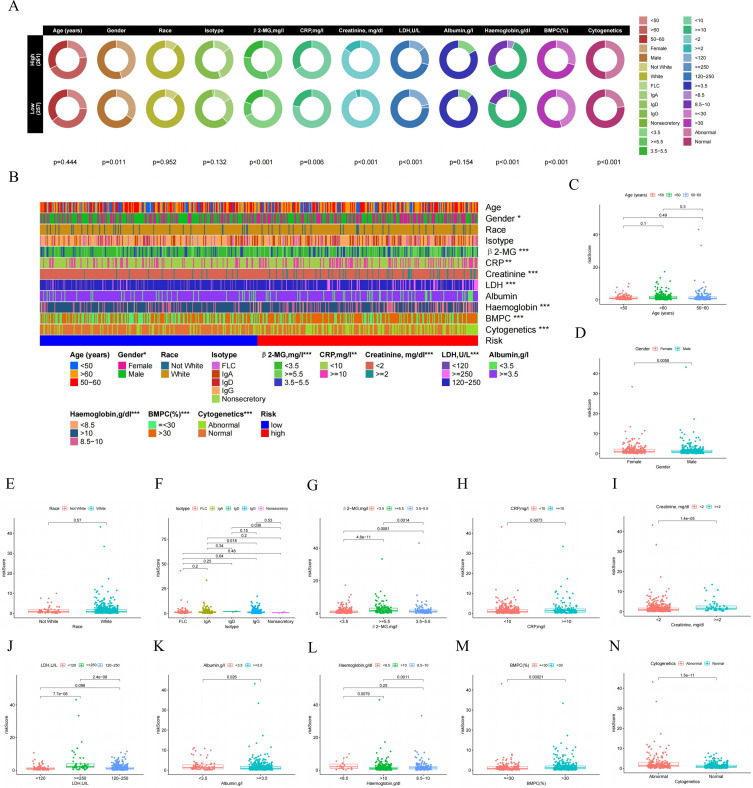
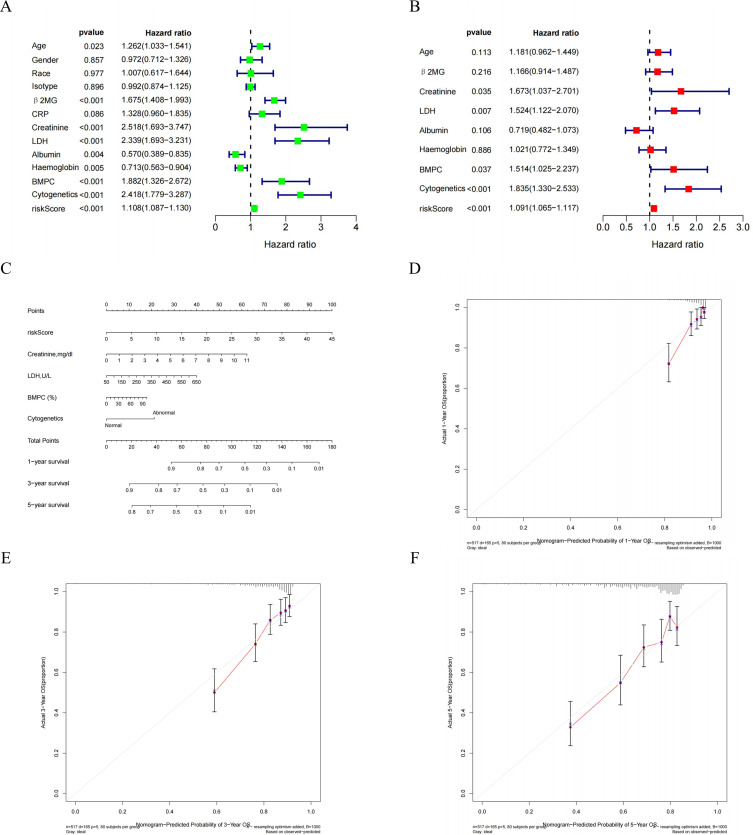
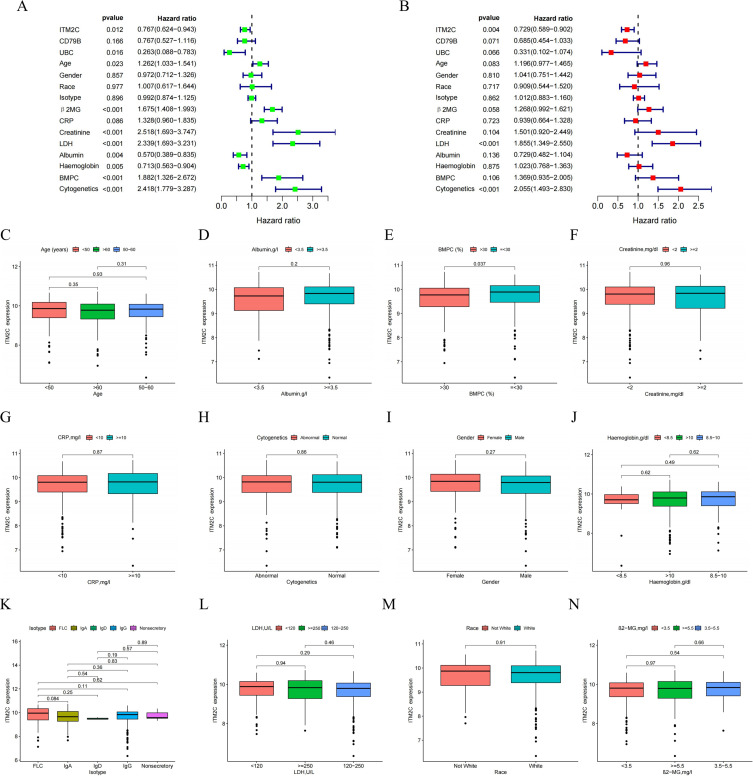
Results: We discovered that 153 NK cell-related genes were significantly associated with the prognosisof MM patients (P <0.05). Patients in NK cluster A exhibited poorer survival outcomes compared to those in cluster B. Furthermore, our NK cell-related genes risk model revealed that patients with a high risk score had significantly worse prognoses (P <0.05). Patients with a high risk score were more likely to exhibit adverse clinical markers. Additionally, the nomogram based on NK cell-related genes demonstrated strong prognostic performance. The enrichment analysis indicated that immune-related pathways were significantly correlated with both the NK subtypes and the NK cell-related genes risk model. Ultimately, through the combined use of WGCNA and DEGs analysis, and by employing Venn diagrams, we determined that ITM2C is an independent prognostic marker for MM patients.
Conclusion: In this study, we developed a novel model based on NK cell-related genes to stratify the prognosis of MM patients. Notably, higher expression levels of ITM2C were associated with more favorable survival outcomes in these patients.
Keywords: ITM2C; NK cell-related genes; NK subtypes; multiple myeloma; prognostic model.
© 2024 Mei et al.
Conflict of interest statement
The authors declare no conflicts of interest in this work.
Figures
Similar articles
-
Identification of cuproptosis-related subtypes, construction of a prognosis model, and tumor microenvironment landscape in gastric cancer.Front Immunol. 2022 Nov 21;13:1056932. doi: 10.3389/fimmu.2022.1056932. eCollection 2022. Front Immunol. 2022. PMID: 36479114 Free PMC article.
-
The fatty acid-related gene signature stratifies poor prognosis patients and characterizes TIME in cutaneous melanoma.J Cancer Res Clin Oncol. 2024 Jan 27;150(2):40. doi: 10.1007/s00432-023-05580-7. J Cancer Res Clin Oncol. 2024. PMID: 38279987 Free PMC article.
-
Comprehensive FGFR3 alteration-related transcriptomic characterization is involved in immune infiltration and correlated with prognosis and immunotherapy response of bladder cancer.Front Immunol. 2022 Jul 26;13:931906. doi: 10.3389/fimmu.2022.931906. eCollection 2022. Front Immunol. 2022. PMID: 35958598 Free PMC article.
-
Identification of a three-gene-based prognostic model in multiple myeloma using bioinformatics analysis.PeerJ. 2021 Jun 28;9:e11320. doi: 10.7717/peerj.11320. eCollection 2021. PeerJ. 2021. PMID: 34249481 Free PMC article.
-
Development and validation a prognostic model based on natural killer T cells marker genes for predicting prognosis and characterizing immune status in glioblastoma through integrated analysis of single-cell and bulk RNA sequencing.Funct Integr Genomics. 2023 Aug 31;23(3):286. doi: 10.1007/s10142-023-01217-7. Funct Integr Genomics. 2023. PMID: 37650991
References
LinkOut - more resources
Full Text Sources
