

Construction and validation of an endoscopic ultrasonography-based ultrasomics nomogram for differentiating pancreatic neuroendocrine tumors from pancreatic cancer
- PMID: 38854733
- PMCID: PMC11158619
- DOI: 10.3389/fonc.2024.1359364
Construction and validation of an endoscopic ultrasonography-based ultrasomics nomogram for differentiating pancreatic neuroendocrine tumors from pancreatic cancer
Abstract
Objectives: To develop and validate various ultrasomics models based on endoscopic ultrasonography (EUS) for retrospective differentiating pancreatic neuroendocrine tumors (PNET) from pancreatic cancer.
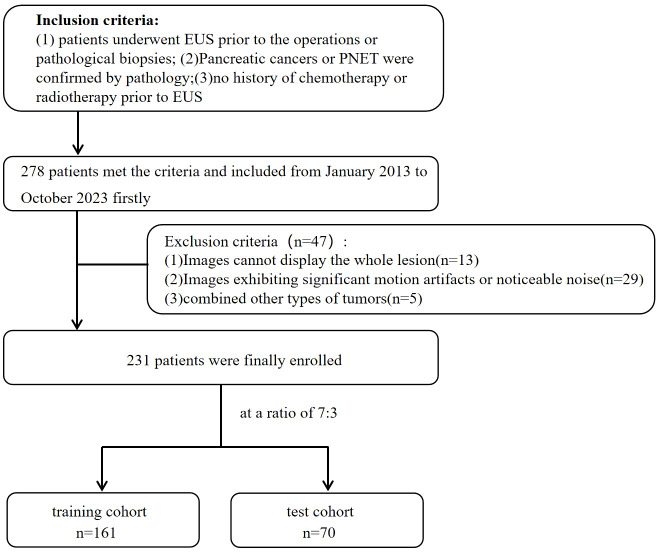
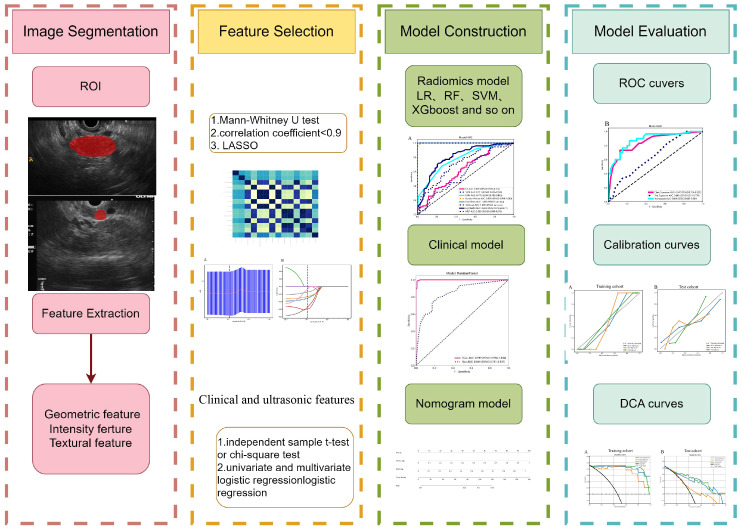
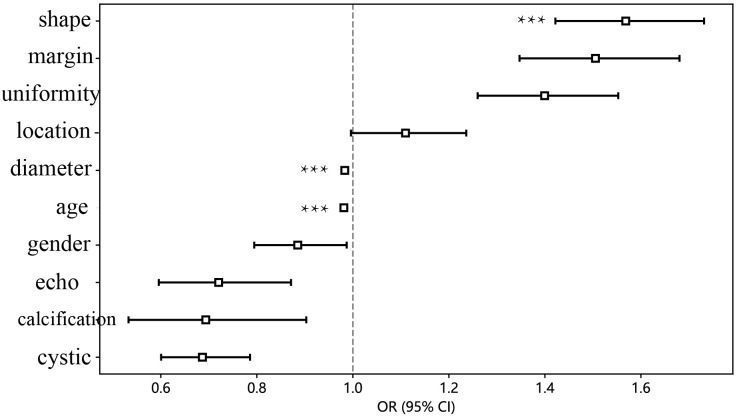
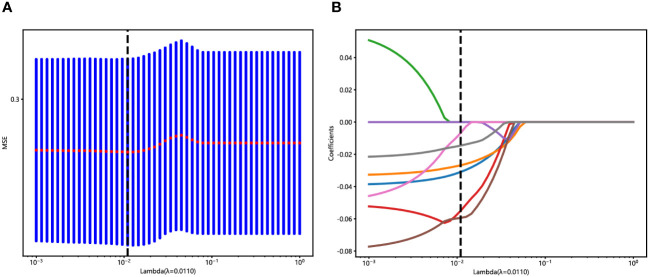
Methods: A total of 231 patients, comprising 127 with pancreatic cancer and 104 with PNET, were retrospectively enrolled. These patients were randomly divided into either a training or test cohort at a ratio of 7:3. Ultrasomics features were extracted from conventional EUS images, focusing on delineating the region of interest (ROI) for pancreatic lesions. Subsequently, dimensionality reduction of the ultrasomics features was performed by applying the Mann-Whitney test and least absolute shrinkage and selection operator (LASSO) algorithm. Eight machine learning algorithms, namely logistic regression (LR), light gradient boosting machine (LightGBM), multilayer perceptron (MLP), random forest (RF), extra trees, k nearest neighbors (KNN), support vector machine (SVM), and extreme gradient boosting (XGBoost), were employed to train prediction models using nonzero coefficient features. The optimal ultrasomics model was determined using a ROC curve and utilized for subsequent analysis. Clinical-ultrasonic features were assessed using both univariate and multivariate logistic regression. An ultrasomics nomogram model, integrating both ultrasomics and clinical-ultrasonic features, was developed.
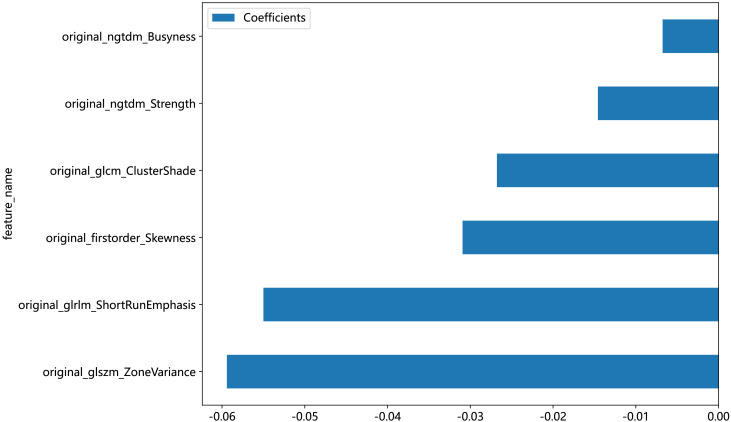
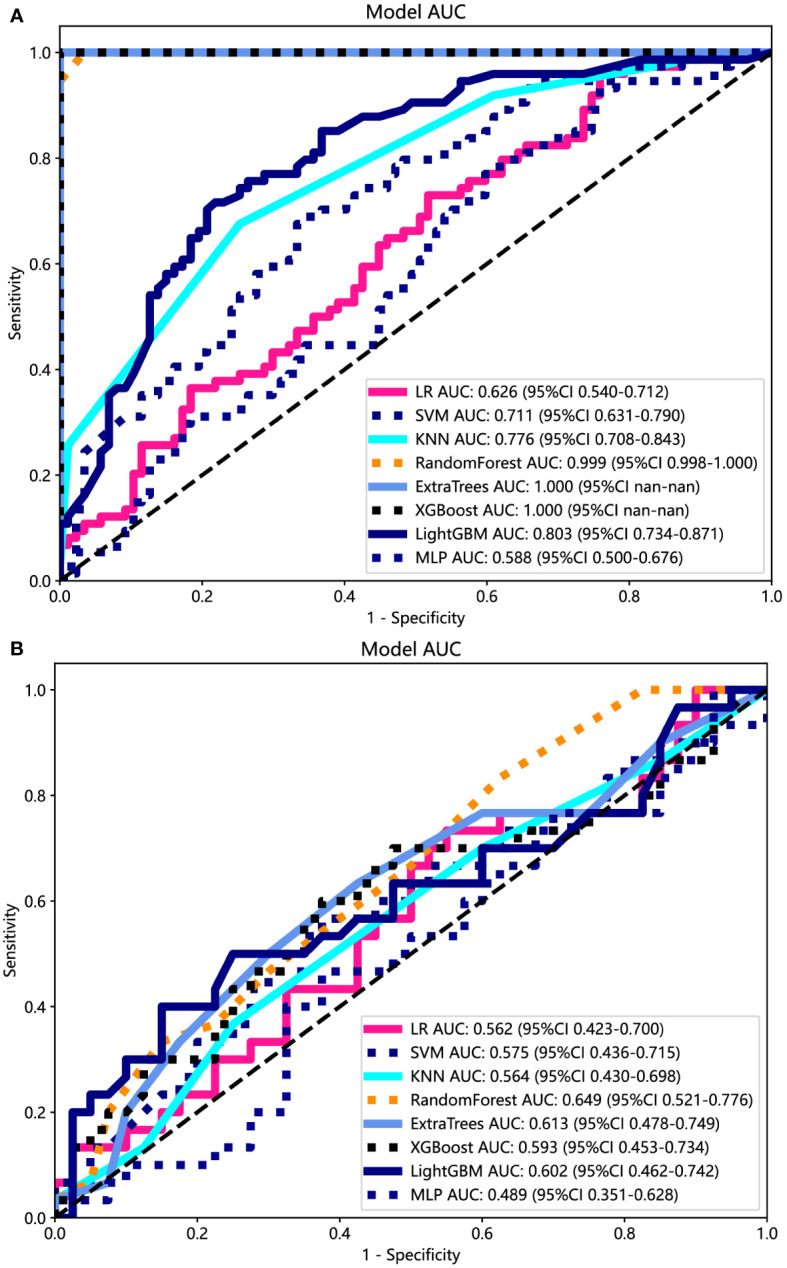
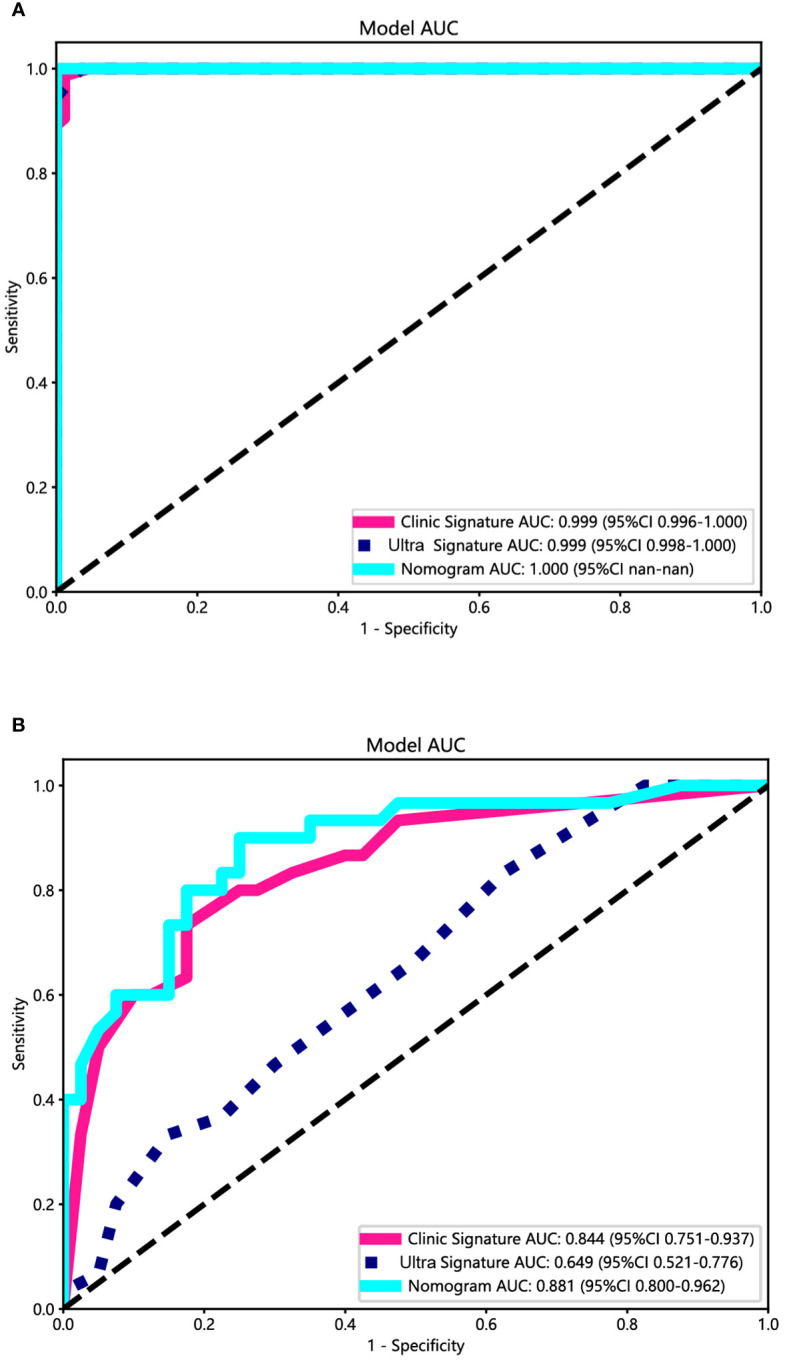
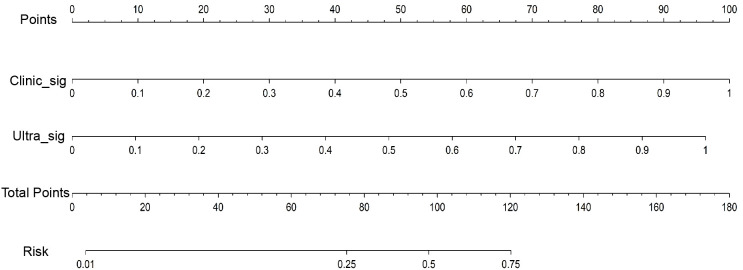
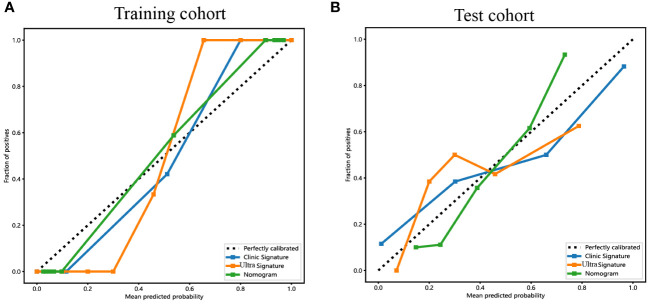
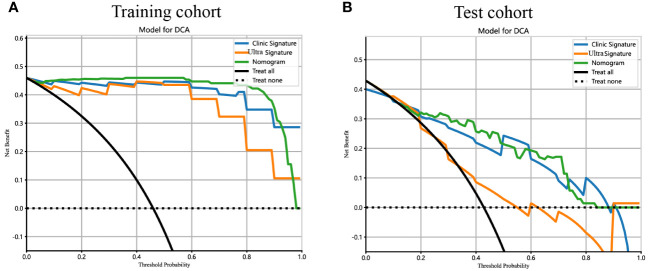
Results: A total of 107 EUS-based ultrasomics features were extracted, and 6 features with nonzero coefficients were ultimately retained. Among the eight ultrasomics models based on machine learning algorithms, the RF model exhibited superior performance with an AUC= 0.999 (95% CI 0.9977 - 1.0000) in the training cohort and an AUC= 0.649 (95% CI 0.5215 - 0.7760) in the test cohort. A clinical-ultrasonic model was established and evaluated, yielding an AUC of 0.999 (95% CI 0.9961 - 1.0000) in the training cohort and 0.847 (95% CI 0.7543 - 0.9391) in the test cohort. Subsequently, the ultrasomics nomogram demonstrated a significant improvement in prediction accuracy in the test cohort, as evidenced by an AUC of 0.884 (95% CI 0.8047 - 0.9635) and confirmed by the Delong test. The calibration curve and decision curve analysis (DCA) depicted this ultrasomics nomogram demonstrated superior accuracy. They also yielded the highest net benefit for clinical decision-making compared to alternative models.
Conclusions: A novel ultrasomics nomogram was proposed and validated, that integrated clinical-ultrasonic and ultrasomics features obtained through EUS, aiming to accurately and efficiently identify pancreatic cancer and PNET.
Keywords: endoscopic ultrasonography; machine learning; nomogram; pancreatic cancer; pancreatic neuroendocrine tumors; ultrasomics.
Copyright © 2024 Mo, Huang, Wang, Zhao, Wei, Qin, Jiang and Qin.
Conflict of interest statement
The authors declare that the research was conducted in the absence of any commercial or financial relationships that could be construed as a potential conflict of interest.
Figures
Similar articles
-
Endoscopic ultrasonography-based intratumoral and peritumoral machine learning ultrasomics model for predicting the pathological grading of pancreatic neuroendocrine tumors.BMC Med Imaging. 2025 Jan 18;25(1):22. doi: 10.1186/s12880-025-01555-x. BMC Med Imaging. 2025. PMID: 39827128 Free PMC article.
-
EUS-based intratumoral and peritumoral machine learning radiomics analysis for distinguishing pancreatic neuroendocrine tumors from pancreatic cancer.Front Oncol. 2025 Mar 4;15:1442209. doi: 10.3389/fonc.2025.1442209. eCollection 2025. Front Oncol. 2025. PMID: 40104505 Free PMC article.
-
A novel endoscopic ultrasomics-based machine learning model and nomogram to predict the pathological grading of pancreatic neuroendocrine tumors.Heliyon. 2024 Jul 9;10(14):e34344. doi: 10.1016/j.heliyon.2024.e34344. eCollection 2024 Jul 30. Heliyon. 2024. PMID: 39130461 Free PMC article.
-
The CMLA score: A novel tool for early prediction of renal replacement therapy in patients with cardiogenic shock.Curr Probl Cardiol. 2024 Dec;49(12):102870. doi: 10.1016/j.cpcardiol.2024.102870. Epub 2024 Sep 27. Curr Probl Cardiol. 2024. PMID: 39343053 Review.
-
Interpretable machine learning model to predict surgical difficulty in laparoscopic resection for rectal cancer.Front Oncol. 2024 Feb 6;14:1337219. doi: 10.3389/fonc.2024.1337219. eCollection 2024. Front Oncol. 2024. PMID: 38380369 Free PMC article. Review.
Cited by
-
Endoscopic ultrasonography-based intratumoral and peritumoral machine learning ultrasomics model for predicting the pathological grading of pancreatic neuroendocrine tumors.BMC Med Imaging. 2025 Jan 18;25(1):22. doi: 10.1186/s12880-025-01555-x. BMC Med Imaging. 2025. PMID: 39827128 Free PMC article.
-
Artificial Intelligence in Pancreatic Imaging: A Systematic Review.United European Gastroenterol J. 2025 Feb;13(1):55-77. doi: 10.1002/ueg2.12723. Epub 2025 Jan 26. United European Gastroenterol J. 2025. PMID: 39865461 Free PMC article.
-
EUS-based intratumoral and peritumoral machine learning radiomics analysis for distinguishing pancreatic neuroendocrine tumors from pancreatic cancer.Front Oncol. 2025 Mar 4;15:1442209. doi: 10.3389/fonc.2025.1442209. eCollection 2025. Front Oncol. 2025. PMID: 40104505 Free PMC article.
-
An endoscopic ultrasound-based interpretable deep learning model and nomogram for distinguishing pancreatic neuroendocrine tumors from pancreatic cancer.Sci Rep. 2025 Jan 27;15(1):3383. doi: 10.1038/s41598-024-84749-7. Sci Rep. 2025. PMID: 39870667 Free PMC article.
-
Clinical value of the nomogram model based on endoscopic ultrasonography radiomics and clinical indicators in identifying benign and malignant lesions of the pancreas.Front Oncol. 2025 Feb 19;15:1504593. doi: 10.3389/fonc.2025.1504593. eCollection 2025. Front Oncol. 2025. PMID: 40046629 Free PMC article.
References
LinkOut - more resources
Full Text Sources