. 2024 Jun 6:12:e17535.
doi: 10.7717/peerj.17535. eCollection 2024.

Movement patterns of two reintegrated African elephant (Loxodonta africana) herds: transitioning from captivity to free-living

Affiliations

Movement patterns of two reintegrated African elephant (Loxodonta africana) herds: transitioning from captivity to free-living

Tenisha Roos et al. PeerJ. .

Abstract

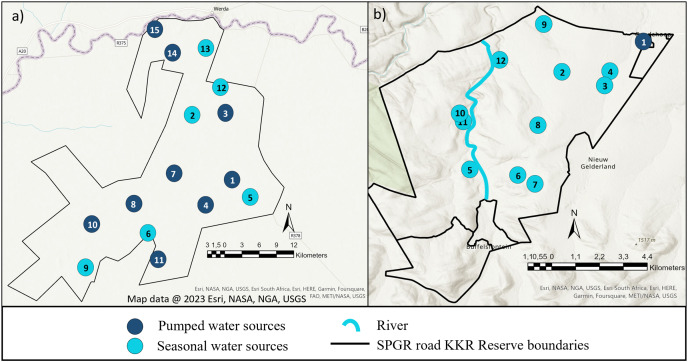
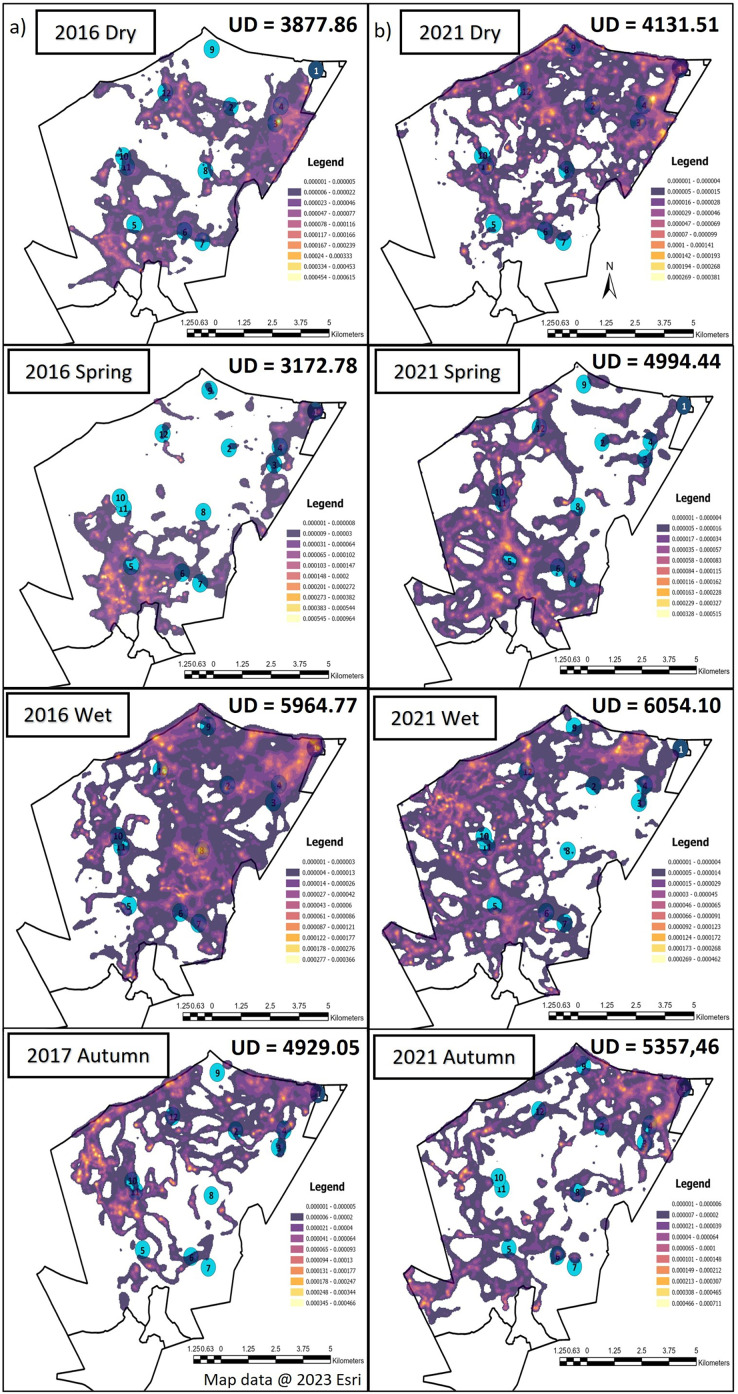
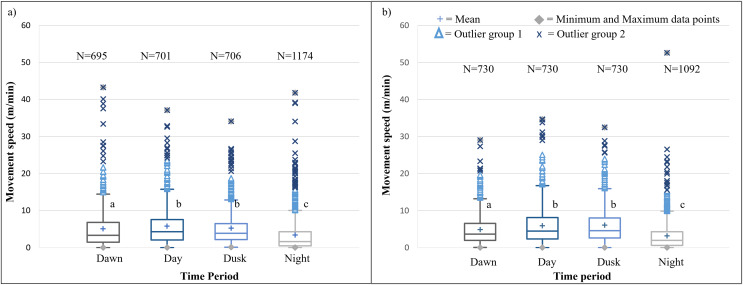
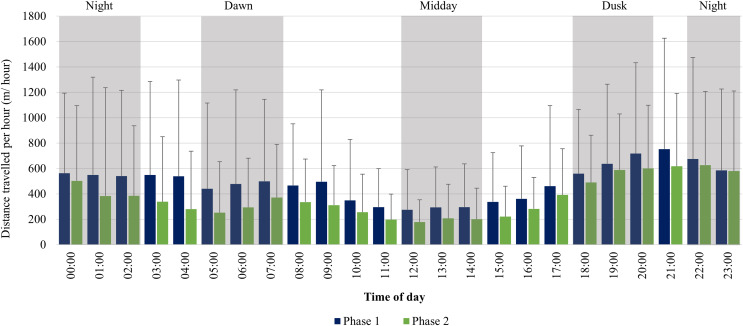
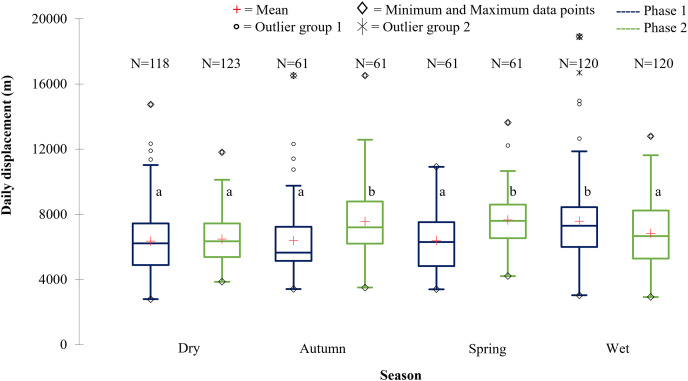
With the escalating challenges in captive elephant management, the study of elephant reintegration emerges as a pivotal area of research, primarily addressing the enhancement of animal welfare. The term 'reintegration' refers to the process of rehabilitating captive elephants to a natural system, allowing them to roam freely without intensive human intervention. There is a relative paucity of research addressing the behavioural adaptations post-reintegration, despite reintegration of over 20 elephants across various fenced reserves in South Africa. Our study centres on two distinct herds of reintegrated African elephants, monitoring their movement patterns in two South African reserves over a 57-month period post-release. The primary goal of the study was to establish whether the flexibility and adaptability of movement behaviour of reintegrated elephants can be considered as one of the indicators of determining the success of such an operation. The second aim of our study was to investigate if the reintegrated elephants demonstrated an adaptability to their environment through their hourly, daily, and seasonal ranging patterns after a period of free roaming that exceeded 4 years. Our findings indicated that reintegrated elephants, much like their wild counterparts (movement based on literature), displayed notable seasonal and diurnal variations in key movement parameters, such as utilisation distribution areas and reserve utilization. These patterns changed over time, reflecting an adaptive shift in movement patterns after several years of free roaming. Notably, the trajectory of changes in movement parameters varied between herds, indicating unique adaptation responses, likely resulting from differences in the reintegration process (familiarity of reserve, season of release, presence of wild elephants). Although our study is constrained by the limited number of reintegrated herds available for analysis, it underscores the potential of captive elephants to successfully adapt to a free-living environment, emphasising the promising implications of reintegration initiatives.

Keywords: African elephant; Captive elephants; Movement patterns; Reintegration; Welfare.


Conflict of interest statement

Audrey Delsink is the Wildlife Director of the Humane Society International-Africa. Hanno Kilian is the Ecologist at !Khamab Kalahari Reserve. Andrew Purdon is employed by M.A.P Scientific Services.

Figures

Figure 1
Figure 1. Illustration of the layout of !Khamab Kalahari Reserve and Shambala Private Game Reserves.
Map illustrating the layout of (A) !Khamab Kalahari Reserve and (B) Shambala Private Game Reserve. Map data @ 2023 Esri.
Figure 2
Figure 2. Illustration of the elephants, and the relationship between one another, that are currently on Shambala Private Game Reserve and !Khamab Kalahari Reserve.
Illustration of the elephants (origin, sex, and date of birth), and the relationship between one another, that are currently on (A) Shambala Private Game Reserve and (B) !Khamab Kalahari Reserve (SAM, Sub-adult male; YAF, Young adult female; SAF, Sub-adult female; JF, Juvenile female). (The sexes of Calf 4 and Calf 5 are unknown).
Figure 3
Figure 3. The utilization distributions that were observed during the dry, spring, wet and autumn season, 12 months post release, and when the elephants on SPGR have been roaming free for 57 months.
Illustration of the utilization distribution area (UD—hectares) and utilisation distributions (high and low use) during the dry, spring, wet and autumn season, (A) 12 months post release (Phase 1) and (B) when the elephants on SPGR had been roaming free for 57 months (Phase 2). Map data @ 2023 Esri.
Figure 4
Figure 4. The utilization distributions that were observed during wet, autumn, dry, and spring seasons, 12 months post-release and when the elephants have been free roaming on KKR for 57 months.
Illustration of the Utilization distributions area (UD—hectares) and the utilisation distributions (high and low use) observed during wet, autumn, dry, and spring seasons, (A) 12 months post release and (B) when the elephants have been free roaming on KKR for 57 months. Map data @ 2023 Esri.
Figure 5
Figure 5. SPGR elephants’ average moving speed (m/min) 12 months days post release (Phase 1) compared to when free roaming for 57 months on SPGR (Phase 2).
SPGR elephants’ average moving speed (m/min) (A) 12 months post-release (Phase 1) compared to when free roaming for (B) 57 months on SPGR (Phase 2). The crosses represent the means, whereas the central horizontal bars are the medians. The first and third quartiles are the lower and upper limits of the box, respectively. The whiskers represent the minimum and maximum values. The points above or below the whiskers’ upper and lower bounds may be considered outliers (the blue dots represent outlier group 1 (>1.5 interquartile ranges from the median), blue stars represent outlier group 2 (>3 interquartile ranges from the median), and the grey diamonds represent the minimum and maximum data points). Different letters within each Phase represent significant differences between the average movement speeds exhibited across the four time periods (N = number of observation days).
Figure 6
Figure 6. SPGR elephants’ average hourly displacements 12 months post-release compared to when they have been free roaming on SPGR for 57 months.
SPGR elephants’ average hourly displacements (+SD) 12 months post release (Phase 1) compared to when free roaming on SPGR for 57 months (Phase 2).
Figure 7
Figure 7. KKR elephants’ average moving speed (m/mins) 12 months post-release (Phase 1) compared to when they had been free roaming for 57 months on KKR (Phase 2).
KKR elephants’ average moving speed (A) 12 months post release (Phase 1) compared to when (B) free roaming for 57 months on KKR (Phase 2). The crosses represent the means, whereas the central horizontal bars are the medians. The first and third quartiles are the lower and upper limits of the box, respectively. The whiskers represent the minimum and maximum values. The points above or below the whiskers’ upper and lower bounds may be considered as outliers (the blue dots represent outlier group 1 (>1.5 interquartile ranges from the median), blue stars represent outlier group 2 (>3 interquartile ranges from the median), and the grey diamonds represent the minimum and maximum data points). Different letters within each Phase represent significant differences between the average movement speeds exhibited across the four time periods (N = number of observation days).
Figure 8
Figure 8. KKR elephants’ average hourly displacements travelled 12 months post-release compared to when free roaming for 57 months on KKR.
KKR elephants’ average hourly displacements (+SD) travelled 12 months post release (Phase 1) compared to when free roaming for 57 months on KKR (Phase 2).
Figure 9
Figure 9. The daily displacement exhibited by the SPGR elephants during the dry, autumn, spring, and wet season 12 months post-release compared to when free roaming for 57 months.
The daily displacement exhibited by the SPGR elephants during the dry, autumn, spring, and wet season 12 months post release (Phase 1) compared to when free roaming for 57 months (Phase 2). The red crosses represent the means, whereas the central horizontal bars are the medians. The first and third quartiles are the lower and upper limits of the box, respectively. The whiskers represent the minimum and maximum values. The points above or below the whiskers’ upper and lower bounds may be considered as outliers (the hollow circles represent outlier group 1 (>1.5 interquartile ranges from the median), the stars represent outlier group 2 (>3 interquartile ranges from the median), and the diamonds represent the minimum and maximum data points). Different letters within each Phase represent significant differences between the daily displacement exhibited (m/day) across the four seasons (N = number of observations days).
Figure 10
Figure 10. The daily displacement of the KKR elephants during dry, autumn, spring, and wet season 12 months post-release compared to when free roaming for 57 months.
The daily displacement of the KKR elephants during dry, autumn, spring, and wet season 12 months post release (Phase 1) compared to when free roaming for 57 months (Phase 2). The red crosses represent the means, whereas the central horizontal bars are the medians. The first and third quartiles are the lower and upper limits of the box, respectively. The whiskers represent the minimum and maximum values. The points above or below the whiskers’ upper and lower bounds may be considered as outliers (the hollow circles represent outlier group 1 (>1.5 interquartile ranges from the median), the stars represent outlier group 2 (>3 interquartile ranges from the median), and the diamonds represent the minimum and maximum data points). Different letters within each Phase represent significant differences between the daily displacement exhibited (m/day) across the four seasons (N = number of observations).

Similar articles

References

    1. Allen CRB, Brent LJN, Motsentwa T, Weiss MN, Croft DP. Importance of old bulls: leaders and followers in collective movements of all-male groups in African savannah elephants (Loxodonta africana) Scientific Reports. 2020;10:13996. doi: 10.1038/s41598-020-70682-y. - DOI - PMC - PubMed
    1. Angkavanish T, Thitaram C. Behavioral study and monitoring of Asian elephant (Elephas maximus) reintroduction under the Queen’s initiative. In: Aranovich M, Dufresne O, editors. Elephants: Ecology, Behavior and Conservation. New York: Nova Science Publishers, inc; 2012. pp. 133–144.
    1. Ashraf NVK, Barman R, Mainkar K, Choudhury B. The principles for rehabilitation of large mammals (Asian elephant, Asiatic wild buffalo, Asiatic black bear and greater one-horned rhinoceros) In: Menon V, Ashraf NVK, Panda P, Mainkar K, editors. Back to the Wild: Studies in Wildlife Rehabilitation. New Delhi: Wildlife Trust of India; 2005. pp. 91–103.
    1. Baker L, Winkler R. Asian elephant rescue, rehabilitation and rewilding. Animal Sentience. 2020;5(28):296. doi: 10.51291/2377-7478.1506. - DOI
    1. Bates LA, Sayialel KN, Njiraini NW, Poole JH, Moss CJ, Byrne RW. African elephants have expectations about the locations of out-of-sight family members. Biology Letters. 2008;4(1):34–36. doi: 10.1098/rsbl.2007.0529. - DOI - PMC - PubMed

LinkOut - more resources