Adsorption and biodegradation of the azo dye methyl orange using Ralstonia pickettii immobilized in polyvinyl alcohol (PVA)-alginate-hectorite beads (BHec-RP)
- PMID: 38854831
- PMCID: PMC11158117
- DOI: 10.1039/d3ra08692e
Adsorption and biodegradation of the azo dye methyl orange using Ralstonia pickettii immobilized in polyvinyl alcohol (PVA)-alginate-hectorite beads (BHec-RP)
Abstract
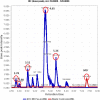
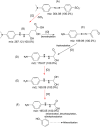
Biological methods are widely used to treat dye waste, particularly methyl orange (MO) dye. The importance of MO degradation stems from its classification as a toxic dye. Within the scope of this research, successful bio-decolorization of MO was achieved through the use of Ralstonia pickettii bacteria immobilized in a PVA-alginate-hectorite matrix (BHec-RP). The optimum conditions for the degradation were observed at a composition of PVA (10%), hectorite (1%), static incubation, 40 °C, and pH 7. Subsequently, the adsorption kinetics of BHec-RP (dead cells) as well as the degradation kinetics of BHec-RP (live cells) and MO using free R. pickettii cells were evaluated. The decolorization of MO using BHec-RP (dead cells) is an adsorption process following pseudo-first-order kinetics (0.6918 mg g-1 beads) and occurs in a monolayer or physical process. Meanwhile, the adoption of BHec-RP (live cells) and free R. pickettii cells shows a degradation process under pseudo-first-order kinetics, with the highest rates at an initial MO concentration of 50 mg L-1 being 0.025 mg L-1 h-1 and 0.015 mg L-1 h-1, respectively. These results show that the immobilization system is superior compared to free R. pickettii cells. Furthermore, the degradation process shows the inclusion of several enzymes, such as azoreductase, NADH-DCIP reductase, and laccase, presumed to be included in the fragmentation of molecules. This results in five fragments based on LC-QTOF/MS analysis, with m/z values of 267.12; 189.09; 179.07; 169.09; and 165.05.
This journal is © The Royal Society of Chemistry.
Conflict of interest statement
There are no conflicts to declare.
Figures


References
-
- Song W. Li J. Zhang X. Feng J. Du X. Wang Q. Fu C. Qiu W. Wang Z. Gao X. J. Environ. Manage. 2022;308:114397. - PubMed
-
- Asranudin Purnomo A. S. Prasetyoko D. Bahruji H. Holilah Mater. Chem. Phys. 2022;291:126749.
-
- Şenol Z. M. El Messaoudi N. Ciğeroglu Z. Miyah Y. Arslanoğlu H. Bağlam N. Kazan-Kaya E. S. Kaur P. Georgin J. Food Chem. 2024;450:139398. - PubMed
-
- El Khomri M. El Messaoudi N. Dbik A. Bentahar S. Fernine Y. Bouich A. Lacherai A. Jada A. Emergent Mater. 2022;5:1679–1688.
LinkOut - more resources
Full Text Sources
Miscellaneous

