. 2024 May 25;8(7):bvae104.
doi: 10.1210/jendso/bvae104. eCollection 2024 May 23.

Key Considerations for Studying the Effects of High-Fat Diet on the Nulligravid Mouse Endometrium

Affiliations

Key Considerations for Studying the Effects of High-Fat Diet on the Nulligravid Mouse Endometrium

Hilary J Skalski et al. J Endocr Soc. .

Abstract

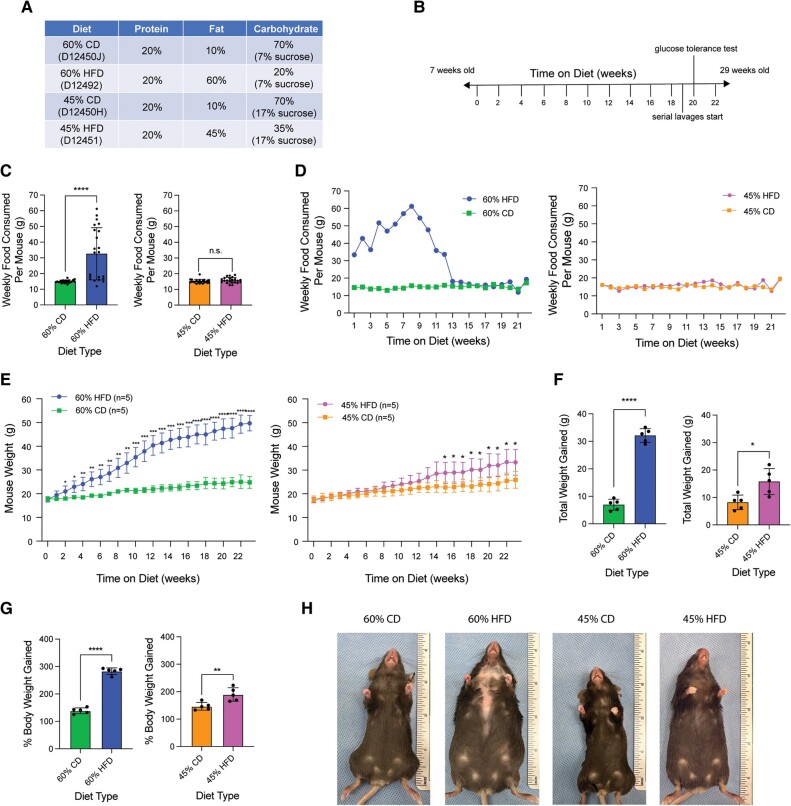
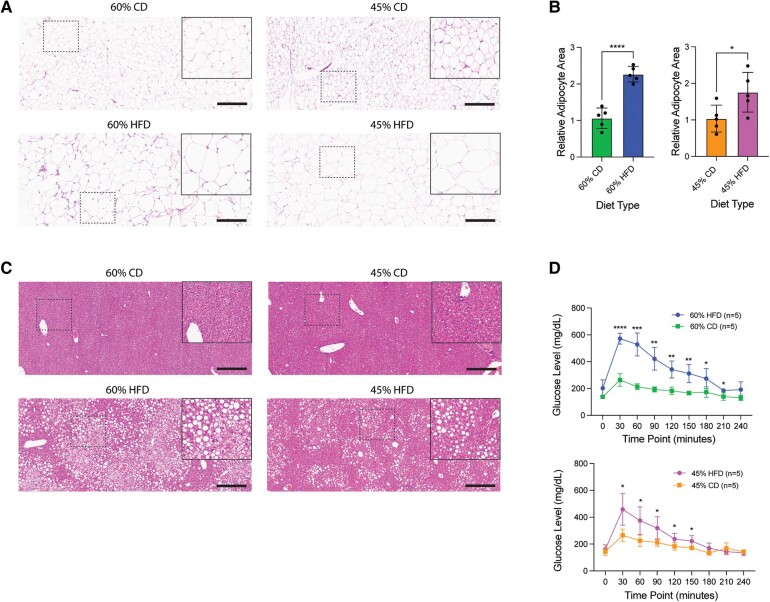
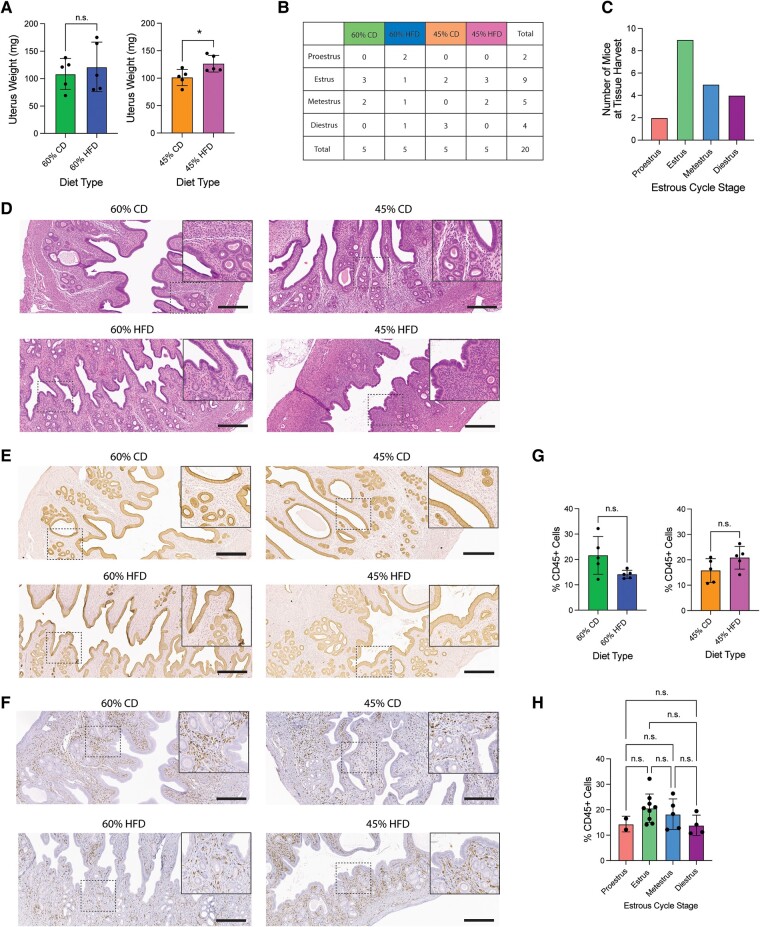
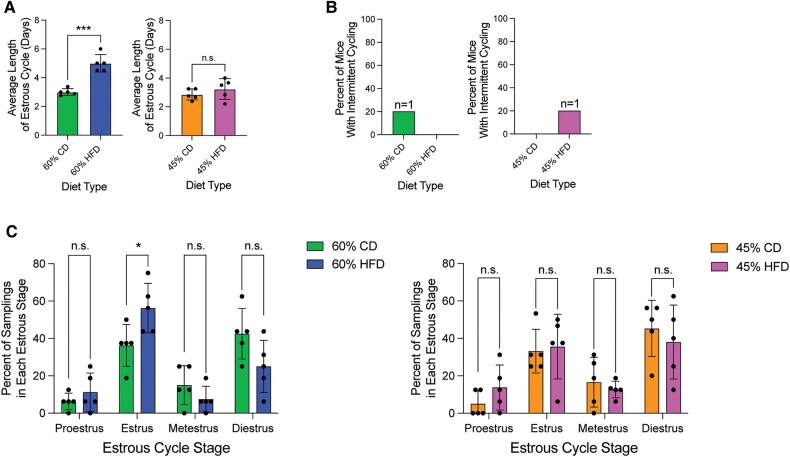
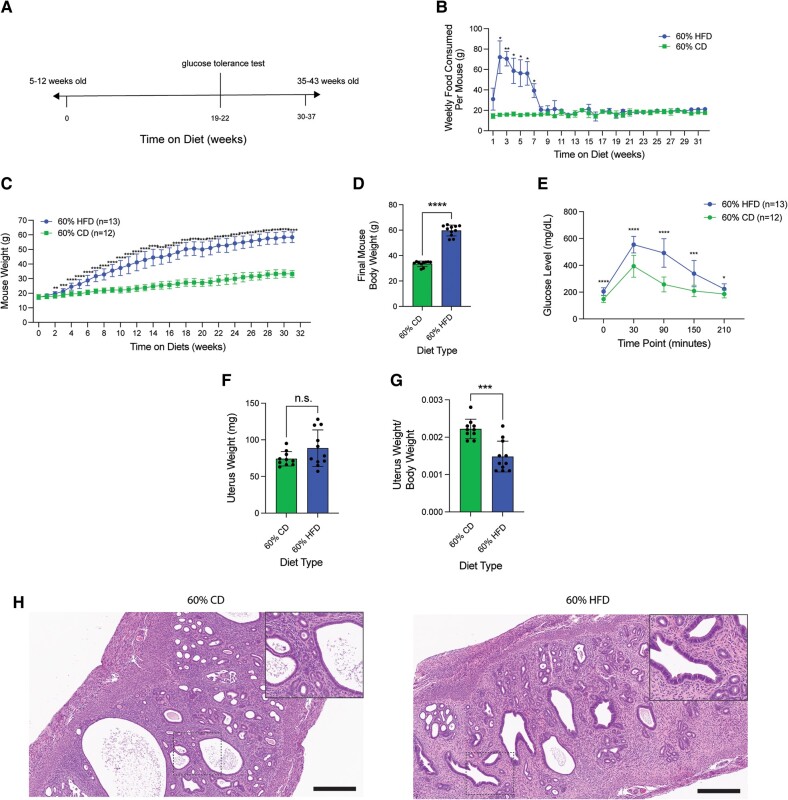
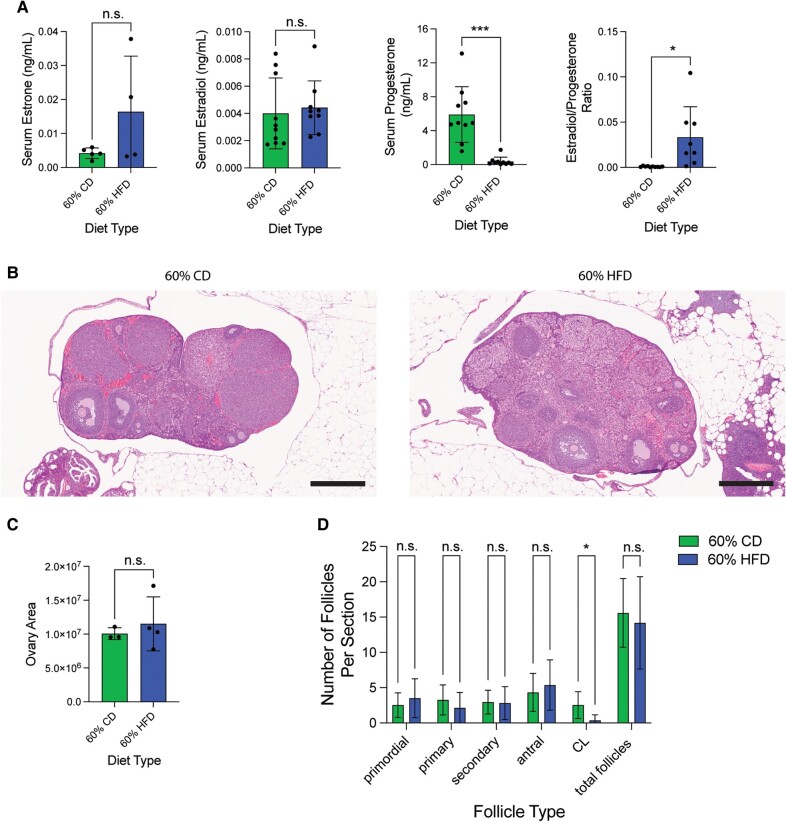
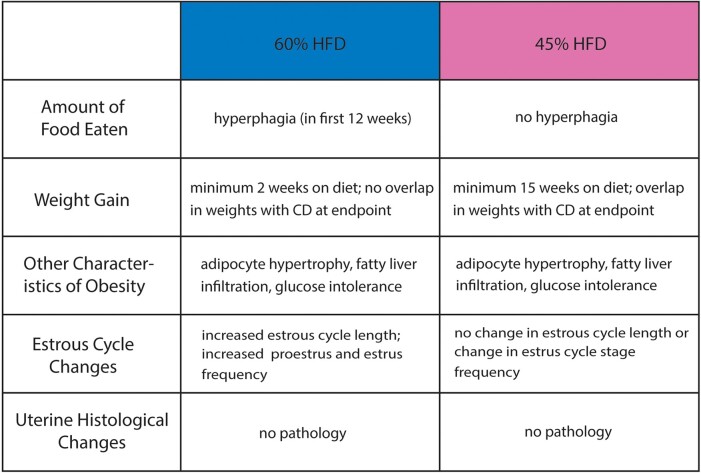
The obesity epidemic continues to increase, with half of US women predicted to be obese by 2030. Women with obesity are at increased risk for not only cardiovascular and liver disease, but also reproductive disorders. Although mouse models are useful in studying the effects of obesity, there is inconsistency in obesity-induction methods, diet composition, and mouse strains, and studies using female mice are limited. In this study, we sought to compare the effects of a 45% high-fat diet (HFD) versus a 60% HFD on the uterine estrous cycle of nulligravid C57BL/6J mice. For 22 weeks, we placed a total of 20 mice on either a 60% HFD, 45% HFD, or each HFD-matched control diet (CD). Both HFDs produced significant weight gain, with 60% HFD and 45% HFD gaining significant weight after 2 weeks and 15 weeks, respectively. Additionally, both HFDs led to glucose intolerance, fatty liver, and adipocyte hypertrophy. Mice fed 60% HFD displayed hyperphagia in the first 12 weeks of HFD treatment. Moreover, 60% HFD-treated mice had a longer estrous cycle length and an increased percentage of estrus stage samplings compared to CD-treated mice. Estrous cycle stage-controlled 60% HFD-treated mice displayed an increased estrogen-to-progesterone ratio and decreased ovarian corpora lutea compared to CD-treated mice, which may underlie the observed estrous cycle differences. There was no significant difference between diets regarding endometrial morphology or the percent of endometrial CD45+ immune cells. Our results indicate that consideration is needed when selecting a HFD-induced obesity mouse model for research involving female reproductive health.

Keywords: endometrium; estrous cycle; mouse model; obesity; ovary; uterus.


Figures

Figure 1.
Figure 1.
Both 45% and 60% HFD increase body mass compared to CD, but only 60% HFD induces hyperphagia. (A) Nutrient compositions of the 60% CD, 60% HFD, 45% CD, and 45% HFD from Research Diets, Inc. CDs are sucrose matched to their respective HFD, meaning if matched CD and HFD mice eat the same amount of calories, then they will ingest the same amount of sucrose. Macronutrient percentages are given in kcal%. (B) Experimental timeline. (C) Estimated average amount of food consumed per mouse per week (grams) for 60% HFD compared to 60% CD and 45% HFD compared to 45% CD. Measurements represent weekly (datapoint; n = 22) diet's mean ± SD. Two-tailed unpaired t-test statistic with Welch's correction. (D) Estimated average amount of food consumed (grams) per mouse separated per week over the course of the study. Weekly measurements (datapoint) represent the average amount of food consumed per mouse per diet for that week. Each treatment group filled only one cage, so average amount of food eaten per cage per week was divided by 5 for estimated average eaten per mouse per week, leaving all 5 mice in the condition with the same amount of food eaten. No statistical analysis was performed. (E) Average mouse body weight (grams) per diet over the course of the experiment. Measurements represent weekly (datapoint; n = 5 per condition) diet mean ± SD. Multiple unpaired t-tests statistic with Welch's correction. (F) Total amount of weight gained (grams) per mouse after 22 weeks on diet. Measurement (datapoint; n = 5 per condition) represents each mouse (bar = mean ± SD). Two-tailed unpaired t-test statistic. (G) Percent body weight gained by the end of the experiment (22 weeks on diet). Measurement (datapoint; n = 5 per condition) represents each mouse (bar = mean ± SD). Two-tailed unpaired t-test statistic. (H) Images of mouse body size after 22 weeks on diet. *P < .05; **P < .01; ***P < .001; ****P < .0001.
Figure 2.
Figure 2.
Both 45% and 60% HFD show adipocyte hypertrophy, fatty liver infiltration, and glucose intolerance. (A) Representative H&E stain of mouse white adipose tissue for each diet type. Main image = 10 × magnification; inset = 20 × magnification; scale bar = 300 µm. (B) Quantified mean relative adipocyte area between diets (HFD normalized to CD) using the Adiposoft plug-in for ImageJ from 10 × H&E stain of white adipose tissue. Measurements (datapoint; n = 5 per condition) are each mouse's mean adipocyte area. Bar represents diet's mean ± SD. Two-tailed unpaired t-test statistic. (C) Representative H&E stain of mouse liver for each diet type. Main image = 10 × magnification; inset = 20 × magnification; scale bar = 300 µm. (D) Blood glucose measurements (mg/dL) at 30-minute intervals after a 2 g/kg glucose injection of mice at 20 weeks on diet (n = 5 per condition). Measurements represent diet's mean ± SD. Multiple unpaired t-tests statistic with Welch's correction. *P < .05; **P < .01; ***P < .001; ****P < .0001.
Figure 3.
Figure 3.
Normal uterine histology and comparable immune cell profiles across the diets. (A) Semi-dry uterine weight (mg) at tissue harvest after 22 weeks on diet. Measurement (datapoint; n = 5 per condition) represents each mouse (bar = mean ± SD). Two-tailed unpaired t-test statistic. (B) Table summarizing estrous cycle stage at tissue harvest by diet (n = 5 per condition). (C) Graph of mouse final estrous cycle stage at tissue harvest by diet. (D) Representative H&E stain of mouse endometrial tissue for each diet type during estrus. Main image = 10 × magnification; inset = 20 × magnification; scale bar = 300 µm. (E) Representative KRT8 (epithelial marker) IHC stain of mouse endometrial luminal and glandular epithelium for each diet type during estrus. Main image = 10 × magnification; inset = 20 × magnification; scale bar = 300 µm. (F) Representative CD45 (pan-immune cell marker) IHC stain of mouse endometrial tissue for each diet type during estrus. Main image = 10 × magnification; inset = 20 × magnification; scale bar = 300 µm. (G) Comparison of average percentage of CD45+ immune cells in a representative 20 × field of view of the endometrium between diets. Measurements (datapoint; n = 5 per condition) are each mouse's mean. Bar represents diet's mean ± SD. Two-tailed unpaired t-test statistic with Welch's correction. (H) Comparison of average percentage of CD45+ immune cells in a representative 20 × field of view of the endometrium comparing final estrous cycle stages. Measurements (datapoint) are each mouse's mean. Bar represents diet's mean ± SD. Brown–Forsythe and Welch’s one-way ANOVA and Dunnett's T3 multiple comparisons test statistics. *P < .05; **P < .01; ***P < .001; ****P < .0001.
Figure 4.
Figure 4.
60% HFD alters estrous cycling. (A) Average length of estrous cycle per diet. Measurement (datapoint; n = 5 per condition) represents average cycle length per mouse (bar = diet mean ± SD). Two-tailed unpaired t-test statistic. (B) Percent of mice in each diet type that have intermittent estrous cycling (same estrous stage for 6 days or more) over the 2-week lavage period. No statistical analysis was performed. (C) Percent of occurrences in each cycle stage between each HFD and respective CD from the recorded daily lavages (n = 5 per diet). Measurement (datapoint) represents each mouse (bar = mean ± SD). Multiple unpaired t-tests statistic with Welch's correction. *P < .05; **P < .01; ***P < .001; ****P < .0001.
Figure 5.
Figure 5.
Estrous cycle stage-controlled cohort displays similar obesity-associated metabolic effects from 60% HFD. (A) Experimental timeline for additional 60% HFD and matched-CD cohorts. (B) Estimated average amount of food consumed (grams) per mouse separated per week over the course of the experiment. Measurements represent weekly (datapoint; n = 3 cages per diet type) diet's mean ± SD. Multiple unpaired t-tests statistic with Welch's correction. (C) Average mouse body weight (grams) per diet over the time course of the experiment. Measurements represent weekly (datapoint; n = 12 for CD and n = 13 for HFD) diet mean ± SD. Multiple unpaired t-tests statistic with Welch's correction. (D) Final mouse body weight (grams) at the time of tissue harvest. Measurement (datapoint; n = 10 for CD and n = 11 for HFD) represents each mouse (bar = mean ± SD.). Two-tailed unpaired t-test statistic. (E) Blood glucose measurements (mg/dL) at 30-minute intervals after a 2 g/kg glucose injection of mice at 19 to 22 weeks on diet (n = 12 for CD and n = 13 for HFD). Measurements represent diet's mean ± SD. Multiple unpaired t-tests statistic with Welch's correction. (F) Semi-dry uterine weight (mg) at estrus-staged tissue harvest after 30 to 37 weeks on diet. Measurement (datapoint; n = 10 for CD and n = 11 for HFD) represents each mouse (bar = mean ± SD). Two-tailed unpaired t-test statistic with Welch's correction. (G) Semi-dry uterine weight to mouse final body weight ratio. Measurement (datapoint; n = 10 for CD and n = 11 for HFD) represents each mouse (bar = mean ± SD). Two-tailed unpaired t-test statistic. (H) Representative H&E stain of mouse endometrial tissue for each diet type during estrus. Main image = 10 × magnification; inset = 20 × magnification; scale bar = 300 µm. *P < .05; **P < .01; ***P < .001; ****P < .0001.
Figure 6.
Figure 6.
Estrous cycle stage-controlled mice on 60% HFD display unopposed estrogen and decreased corpora lutea (A) Serum estrone (datapoint; n = 5 for CD; n = 4 for HFD), estradiol (datapoint; n = 10 for CD; n = 9 for HFD), progesterone (datapoint; n = 10 for CD; n = 10 for HFD), and estradiol-to-progesterone ratio (datapoint; n = 10 for CD; n = 8 for HFD) levels (ng/mL) from estrus-staged mice after 30 to 37 weeks on either 60% HFD or matched-CD diet. Measurement (datapoint; total measured is n = 10 for CD and n = 11 for HFD) represents each mouse (bar = mean ± SD). Two-tailed unpaired t-test statistic for estradiol, and two-tailed unpaired t-test statistic with Welch's correction for estrone, progesterone, and estradiol-to-progesterone ratio. (B) Representative H&E stain of mouse estrus-staged ovarian tissue for each diet type. 5 × magnification; scale bar = 500 µm. (C) Largest histological ovarian area for each mouse after 30 to 37 weeks on diet. Measurement (datapoint; n = 4 for CD; n = 3 for HFD) represents each mouse (bar = mean ± SD). Two-tailed unpaired t-test statistic. (D) Average number of different follicle types per histological section in each diet-treatment type (n = 19 slides for CD; n = 22 slides for HFD). Bar = mean ± SD. Two-tailed unpaired t-test statistic for all follicle types except CL. Two-tailed unpaired t-test statistic with Welch's correction for CL. *P < .05; **P < .01; ***P < .001; ****P < .0001.
Figure 7.
Figure 7.
Summary of physiological effects from 60% and 45% HFD in female C57BL/6J mice. Table summarizing the similarities and differences of several general obesity-associated and reproductive tract-specific changes occurring in C57BL/6J female mice in response to 60% HFD and 45% HFD (when each compared to their respective CD).

References

    1. Ward ZJ, Bleich SN, Cradock AL, et al. Projected U.S. State-level prevalence of adult obesity and severe obesity. N Engl J Med. 2019;381(25):2440‐2450. - PubMed
    1. Edman CD, MacDonald PC. Effect of obesity on conversion of plasma androstenedione to estrone in ovulatory and anovulatory young women. Am J Obstet Gynecol. 1978;130(4):456‐461. - PubMed
    1. Jungheim ES, Moley KH. Current knowledge of obesity's effects in the pre- and periconceptional periods and avenues for future research. Am J Obstet Gynecol. 2010;203(6):525‐530. - PMC - PubMed
    1. Wise MR, Jordan V, Lagas A, et al. Obesity and endometrial hyperplasia and cancer in premenopausal women: a systematic review. Am J Obstet Gynecol. 2016;214(6):689.e1‐689.e17. - PubMed
    1. Wei S, Schmidt MD, Dwyer T, Norman RJ, Venn AJ. Obesity and menstrual irregularity: associations with SHBG, testosterone, and insulin. Obesity (Silver Spring). 2009;17(5):1070‐1076. - PubMed

LinkOut - more resources